energy and catalysts
 Call Kai
 Learn
Learn Practice Test
 Spaced Repetition
 Match
Match Flashcards
 Knowt Play
1/30

There's no tags or description
Looks like no tags are added yet.
Name | Mastery | Learn | Test | Matching | Spaced | Call with Kai | Chat |
|---|
No analytics yet
Send a link to your students to track their progress
31 Terms
photosynthesis
formation of carbohydrates (C6H12O6), oxygen
formed by CO2(g), H2O(l), sunlight energy
catalyzed by chlorophyll in green parts of plant
6 CO₂(g) + 6 H₂O(l) + energy → C₆H₁₂O₆(aq) + 6 O₂(g)

photosynthesis energy diagram
reactants have less chemical potential energy than products
endothermic
energy is a reactant
ΔrH is positive
cellular respiration
reverse of photosynthesis
organisms take in glucose, oxygen gas
produce CO2(g), H2O(l), ATP
C₆H₁₂O₆(aq) + 6 O₂(g) → 6 CO₂(g) + 6 H₂O(l) + energy

cellular respiration energy diagram
heat released in small amounts - liquid
exothermic
energy is a product
reactants have more chemical potential energy than products
ΔrH is negative
combustion
hydrocarbons burned in presence of oxygen
produce CO2, H2O(g)
x Hydrocarbon + x O₂(g) → x CO₂(g) + x H₂O(g)

combustion energy diagram
heat released in large amounts - vapour
exothermic
energy is a product
reactants have more chemical potential energy than products
ΔrH is negative
cellular respiration vs complete combustion
cellular respiration releases more energy than complete combustion
collision theory
chemical reaction needs particles to collide in the correct orientation and enough energy
needs more collisions to increase rate of reaction

effective collision
correct orientation
enough energy
chemical reaction

ineffective collision
wrong orientation
not enough energy
no chemical reaction
increasing collisions
increase temperature
increase surface area
increase concentration
introduce catalyst
decrease volume
increase temperature
speed up molecules to increase energy
increase surface area
increase area for proper orientation
increase concentration
increase number of molecules
introduce a catalyst
increases rate of reaction
decrease volume
decrease distance molecules travel
activation energy
minimum energy required to initiate a reaction by breaking bonds in the reactants
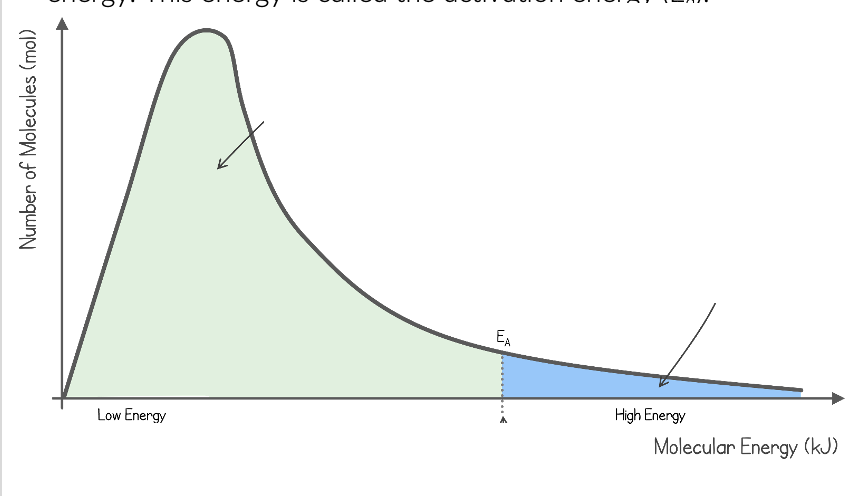
Boltzmann Distribution Curve
distribution of energy at certain temperatures
EA line: at or above, molecules have enough energy for collision
green: ineffective collisions, not enough eenrgy
blue: enough energy - reaction
Boltzmann Distribution Curve change in temperature
result in an increase in average energy of molecules and rate of reaction
more collisions - particles gain kinetic energy, move faster
molecules have higher kinetic energy than activation energy
bond breaking
heat taken from surroundings
endothermic
bond making
heat released to surroundings
exothermic

endothermic
energy needed to break bonds is greater than energy released
positive enthalpy

exothermic
energy released to form bonds is greater than energy taken in
negative enthalpy
creating Reaction Pathway Diagrams
balance chemical equation
exothermic or endothermic
draw curve for transition state
draw arrows for activation energy and enthalpy values
Catalyst
rate of a chemical reaction is increased
providing reactants with alternative reaction pathway
decrease activation energies
catalyst process
molecule binds catalyst
increased rate of disociation
released from catalyst (catalyst has not changed shape)
positive catalyst
increase rate of reaction
decrease activation energy
accept smaller energetic pathway
negative catalyst
decrease rate of reaction
increase activation energy
less effective collisions
examples of catalysts
enzymes
catalyze reactions in living cells
Heterogeneous Catalysts in Catalytic Converters
nitrogen oxide → nitrogen gas
carbon monoxide → carbon dioxide
transition state
chemical bonds are partially broken and formed
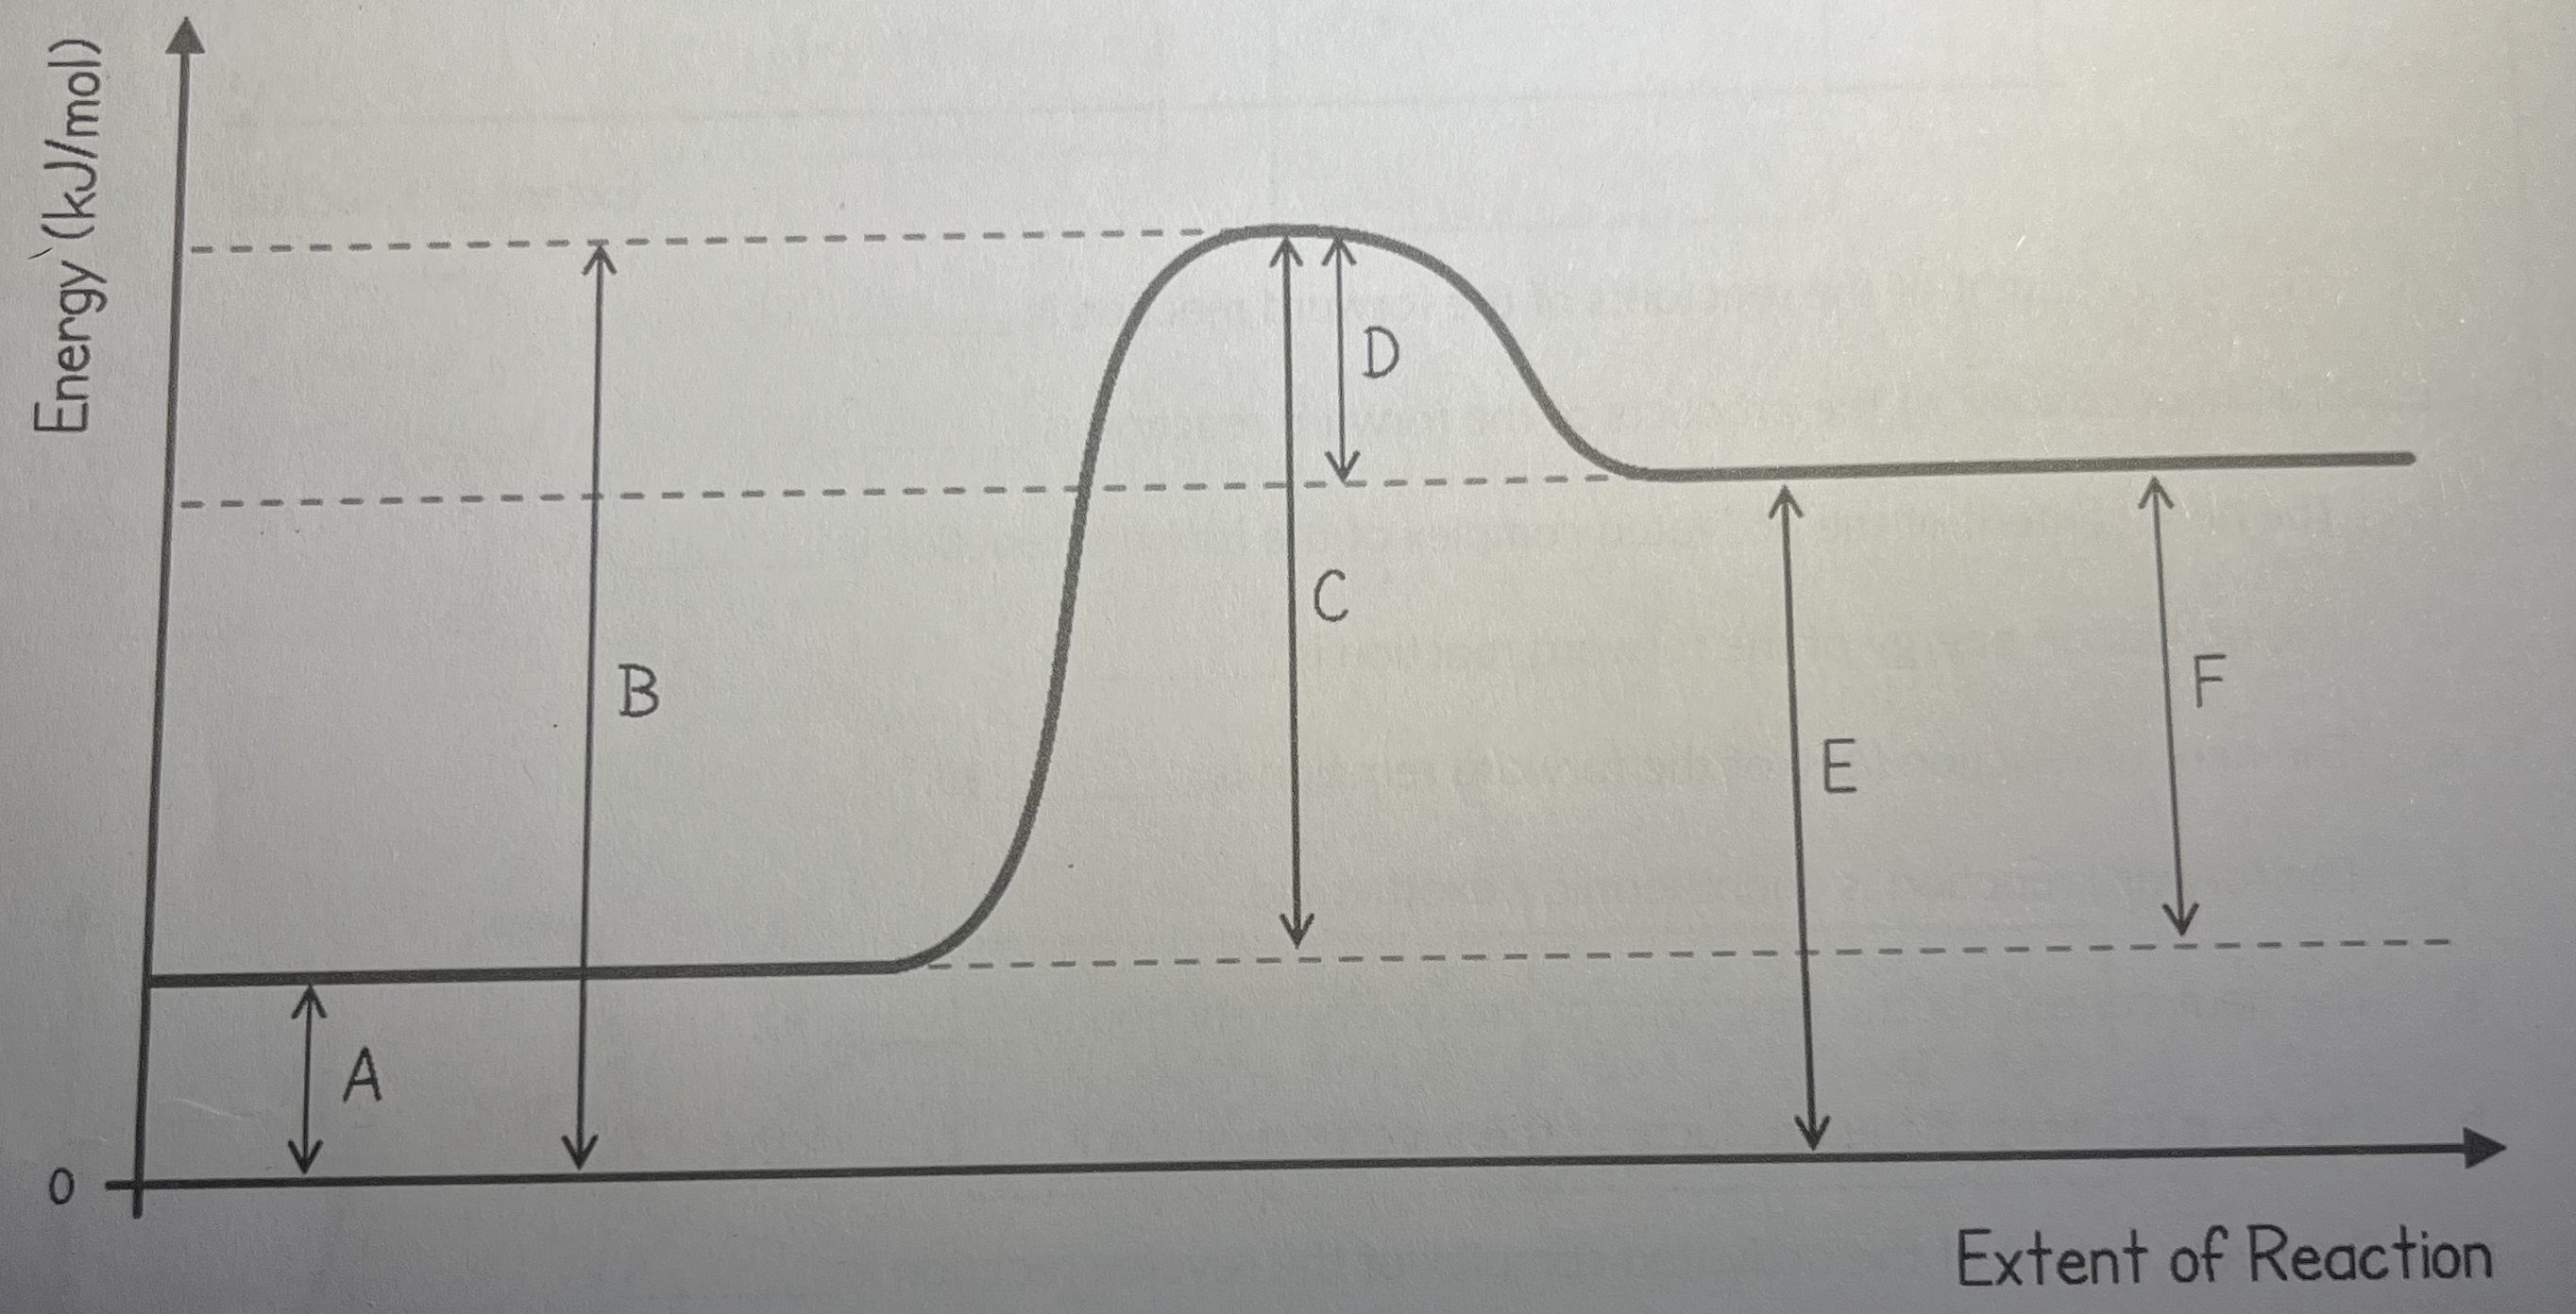
Reaction pathway diagram
A: potential energy of reactants
B: potential energy of transition state
C: energy of activation (forward reaction)
D: energy of activation (reverse reaction)
E: potential energy of product
F: enthalpy change