Chapter 4: Specific factors and Income Distribution
5.0(4)
5.0(4)
Card Sorting
1/17
Earn XP
Description and Tags
Study Analytics
Name | Mastery | Learn | Test | Matching | Spaced | Call with Kai |
|---|
No study sessions yet.
18 Terms
1
New cards
The specific factors model
Assumes an economy that produces 2 goods and where labour (the mobile factor) can move freely between these two industries.
Some resources are fixed (specific) and can only be used for production in ONE of the industries.
Some resources are fixed (specific) and can only be used for production in ONE of the industries.
2
New cards
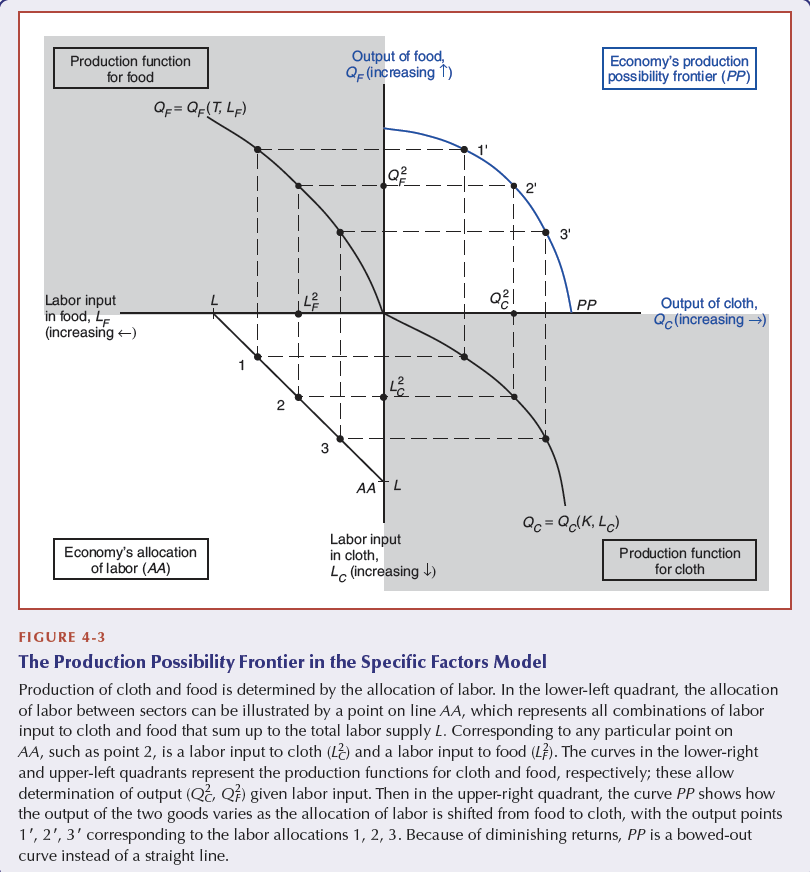
Production functions
The book example uses 3 factors, Capital (K), Labour (L), and Land (T)
One good (cloth, C) only uses labour, but not land and food use land, but not capital.
The production function (for cloth) is given by: Q_c=Q_c(K,L_c)
The production function (for food) is given by: Q_f=Q_f(T,L_c)
Where Lc+Lf=L
One good (cloth, C) only uses labour, but not land and food use land, but not capital.
The production function (for cloth) is given by: Q_c=Q_c(K,L_c)
The production function (for food) is given by: Q_f=Q_f(T,L_c)
Where Lc+Lf=L
3
New cards
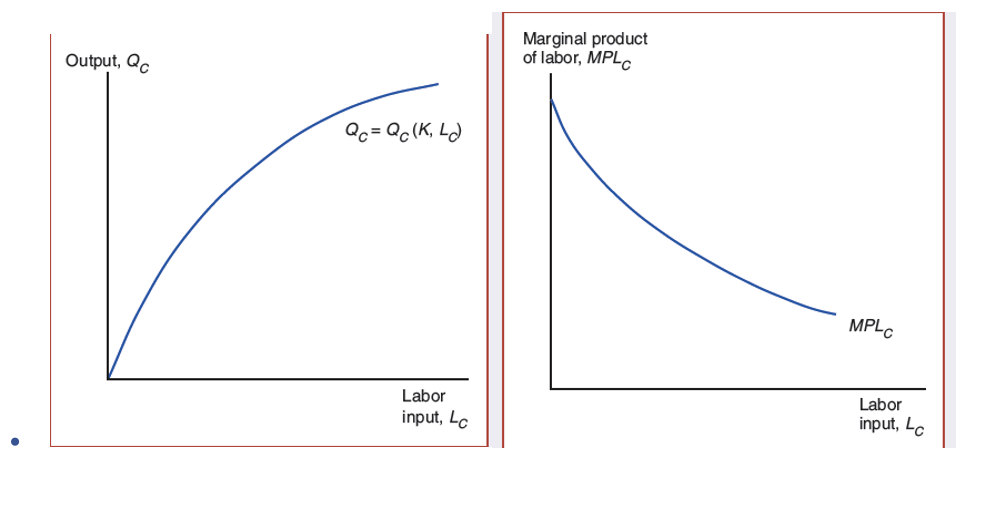
Diminishing returns to scale
If only one resource is increased (let's say L) without increasing the other (K), the output per unit of input will increase less and less as more workers have less to work with
4
New cards
Marginal Product of Labour (MPL)
the output generated by increasing the input of labour by one
5
New cards
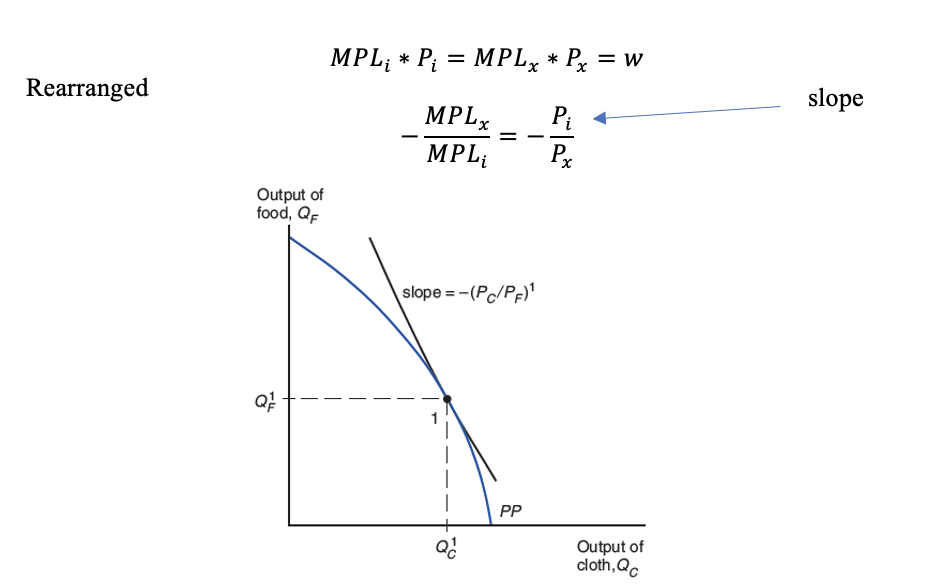
Slope of PP curve
given by =-MPLf/MPLc (when it is food in terms of cloth)
the opportunity cost of marginal labour productivity
the opportunity cost of marginal labour productivity
6
New cards
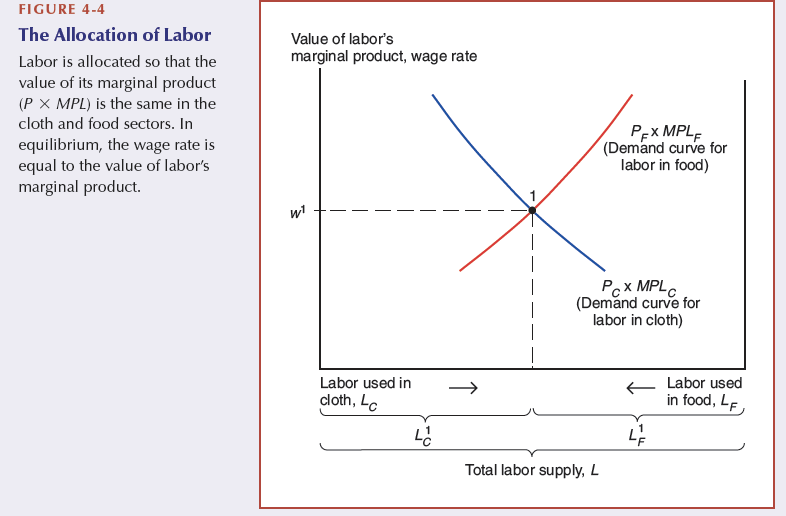
wage rate of labour
given by MPL_i*P_i=w_i
employers will hire up until this point
if the price decreases, more workers hired
employers will hire up until this point
if the price decreases, more workers hired
7
New cards
Allocation of labour
8
New cards
Equilibrium
Where the the slope of the curve equals =-Pi/px
9
New cards
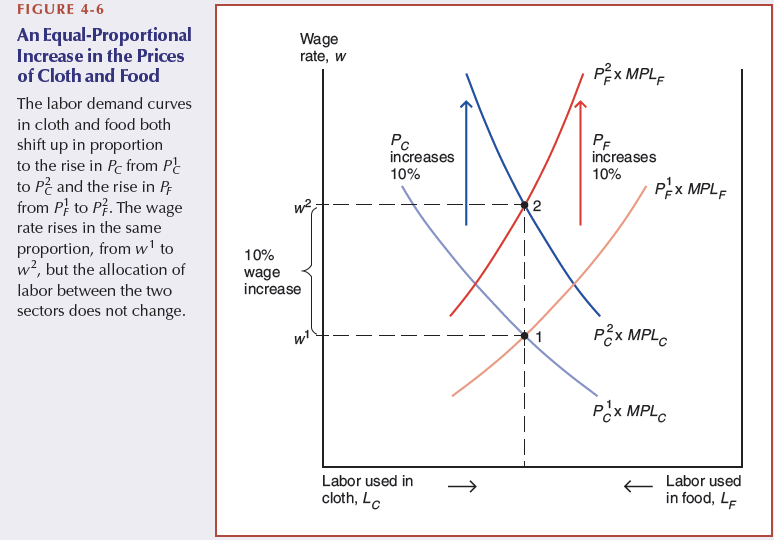
Equal-proportional increases in prices
wages increase, but labour allocation stays the same
10
New cards
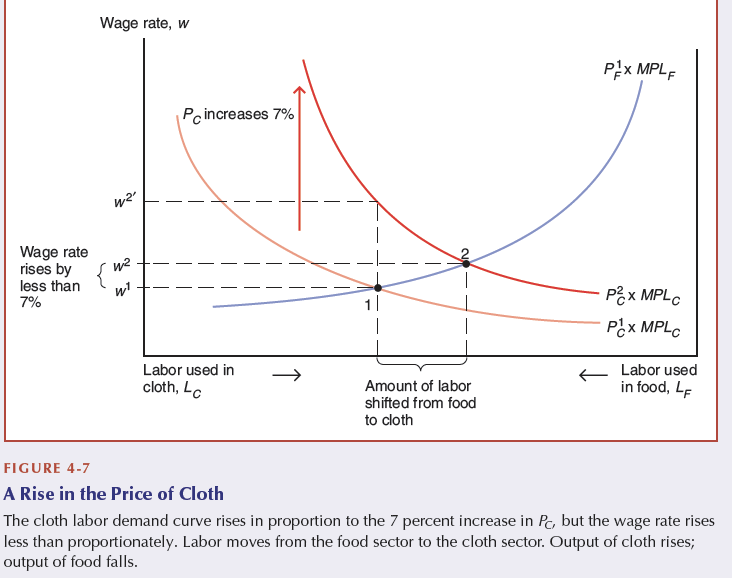
Changes in relative prices
Labour moves from one sector to another
11
New cards
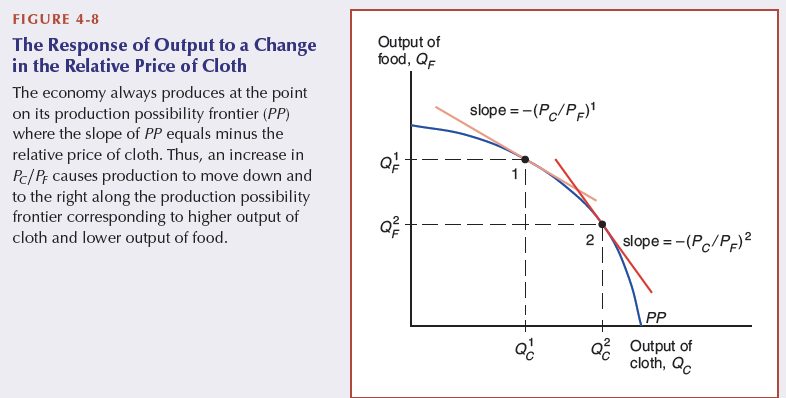
The relationship between output and relative prices
12
New cards
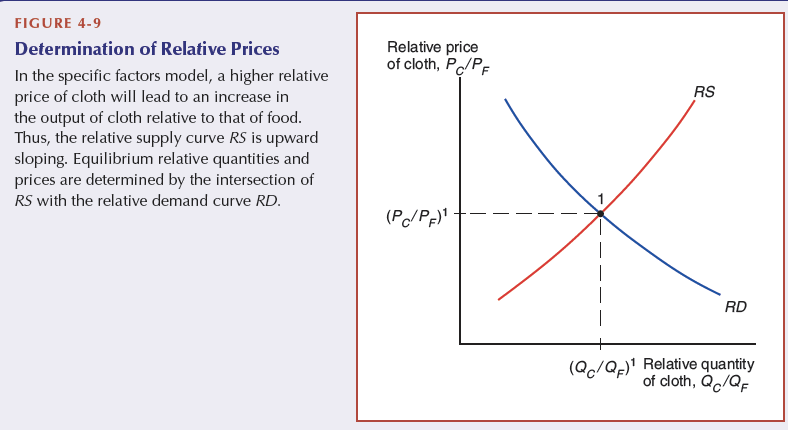
Determination of relative prices
13
New cards
Who gains from trade in the specific factors model?
The factor specific to the sector whose relative price increases is definitely better off.
The factor specific to the sector whose relative price decreases is definitely worse off.
The change in welfare for the mobile factor is ambiguous.
The factor specific to the sector whose relative price decreases is definitely worse off.
The change in welfare for the mobile factor is ambiguous.
14
New cards
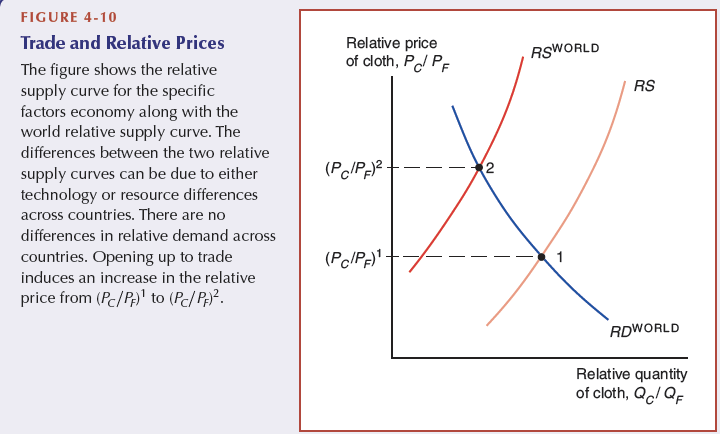
Trade and relative prices
For trade to take place:
Free trade P ≠ autarky P
in free trade, Home will export the good where the relative prices have increased and will export the good where the relative price have decreased
Free trade P ≠ autarky P
in free trade, Home will export the good where the relative prices have increased and will export the good where the relative price have decreased
15
New cards
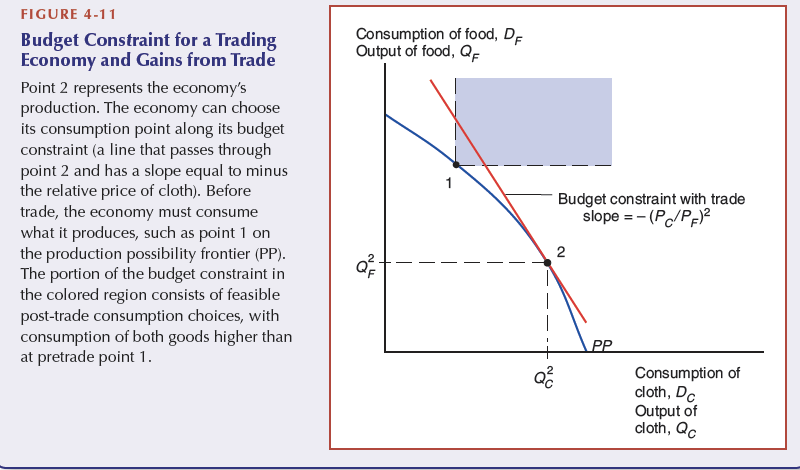
Aggregate gains from trade
In absence of trade, the output, Q, must equal the consumption (demand), Di = the demand for a good.
Qi=Di
Free trade allows different consumption patterns. But a country CAN NOT spend more than they earn. The value of production must be equal
Pi * Di + Px * Dx = Pi * Qi + Px * Qx
can be rearranged to show the imports of "i" in an open economy when demand exceeds production. The budget constraint equation is rewritten from the equation above:
Di - Qi = (Px/Pi) x (Qx/Dx)
A country must export more of the other good to afford the imports:
(Px/Pi) x (Qx/Di)
shows the relative price of the export good and the amount that exceeds own consumption
16
New cards
Budget constraint slope
=-(Px/Pi)
17
New cards
Losers from trade
The immobile factor owners in the (now) import-industry
Real world: Low-skilled workers in developed countries have a hard time transitioning into high-skilled labour that is demanded in their export industry. The people who are losing from trade, will protest it >< winners are less vocal
→ Solution? safety net for low-skilled workers
Real world: Low-skilled workers in developed countries have a hard time transitioning into high-skilled labour that is demanded in their export industry. The people who are losing from trade, will protest it >< winners are less vocal
→ Solution? safety net for low-skilled workers
18
New cards
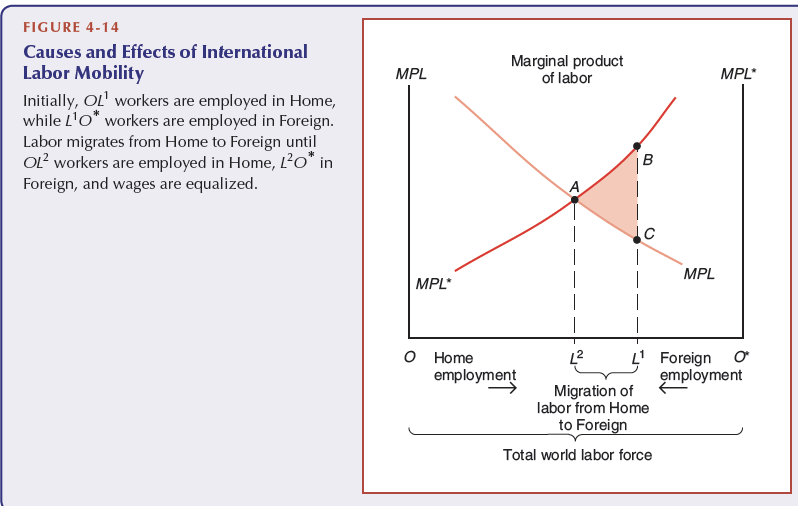
International labour mobility
