BIEB 146 weeks 6-10 material (new material after the midterm)
1/138
Earn XP
Description and Tags
is 2/3 of the final material covered, week 6 (is part of genome diversity in space) & weeks 7-10 (are part of genome diversity in time)
Name | Mastery | Learn | Test | Matching | Spaced | Call with Kai |
|---|
No analytics yet
Send a link to your students to track their progress
139 Terms
GWAS may be biased, but are GWAS inherently biased? explain & give 2 reasons how to fix this
GWAS not inherently biased, but the disproportionate use of tagSNPs from European ancestry haplotype block is
can fix by:
doing more GWAS (genome wide association studies) with non-European ancestry groups
shifting away from tagSNPs, and move towards whole-genome sequencing (WGS) instead that can capture more variation
def. IndiGenomics (from tedtalk)
genetic research to improve minority health through knowledge methods that respect indigenous knowledge
educating indigenous communities on the potential use and misuse of genetic info
see indigenous people as partners in genetic research, not subjects (like Father Damien who immersed himself in indigenous culture regarding the research community)
3 limitations of GWAS
tagSNPs used on SNPchips only indicate region of genome; so have to do extra work to figure out the causative SNP (out of the inferred/imputed SNPs associated with tagSNP) from the results of the SNPchip
tagSNPs may not have the same inferred SNPs in different ancestry groups
SNPchips still (are missing/don’t include all) genetic contributors to phenotype
def. penetrance and heritability
what does each mean for a range from 0 to 1
penetrance - fraction of people carrying allele for a condition that actually displays the trait (aka proportion of displaying trait given the specific carrying allele for a condition)
0 (incomplete), 1 complete)
heritability - fraction of variation in a trait that is explained by genetics
0 is none, 1 is all
review: what is the phenotypic equation
genotype, environment, expression/penetrance, experience → phenotype
SNPs found in GWAS only explain about - of variation in heritability
only explain about ½ of variation in heritability
def. epigenetics
semi-permanent changes in DNA expression that may be partially heritable
(aka stable, heritable changes to genome that can change gene/DNA expression without changing the underlying DNA sequence)
(3) possible causes of missing heritability problem (aka when SNPs found in GWAS don’t explain heritability)
phenotype are very polygenic
so lots of SNPs have small effect
so particular combinations of particular alleles → (may have epistatic effects)
phenotypes are determined by epigenetics (semi-permanent changes in DNA expression that may be partially heritable), not determined by sequencing/DNA sequences
twin studies give overestimate of heritability
does ancestry matter in making GWAS & imputation less biased and more relevant for people of all races?
is there biological evidence for race?
yes
no
% of genes in human genome
% of variation/SNPs is found in the human genome?
% of variation being region-association variation (aka b/w regions/population) vs global variation
% of variation-associated variation being between local population within a region
% of genes in human genome: 1.5%
% of variation/SNPs is found in the human genome: 0.1%
% of variation being region-association variation (aka b/w regions/population): 15% AND global variation: 85%
% of variation-associated variation being between local population within a region: ~7%
def. population structure
genome difference (~7%) that tend to cluster with geographic origin (aka is variation b/w populations within a population)
def. private allele, give percentage, BUT…
alleles that are specific to one population/region among a group of populations/regions being studied (aka that specific allele is found only in one region of the globe/world)
7.5%
BUT most private alleles are rarely found in regional population → so <1% private alleles
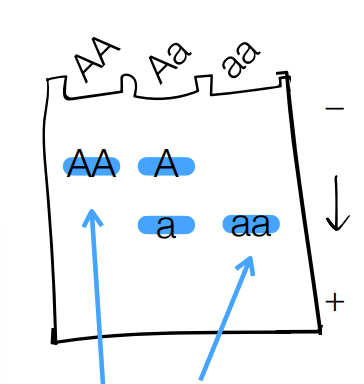
explain what the single band (aka no overlap) mean vs double band mean
single (ex: AA, aa) are homozygous bands that represent “double doses” of a protein → so is 2 copies of an allele
double band (w/ overlap aka middle column in this picture) → is 1 copy of a gene (aka allele)

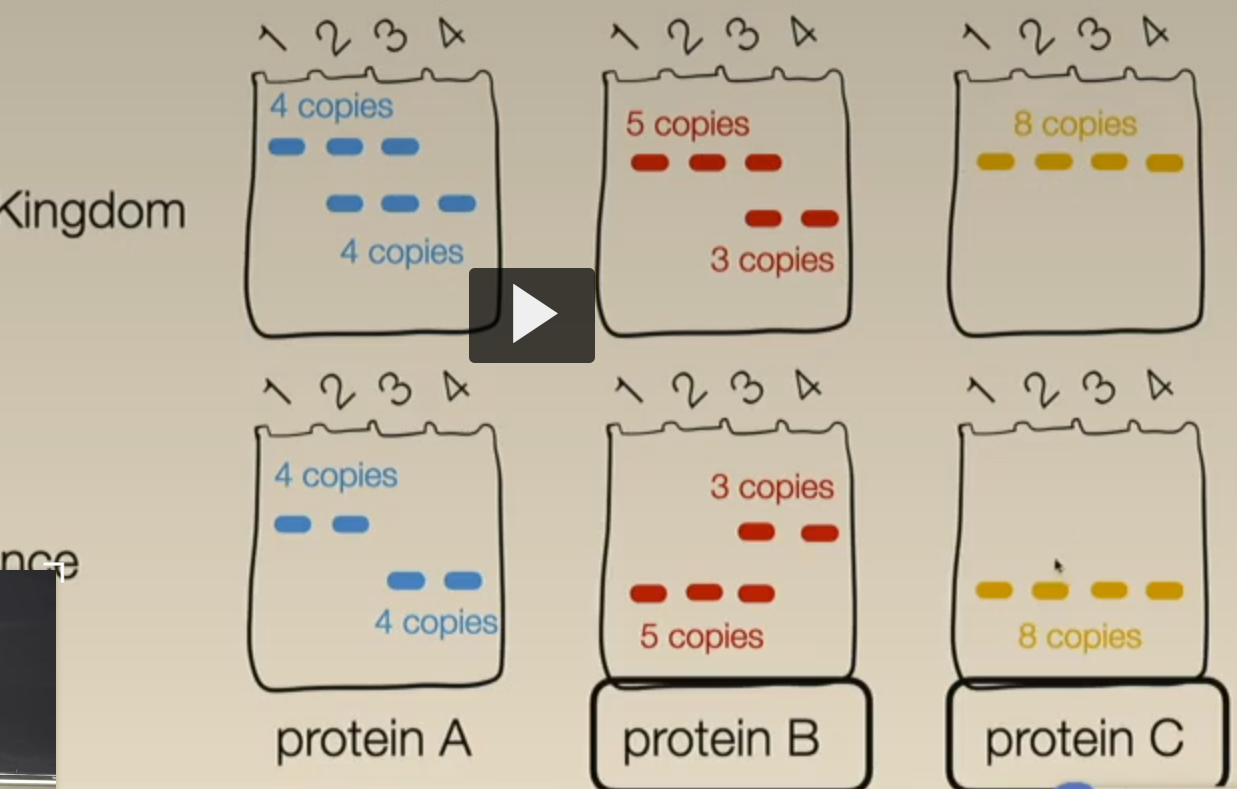
where Each of the numbers (1-4) represent a person & we isolated 3 proteins (A, B, C) from each person
B and C
region-associated SNP means different b/w populations/regions
B b/c (is just a difference in frequencies where there’s more of the top allele in the UK vs. more of the bottom allele in France AKA different band locations)
C b/c are private alleles (aka alleles found in specific region/population within larger compared populations/regions)
UK bands are located higher than France bands
not A b/c some of the bands are the same in b/w UK and France
ignore above instructions, and follow below instead:
count have many copies of a gene/alleles for top vs bottom bands for protein A and C & how many copies of each allele
(remember that a single band is ‘double doses’ of the protein aka a homozygous band & counts as 2 copies of the allele)
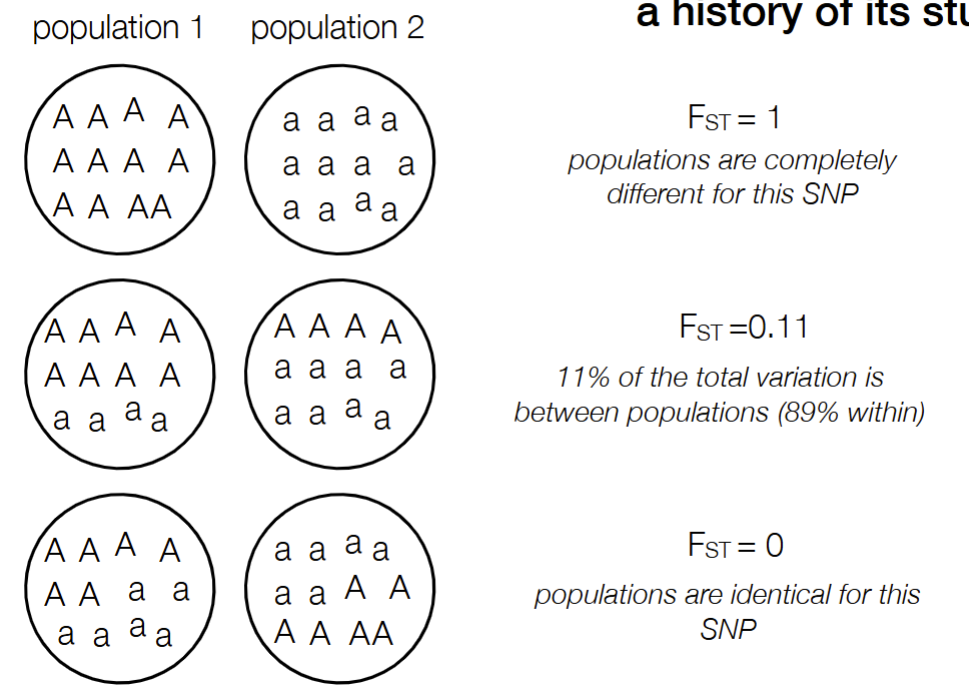
what does it mean when FST is 1, example number of 0.11, and 0
FST = 1: populations are completely different for this SNP
FST = 0.11: 11% of total variation is between populations
FST = 0: population are identical for this SNP
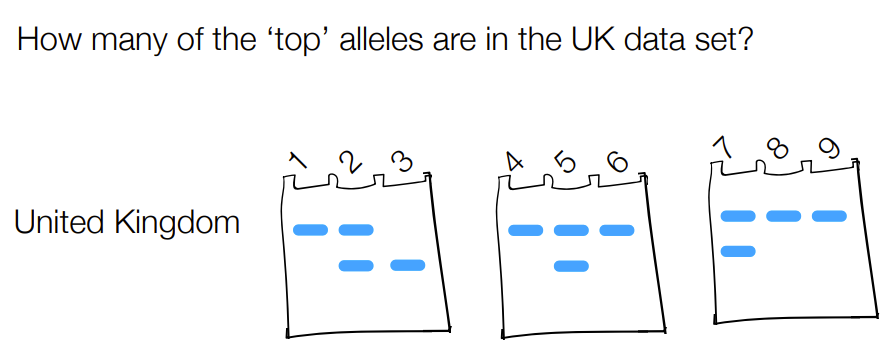
Remember: two copies of a genome
from 1 to 8: 2 +1 + 2 + 1 + 2 + 1 + 2 +2 = 13
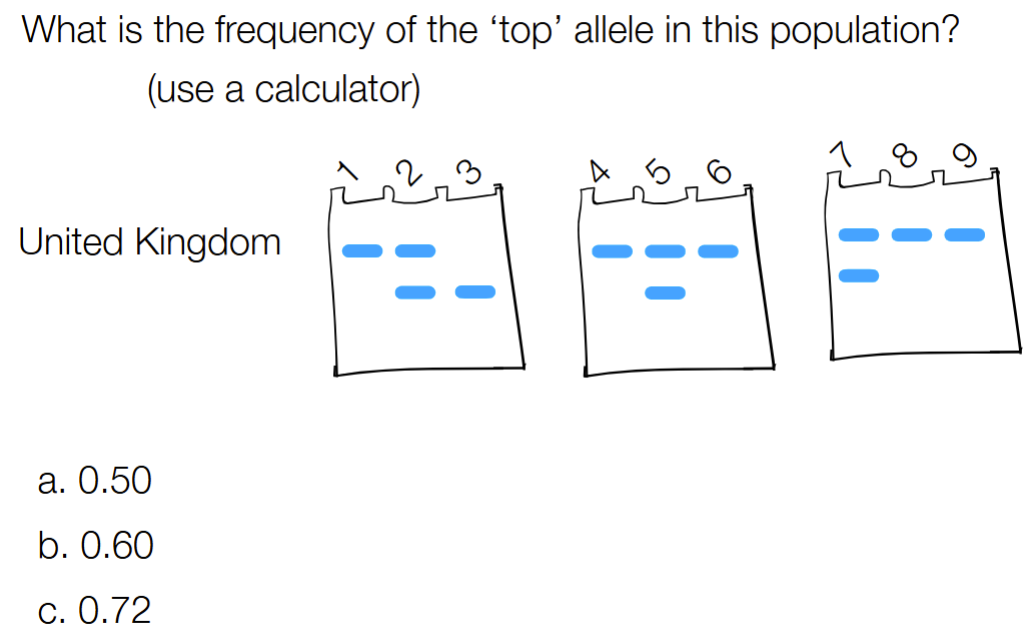
13/(13+5) = 0.722
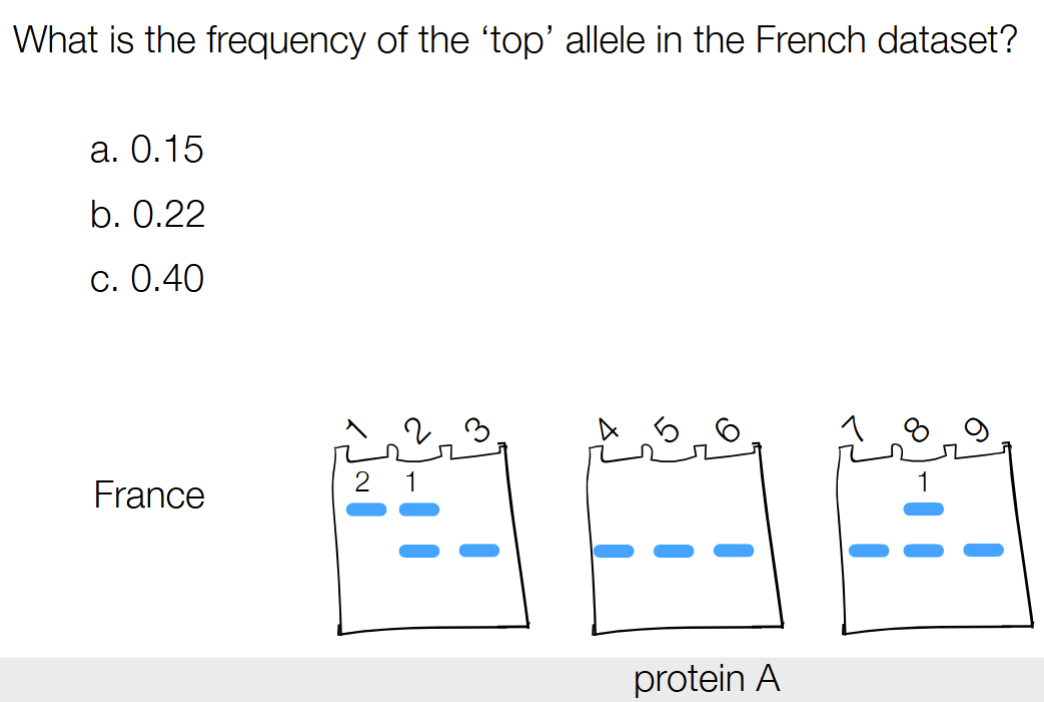
B
4/(4+18) = 0.222
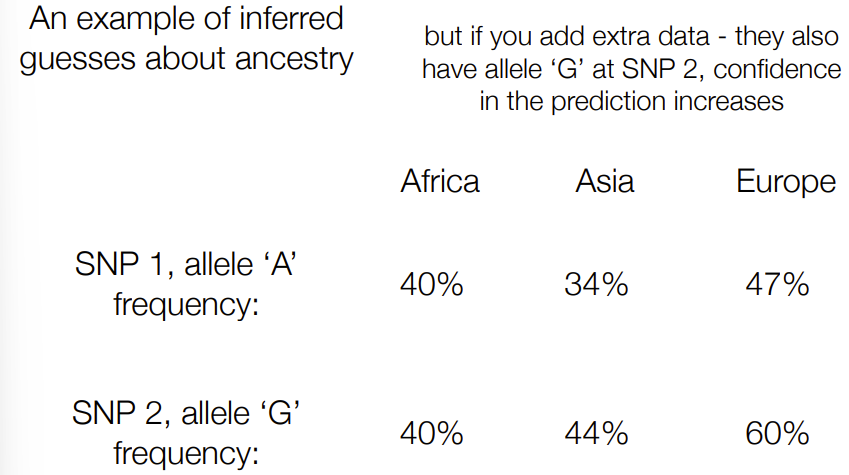
how to overcome limit of observing heritability in relation to human genomic variation BY using inferred guesses about ancestry?
adding information from more loci (like from hundred of loci) to make it easier to make guesses about where a person if from given their associated high % alleles/SNPs frequencies
def. racial genetic essentialism
what are the related 2 assumptions
used to justify (1)
earlier vs now
belief that racial groups have different underlying genetic factors which cause them to differ physically, cognitively, or behaviorally
assumptions: uniformity within group & discreteness of group
used to justify racial oppression
earlier: inheritance and genetics support and enable inequity, eugenics, genocide
now: understanding of genetics (genomics) shows that there is no true reasoning for genetic essentialism
def. population genomics
how we understand population structure (aka private alleles - alleles associated with a local population/region among comparative populations/regions)
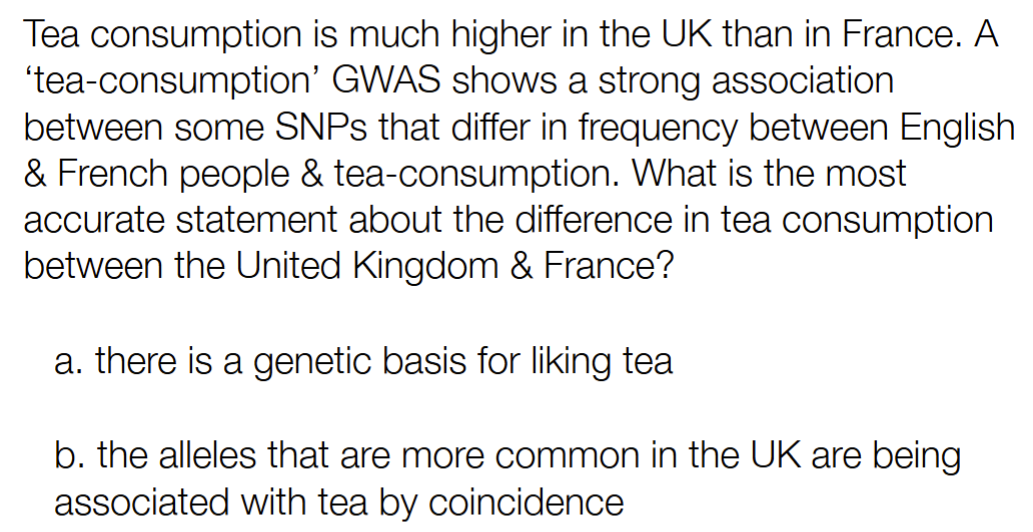
B
Not solely due to the association of alleles (A), but also consider the history, cultures, trends, etc.
def. racial realism vs racial anti-realism (both are bad)
def. racial constructivism
racial realism - belief that race is biologically real and there’s race-associated traits due to genetics
obvious bad actors, misled public
racial anti-realism - belief that there is no such thing as race
“colorblindness”
__
racial constructivism - belief that race is real, but not b/c of biology
where racial disparities in health is not mostly due to race, but due to racism
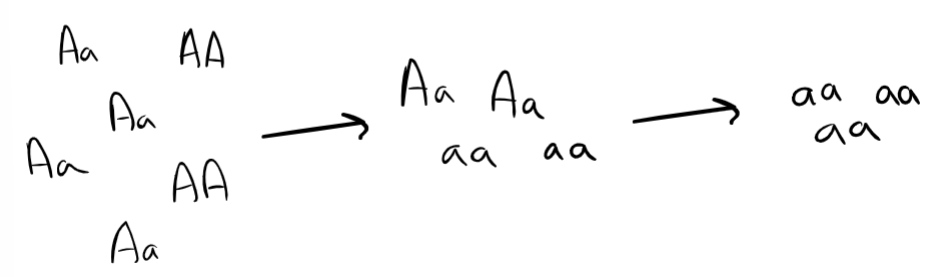
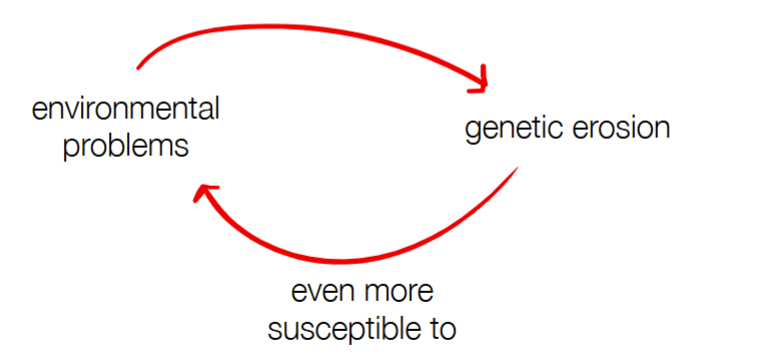
def. genetic erosion, caused by …
loss of genotypes and haplotypes (a block of genotypes) in a population
caused by when individuals can’t survive and reproduce so their genomes are lost from the population ‘gene pool’
what prevents survival and reproduction (3)
extreme genetic erosion often caused by - (def.), this term can result in …
habitat loss (ie deforestation)
habitat fragmentation (ie population divided by building of freeway)
human use (ie overfishing)
____
extreme genetic erosion mainly from bottlenecks (catastrophic loss of large fraction of a population → to get very small surviving population)
bottlenecks can result in “loss of heterozygosity”
why is low genetic diversity bad (aka what does it cause) (2)
reduces adaptive potential (less variety for natural selection to occur if there are environmental changes)
inbreeding depression (reduces ability to survive and reproduce b/c of breeding between closely related individuals)
how can genomics help? (~2)
measure diversity by
surveillance/early warning
can guide management decisions
for wildlife corridors
transport
captive breeding
understand diversity by
understand what parts of genome are most important for survival/adaptation
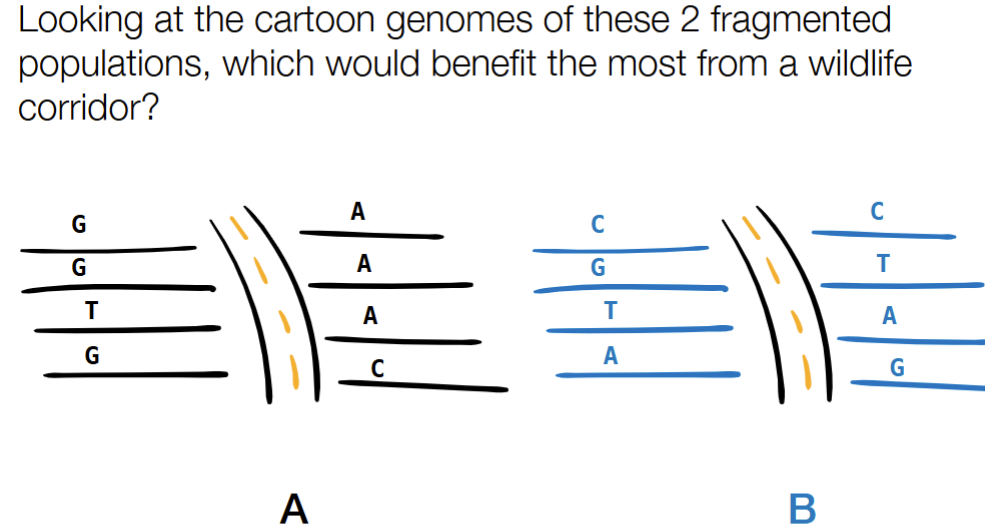
A
to reintroduce diversity of alleles w/ wildlife corridors (which allow physical transport from one environment into another to increase diversity)
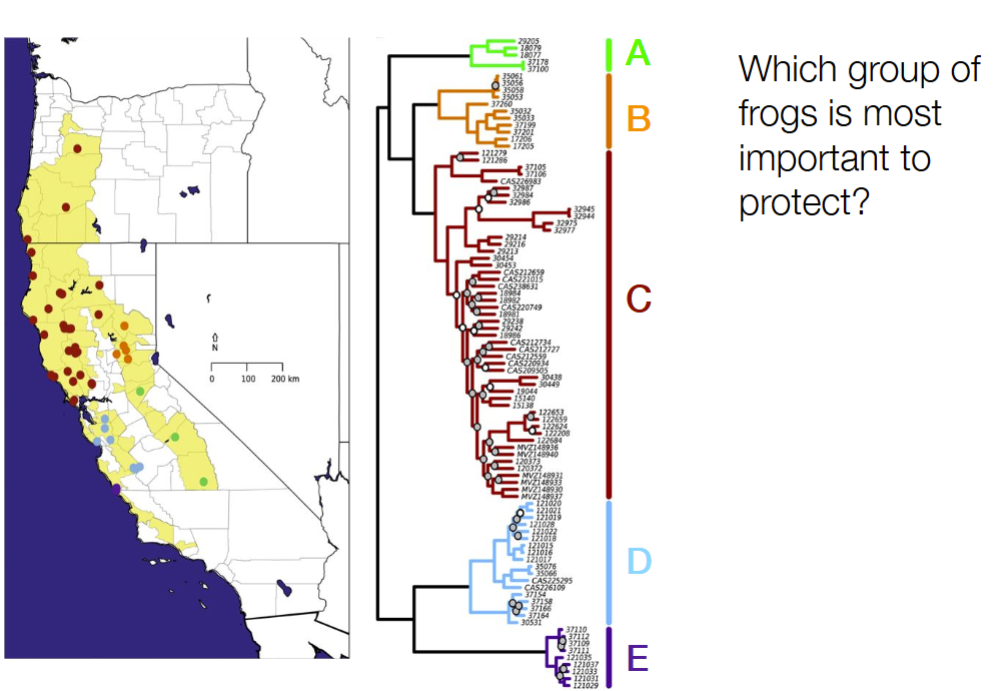
(no correct answer, just as long as have justifiable reasoning)
can be E b/c it is in one geographically isolated population when you look at the map, so has a good chance that it won’t be integrated with the rest of the population
can be C b/c is the most diverse
can be A b/c is the least diverse and most easy to die out and no longer be part of the ‘gene pool’
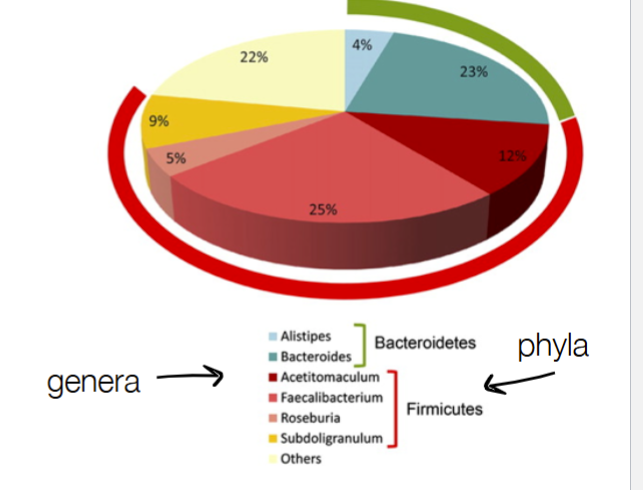
def. environmental DNA & metagenomics
environmental DNA : DNA from variety of sources in a specific environment
metagenomics: simultaneous analysis of all genomes in a sample
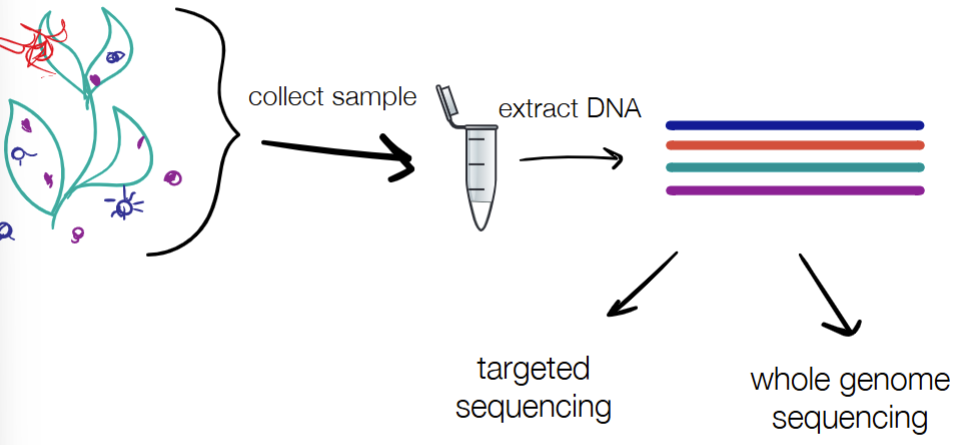
process of metagenomics
collect sample
extract DNA
targeted/marker-based sequencing OR WGS
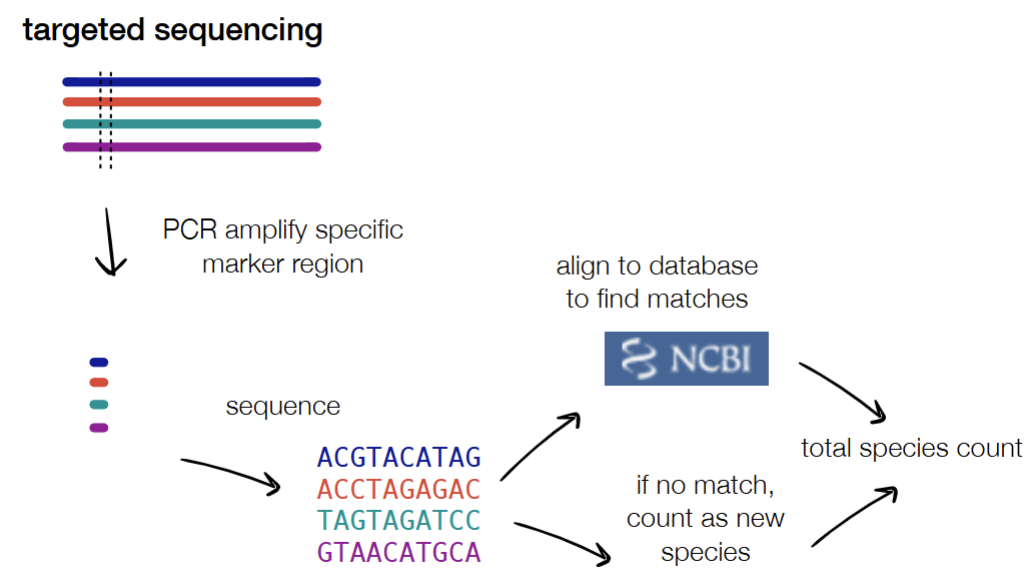
targeted sequencing: use PCR to amplify specific marker region → sequence → align to find matches
“who’s there”
“how many are there”
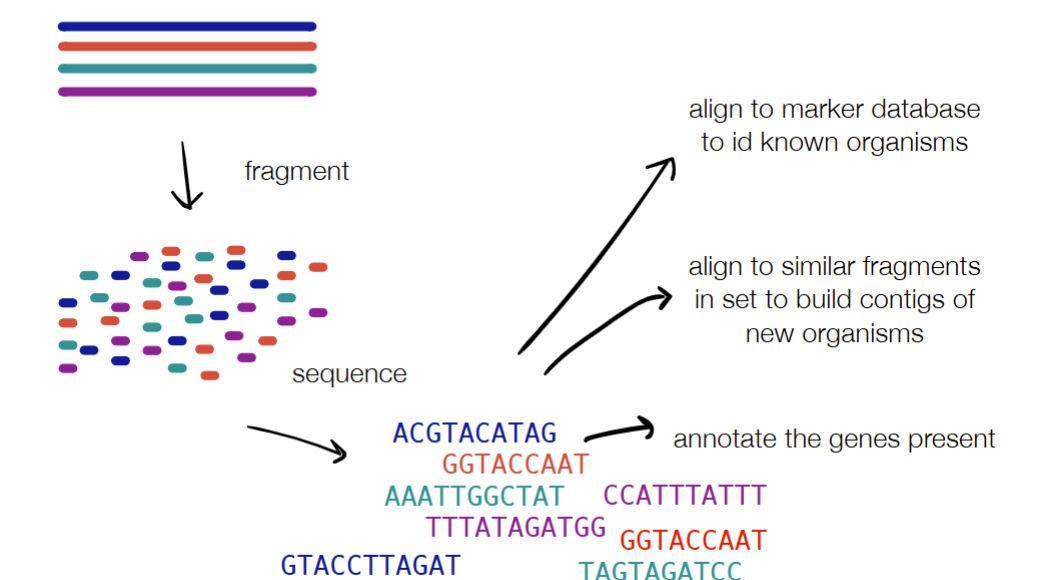
WGS: fragment → sequence → align to marker database to ID known organisms OR align to similar fragments in the OR annotate the genes present (w/ ORFinding or homology in databases)
“what genes are there”

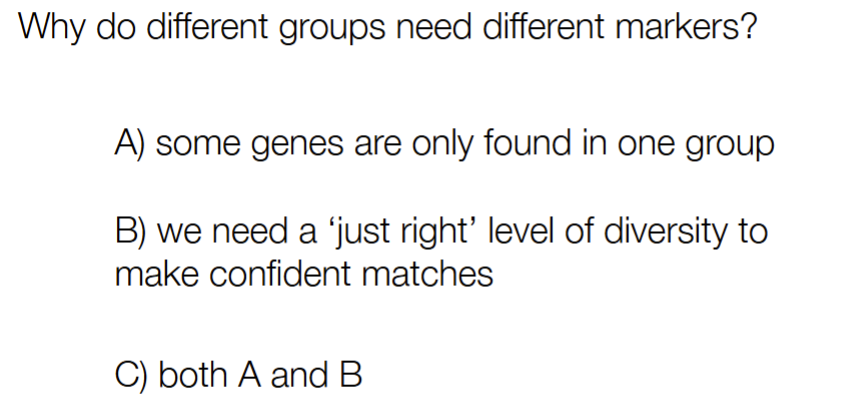
C
part of metagenomics/genome sequencing is to annotate gene functions:
2 ways
ORFinding (identifying ORFs)
homology in database → <50% of reads are annotated and the rest are ORFans
C
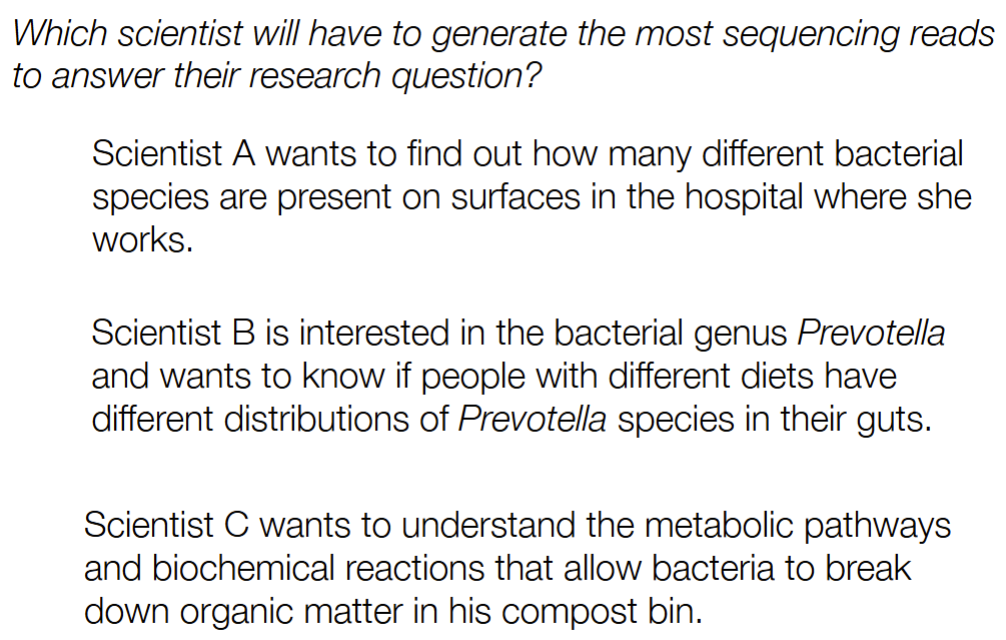
Can answer A and B with amplicon sequencing (AKA annotation of present genes in metagenomics), it answers “who’s there” and “how many of them are there”*
Is C b/c need to know what genes are present, which is known by doing whole genome sequencing & this sequencing require the most sequencing
def. species richness
explain the steps of the _ sequencing part of metagenomics that makes you consider there is a new species
sizes of type of samples (for soil and ocean water) that means there’s enough variation & species for diversity of each size sample
#of different species in a community
is the step of target sequencing in metagenomics where you have amplified specific marker regions on multiple reads using PCR → sequence → BUT have no match in the database SO is considered a new species
can be considered for 1 mL ocean water or 1 g soil
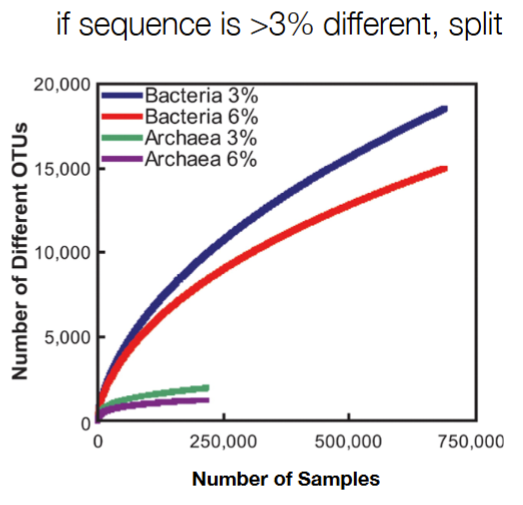
diversity: 20,000 species in 1 mL ocean water & 4,000-5,000 species in 1 g soil
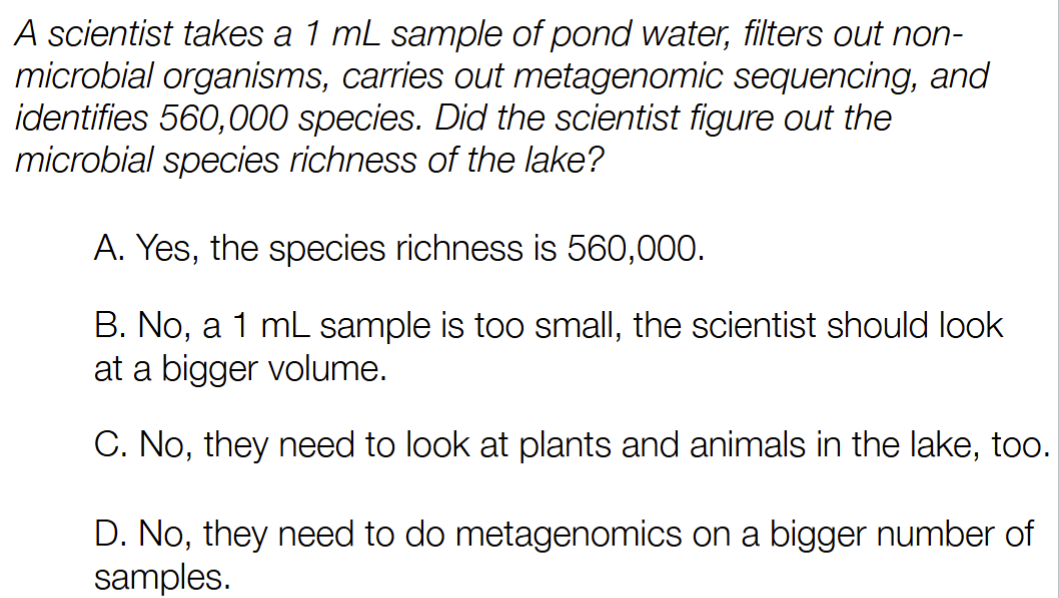
D
Not B b/c not representative of the entire pond, but still have uncertainties AND 1 mL of ocean water is enough for abundance/diversity
is D b/c simple sample doesn’t capture variation across the whole lake, so need to get more samples that are diverse samples
rarefaction curve used to…
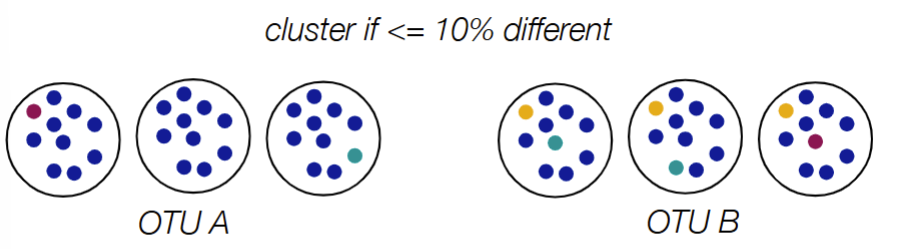
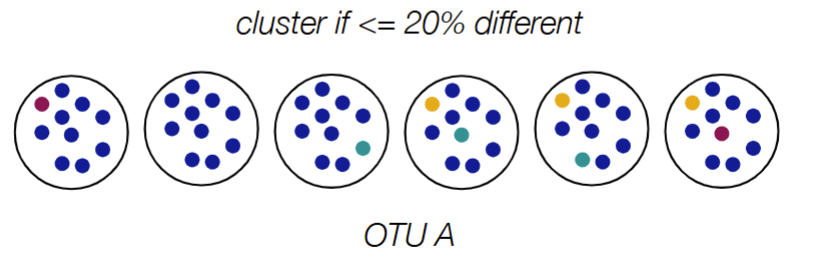
OTU (operational taxonomic unit) function
show the diminishing gains in species richness with each additional sample
OTU (operational taxonomic unit) is used when have unknown species, where you split sequences into groups based on how different they are)
used as ‘proxy’/representative for microbial species
def. biological species concept
organisms are members of a species if they can mate and produce offspring
general rule for OTUs to determine if same species or same genus (2)
same species if <3% different in 16S sequence
same genus if <6% different in 16S sequence
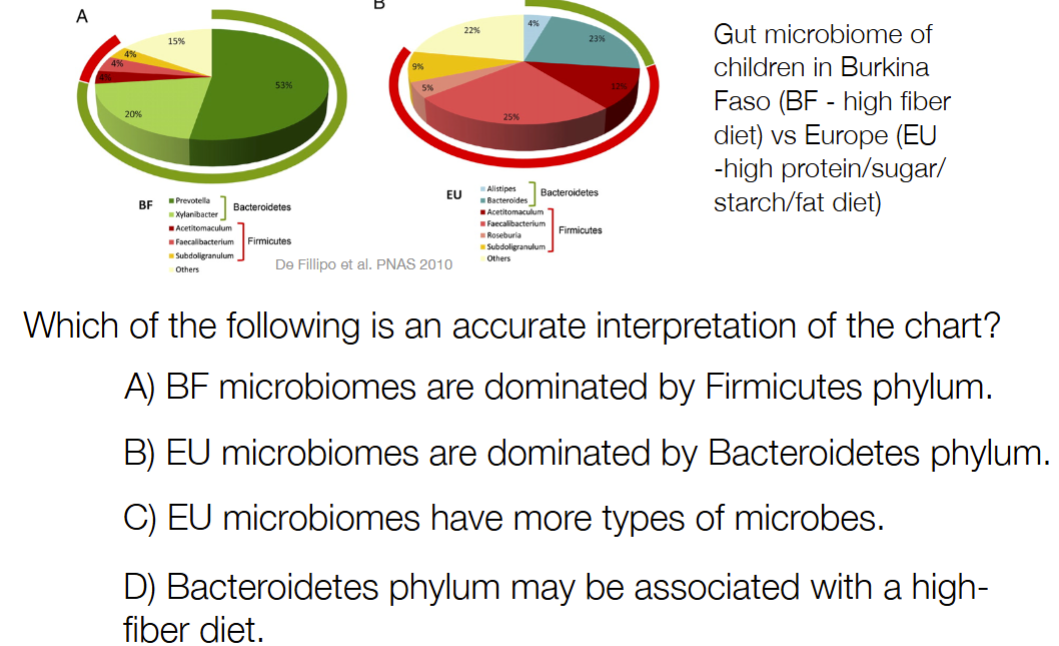
def. the “X” microbiome
the microbial community associated with environment “X"
where X = soil, lake, human, cow, plant, insect, etc.
(external signal from the environment aka “X” → turns on genes that are relevant)
D
human cells in one human is __
bacterial cells in one human is __
% of genome shared between humans
% of microbiome shared b/w humans
human cells / human (per) is 30 trillion
bacterial cells / human (per) is 39 trillion
99.5-99% of genome shared b/w humans
60-80% of microbiome shared b/w humans
(given MWAS - microbiome wide association study)
D
Not C b/c don’t know exact # of different types of microbes b/c of “other” wedge
def. expression
process of getting from the DNA gene → to functional proteins
for RNA:
the expressed part of the genome is in constant flux (aka continuous change or movement)
if transcription and degradation are perfectly balanced, then will have - -
will have steady state
def. promotor
for transcriptional regulation (for RNA dynamics):
def. promotor strength
def. regulatory elements
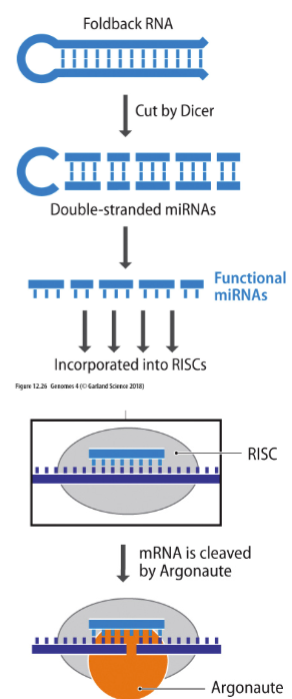
def. RNA silencing
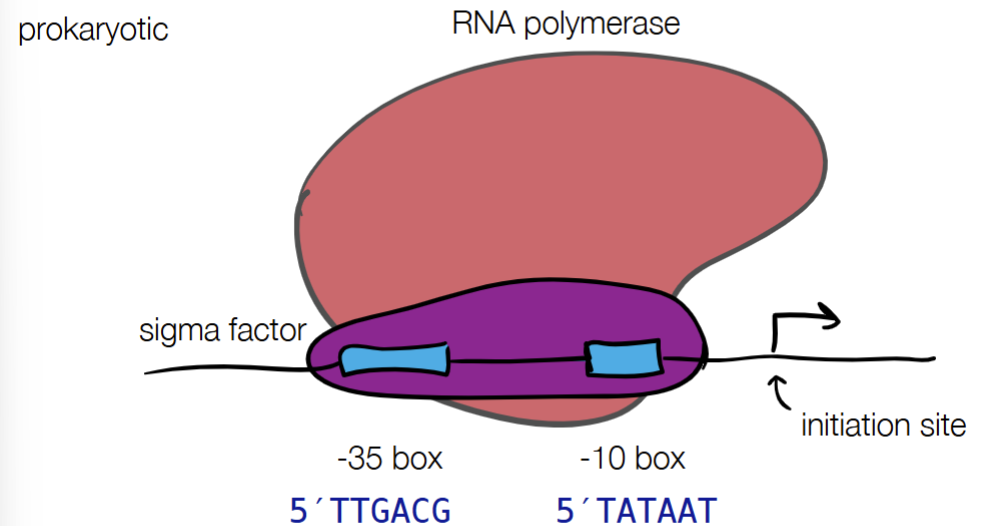
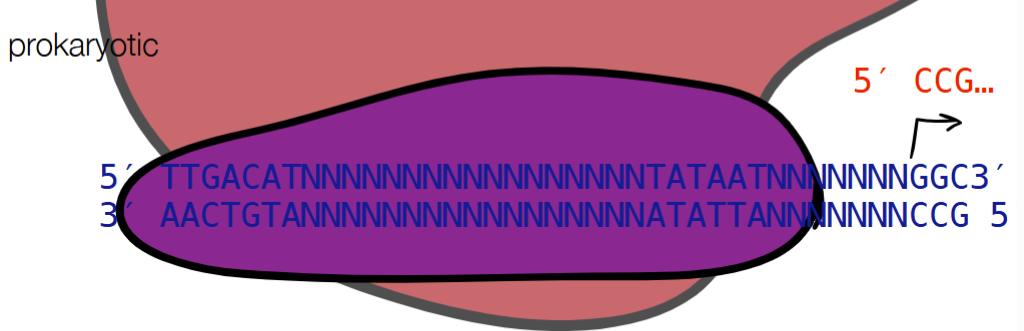
promotor - tells enzymes where to start transcription
promoter strength - where different promoter sequences can have different binding efficiencies
regulatory elements - upstream or downstream binding sites that can recruit proteins that increase or decrease transcription rate
RNA silencing - form of post-transcription regulation AKA is the targeted degradation of mRNAs by microRNA (miRNA)
for PROMOTOR STRENGTH for prokaryotic and eukaryotic cells: fill in blanks
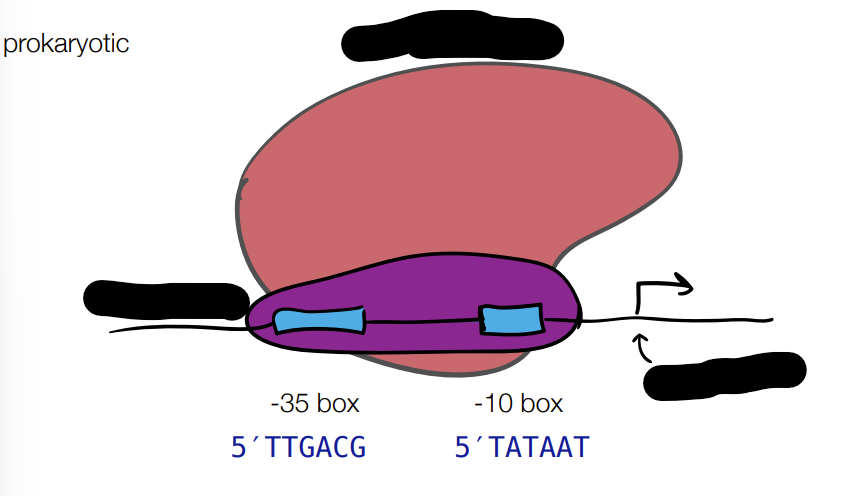
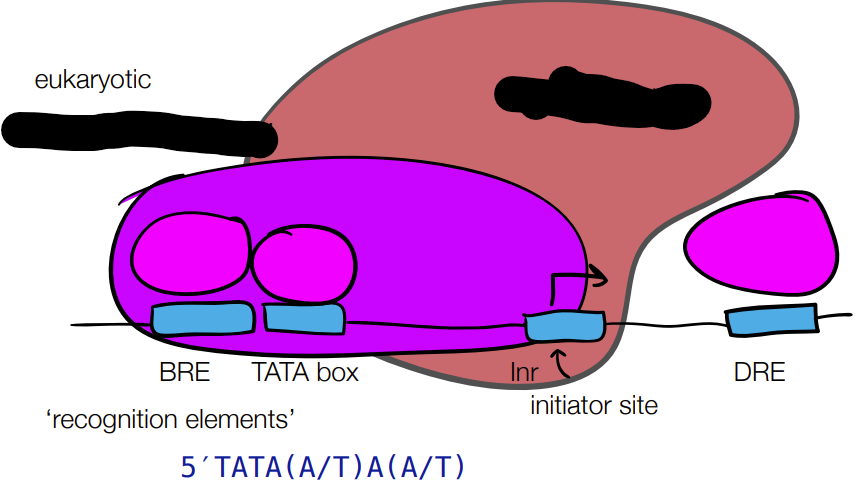
____
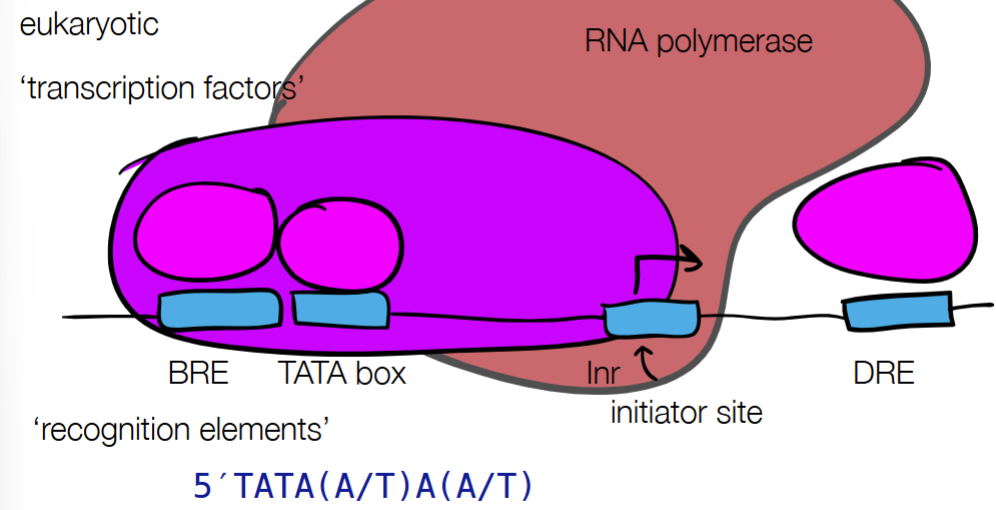
where different promotor sequences can have different binding efficiencies
for REGULATORY ELEMENTS for prokaryotic and eukaryotic cells: fill in the blanks
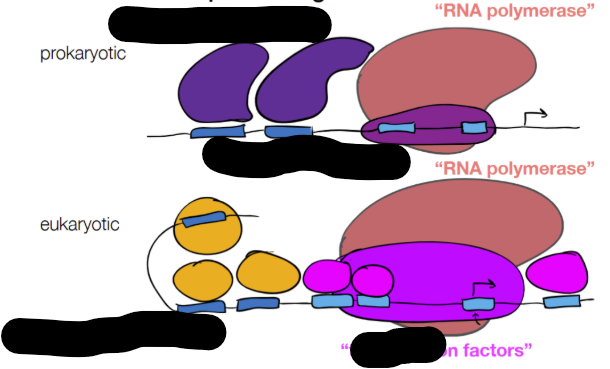
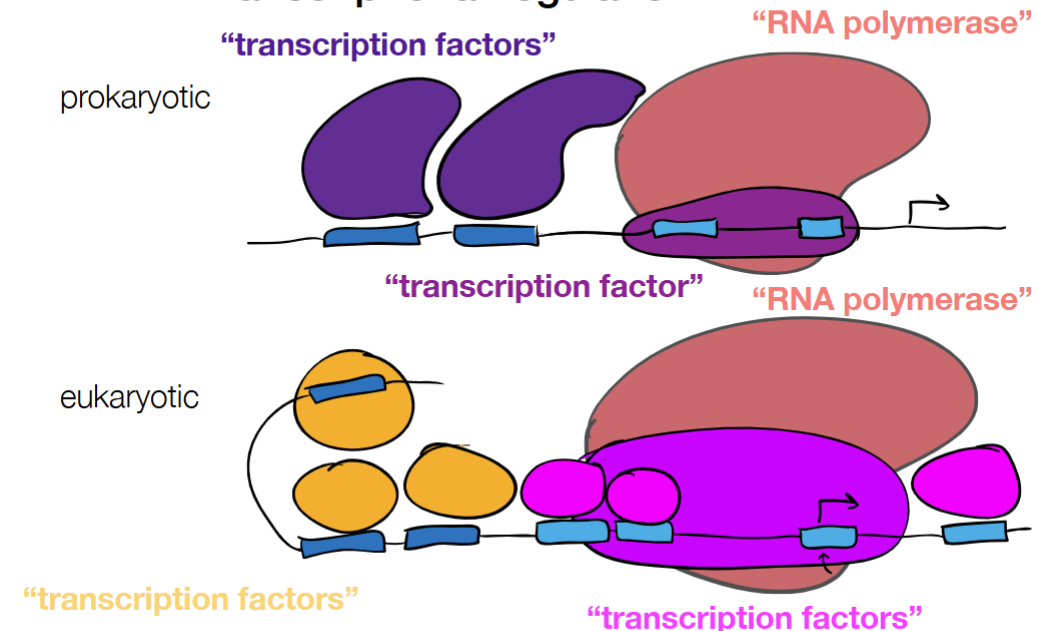
where upstream or downstream binding sites can recruit proteins to improve or lessen rate of transcription
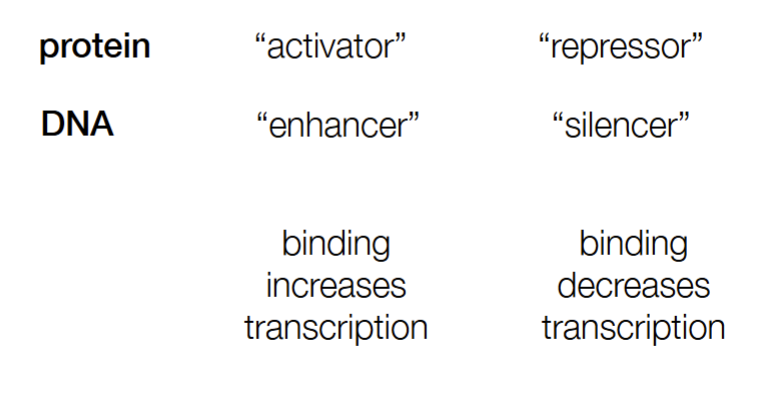
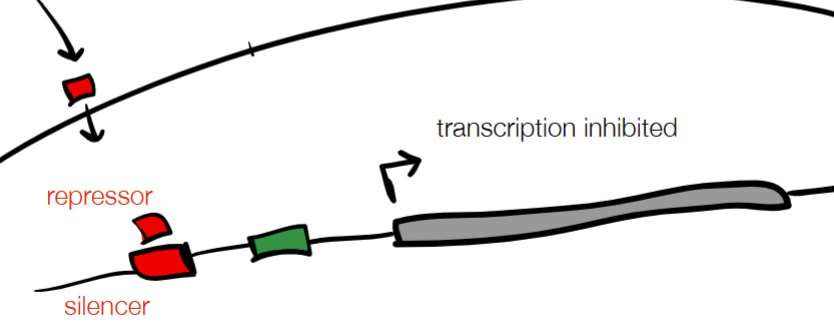
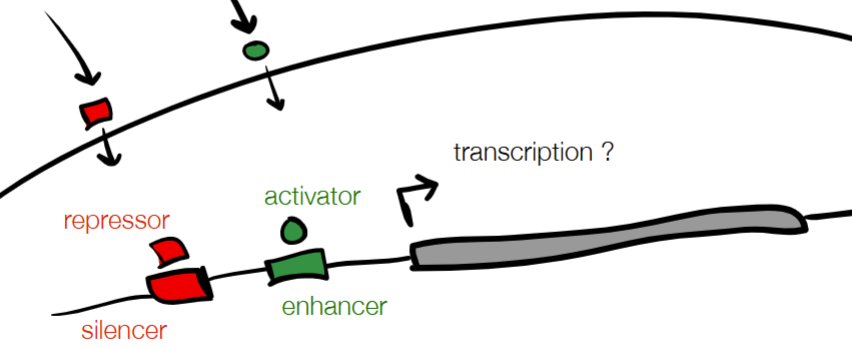
cont. for REGULATORY ELEMENTS: protein and DNA (2 labels + functions for each)
protein:
activator (binding increases transcription)
repressor (binding decreases transcription)
DNA
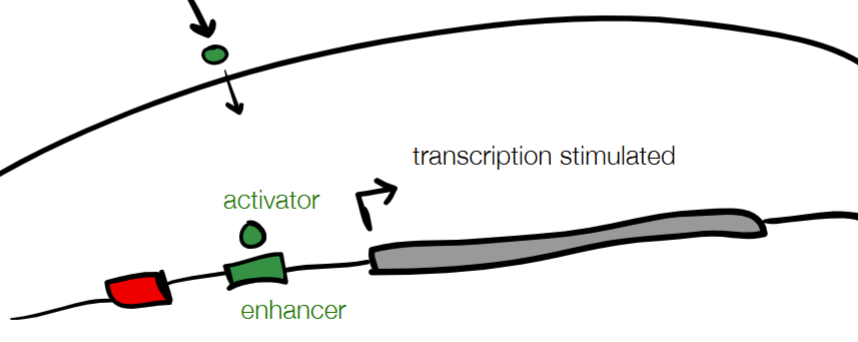
enhancer (binding increases transcription)
silencer (binding decreases transcription)
(WHERE
used in gene-mediated response (cell phenotype changes after environmental trigger turns gene on or off)
on w/ protein activator and DNA enhancer
off w/ protein repressor and DNA silencer)
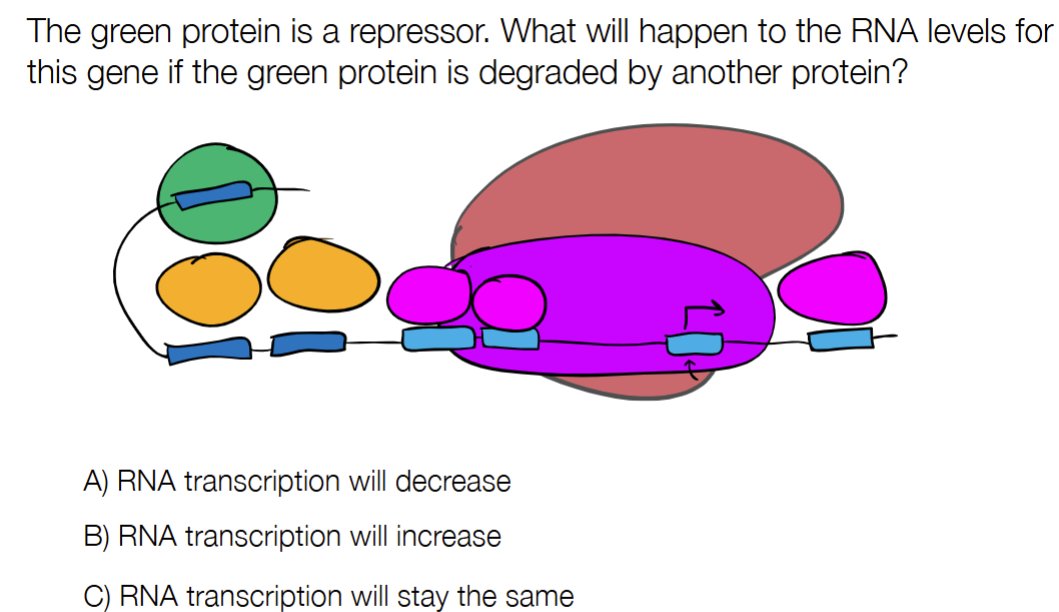
B
for RNA SILENCING:
how does it work
is the targeted degradation of mRNA using miRNA (micro RNAs), where miRNA “silence” genes by cutting up mRNAs
def. transcriptomics
def. combinatorial control (part of transcriptomics)
study of RNA expression levels across the genome, to compare within the genome (between genes) & between samples (with different phenotypes)
combinatorial control: integration of many inputs into an output (is beneficial in whole-genome sequencing)
these are plastic responses to the environment (aka plasticity):
def. plasticity
def. direct response
def. gene-mediated response
(state the central dogma stages involved in each & if it occurs on gene expression level or occurs on existing mRNAs and proteins)
plasticity - when an organism’s phenotype changes due to environmental triggers without changing its genotype
__
direct response - cell phenotype changes due to environmental trigger
involves translation (mRNA into protein) and protein activation/degradation (protein on/off, how long protein survives when cut up/broken down/degraded)
occurs on existing mRNA or proteins, not at the gene level
gene-mediate response - cell phenotype changes after environmental trigger turns a gene on or off
involves transcription or RNA degradation (involves transcription factors or RNA-binding proteins)
is slower response that occurs on the gene level/gene expression level
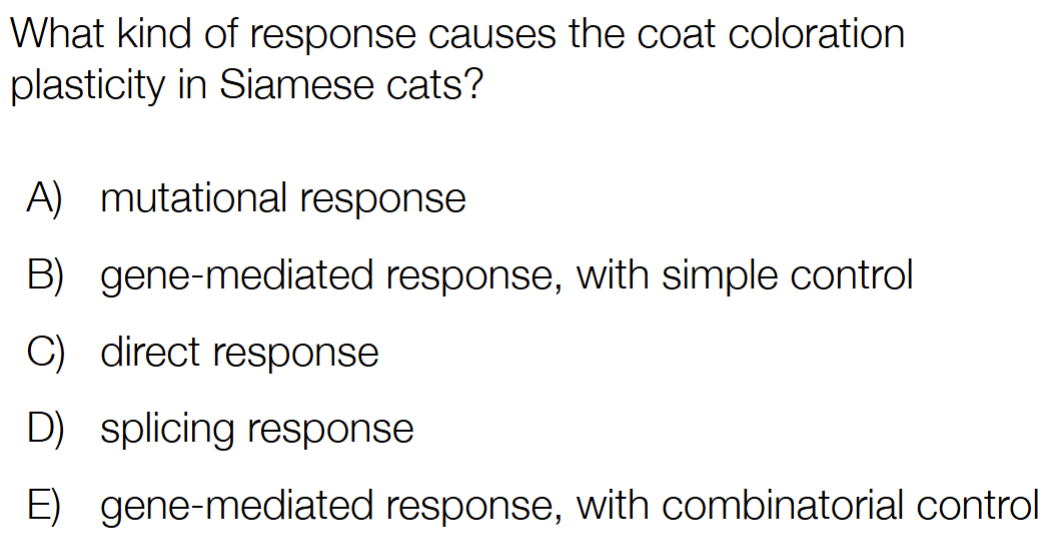
(Siamese cats have seasonal coat color)
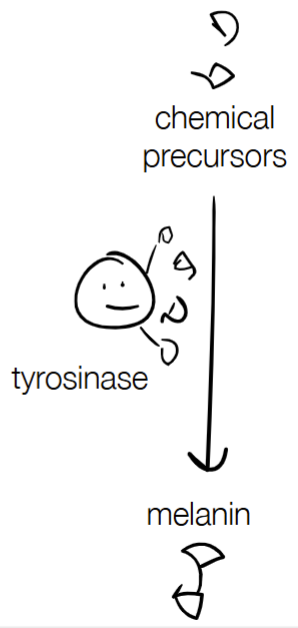
& give an explanation/step-by-step w/ melanin
c) direct response
tyrosinase is heat-sensitive
Unstable protein from the particular tyrosinase in Siamese cats (aka tyrosinase is temperature-sensitive has a particular allele that destabilizes the protein) -> protein unfolds is the direct response
where melanin is involved in protein activation/degradation
Gene-mediated response is either something that changes expression at the transcription level (how much mRNA made) or at the RNA degradation level (how long mRNA survives, when being cut up/broken down/degraded)
Otherwise, it’s a direct response (translation, protein activation/degradation)

b) no
Tyrosinase breaks down when it’s warm, but works fine in arctic animals in the summer, so no in terms of seasonal coat color change
Arctic animals don’t have temperature-sensitive tyrosinase
you measure RNA expression levels w/ RNA-seq (def., explain steps & 2 ways to interpret which genes have a higher expression level)
is measuring RNA expression levels by extracting RNA and shotgun sequencing it (in order to get the nucleotide sequence and gene expression through transcriptomics)
synthesize DNA (to get multiple copies of genes)
fragment DNA
attach Illumina adaptors and sequence it
align (match) to the reference genome
(aka synthesize DNA & do whole-genome shotgun sequencing)
__
different ways to interpret RNA expression levels
# reads / # bp
RPK (reads per kilobase) = (#reads of a gene / # total bp for a gene length) * 1000 = (#reads of a gene / # total Kbp of a gene length)
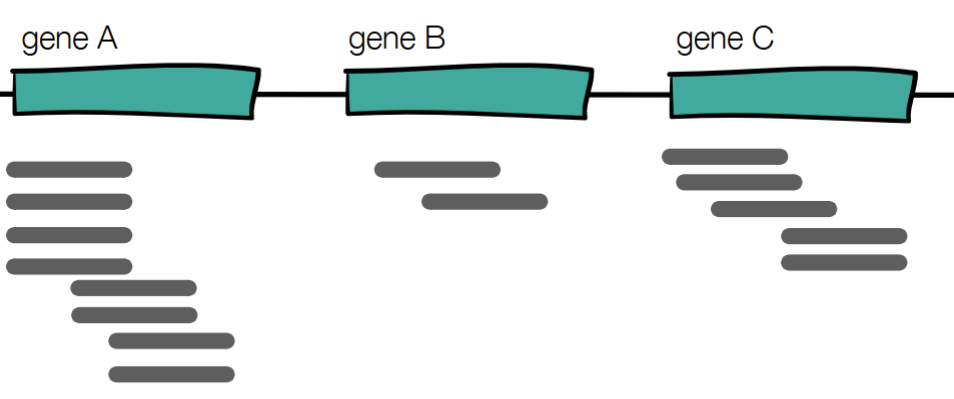
Which gene has the highest expression?
Gene A
all 3 genes seem to have the same gene length (in bp), but gene A has more sequencing reads
using: (#reads/gene length in bp) *1000
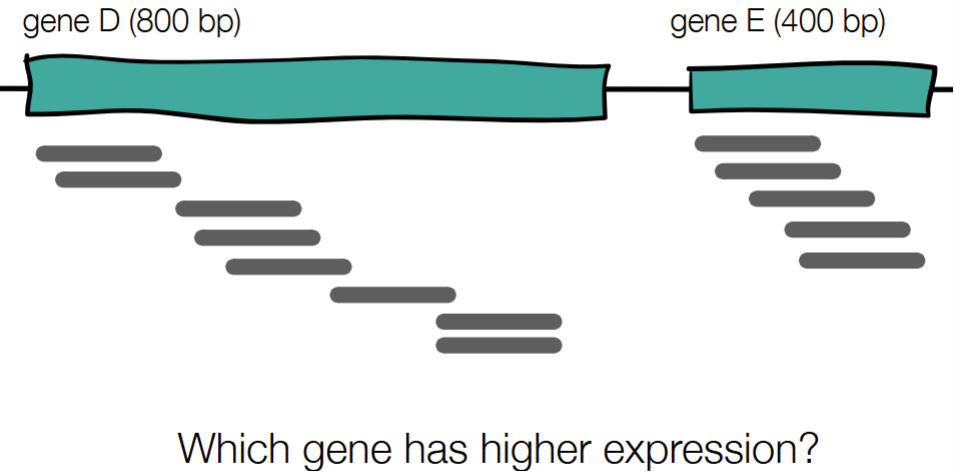
Gene E
E: 8 reads/800 bp = 1 read/100 bp
D: 5 reads/400 bp = 1.25 reads/100 bp
(can also solve for it out of 1 bp or 1 Kbp)
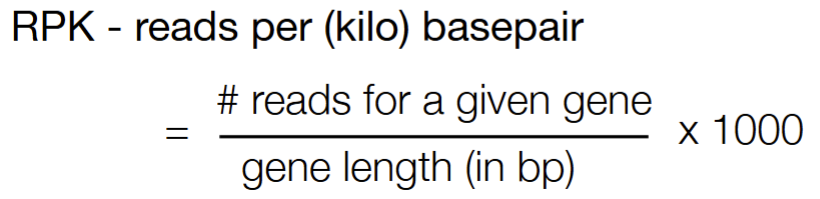
RPK is reads per (kilo) basepair
RPK = (# reads / # bp) * 1000
RPK = (# reads / # Kbp)
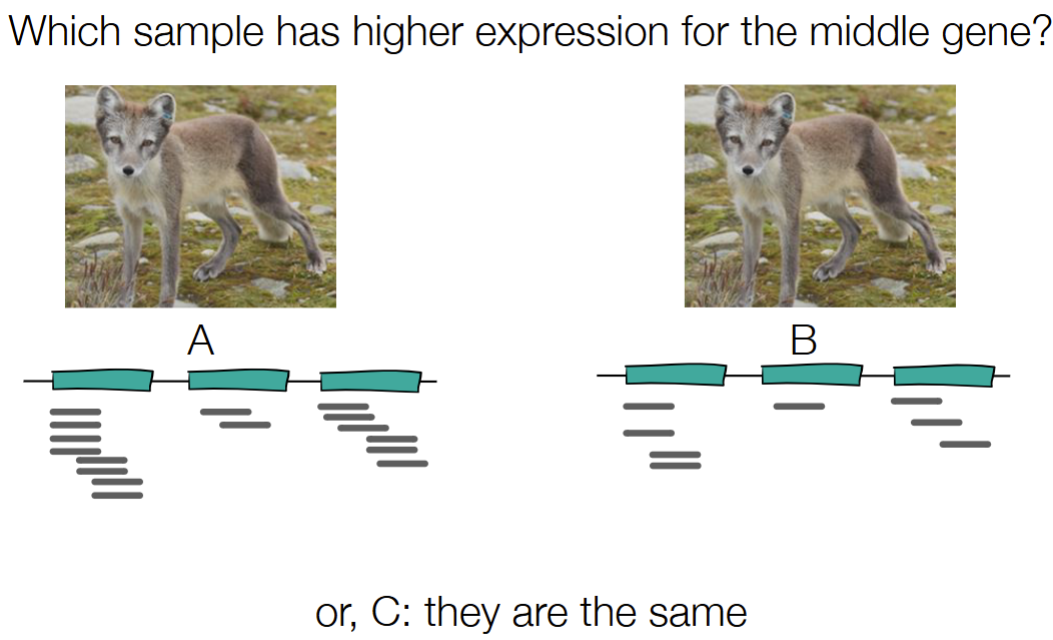
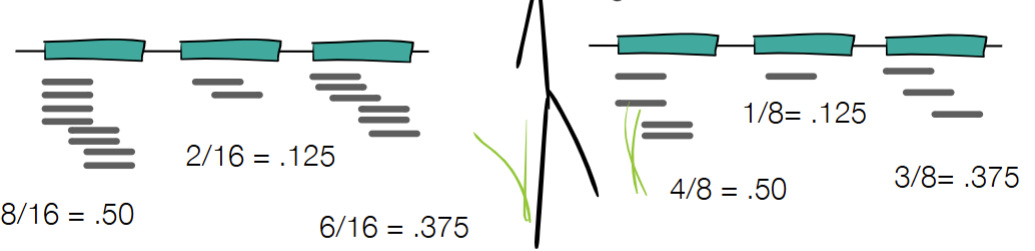
C) they are the same
Must consider total amount of RNA from 2 samples (aka the total amount of reads for each sample)
using RPKM - reads per (kilo) bp per million reads sequenced
when do you use RPK vs RPKM
give formulas
RPK when normalizing for gene length
RPK = (# reads / # bp) * 1000
RPK = (# reads / # Kbp)
RPKM when normalizing for gene size & sample size
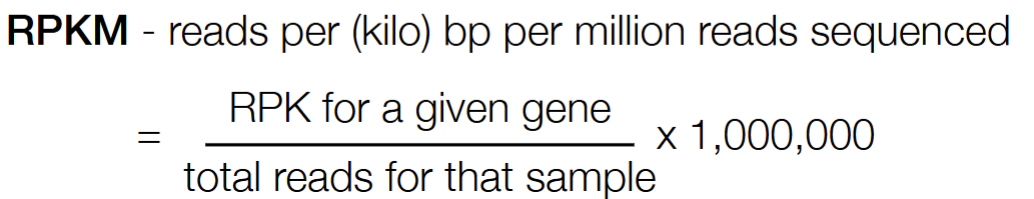
(related to transcriptomics that compares between genes in genome & between samples with different phenotypes)
in RNA-seq: 2 ways to compare RNA expression levels of samples
reads relative to housekeeping gene
reads relative to average of specific gene (aka mean-centered expression levels)
def. housekeeping gene
gene for routine cell maintenance that is always at a constant level
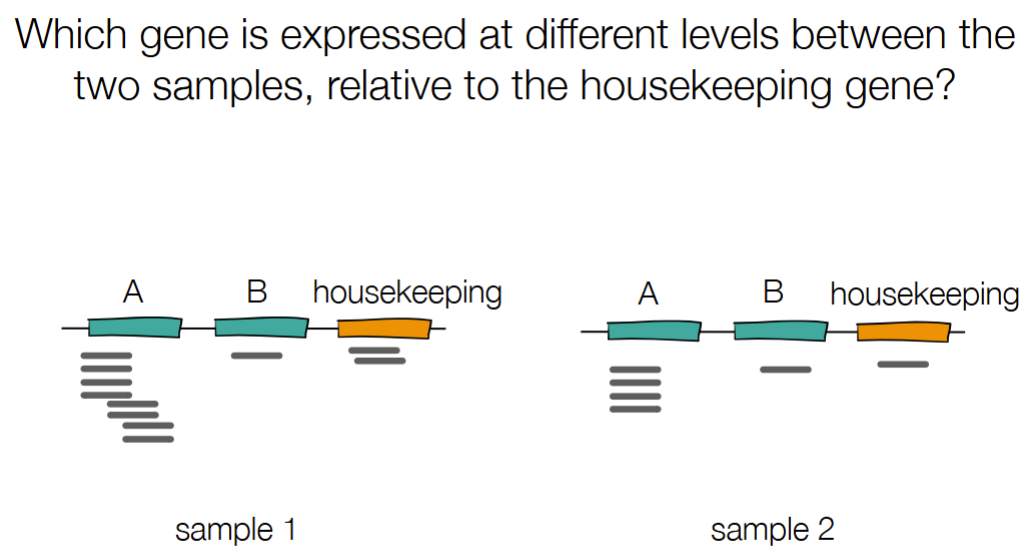
B
Sample 1: A has 8 reads relative to 2 in housekeeping; sample 2: A has 4 reads relative to 1 read in housekeeping
but B stays at the same level despite change in # of reads for housekeeping gene
in comparing phenotypes in RNA-seq in transcriptomics:
how to calculate mean-centered expression levels
for the mean: take the average of # reads for a specific gene between 2 samples
then, do (# reads/mean) for each gene
compare which is higher or lower for RNA expression levels
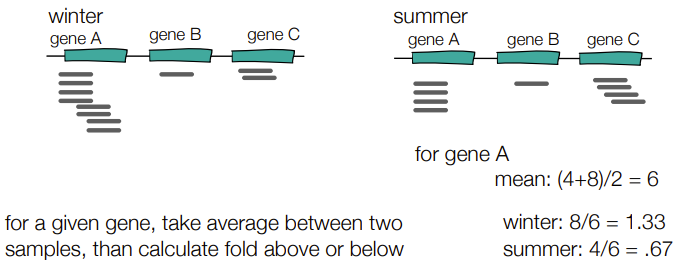
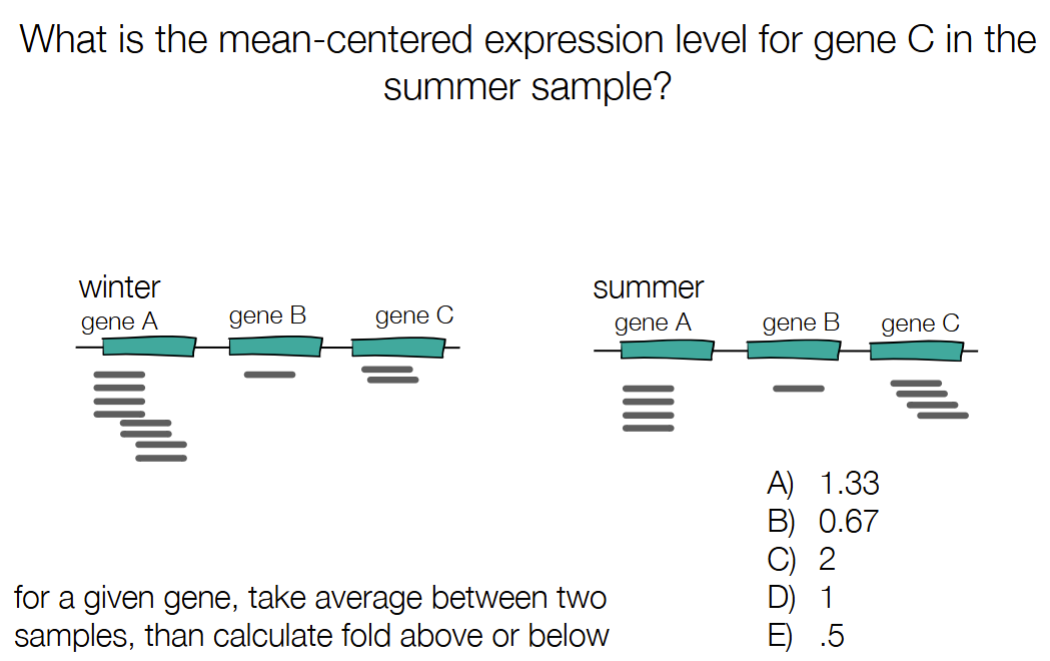
a) 1.33
Mean of gene C: (4+2)/2 = 3
For summer sample: 4/3 = 1.33
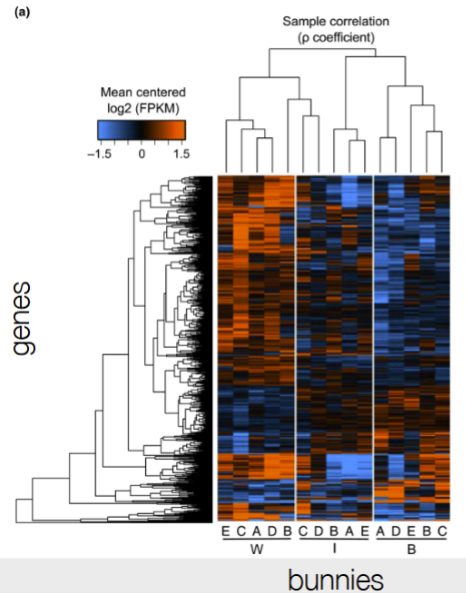
for heat maps:
what does each row represent?
what does the color represent?
each row is a single gene
color is for FPKM (is fragments PKM which is similar to RPKM, but for paired-end reads ← when normalizing for gene length and sample size, where red is higher RNA expression levels and blue is the lowest
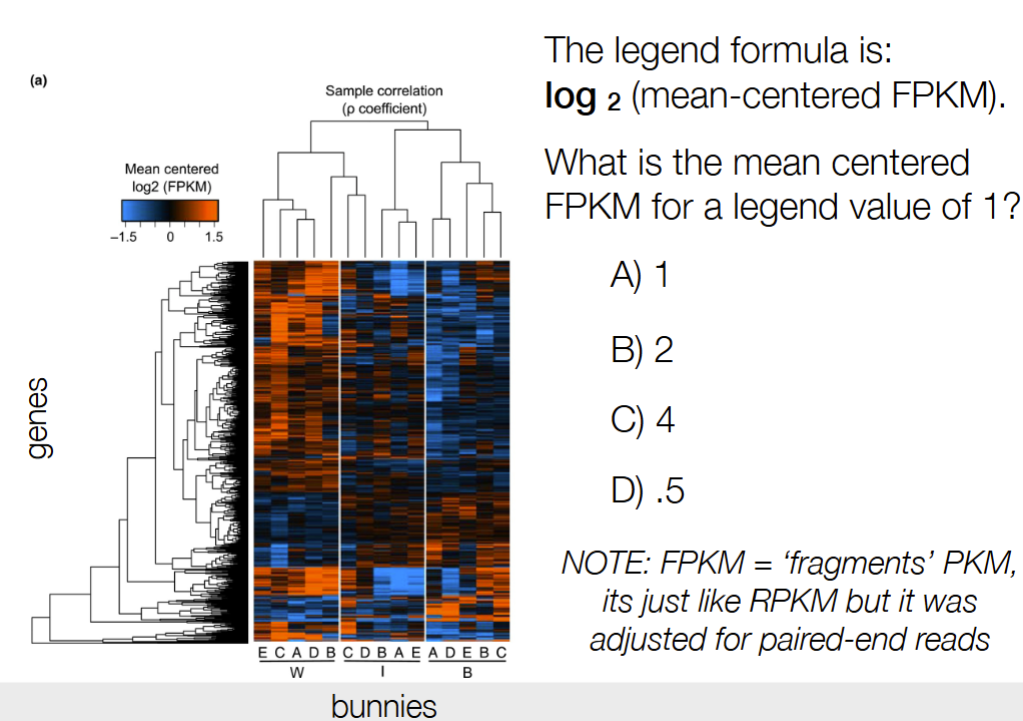
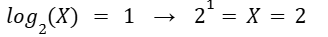
b) 2
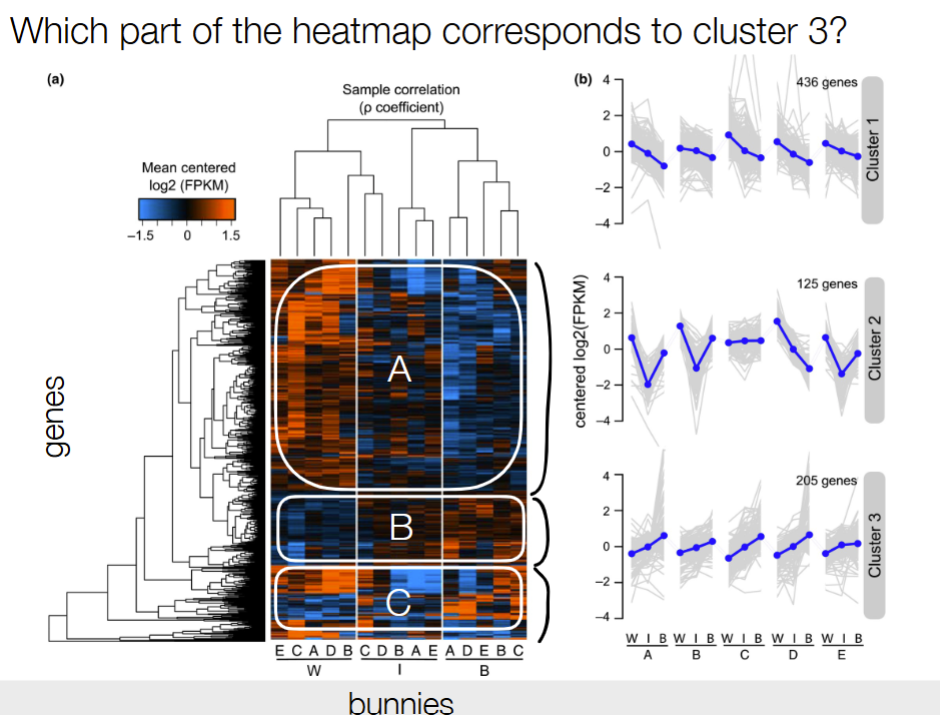
B
cluster 3 is usually going up, so the part of the heatmap must go from blue to red overall
Look at the trend of connected dots for each bunny A-E across W, I, and B for cluster 3
Cluster 3: expression is generally lower lower than the mean in the winter and goes up in the summer, so it should start in blue and would go towards the red from W to B
Not choice A b/c the WIB for A doesn’t match (would be a downtrend)
Not choice C b/c not obvious trend of blue to red
def. GO (gene ontology)
def. circadian rhythm
what does ASIP (agouti signaling peptide) do?
GO is assigning functions to genes & grouping them based on gene functions
circadian rhythm - normal cycle of gene expression from day to night, triggered by changes in light
__
ASIP blocks binding of MSH (melanocyte stimulating hormones) to MC1R (receptor) → so melanin synthesis enzymes are off & no transcription
if no ASIP then these enzymes are on & activates production of melanin
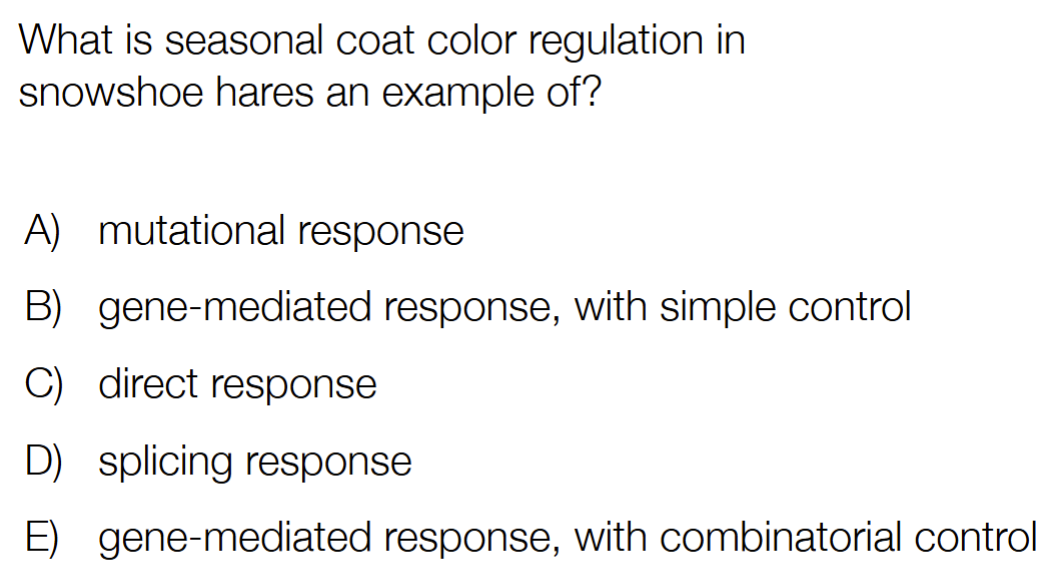
E
Not C b/c C is phenotypic change result of physiology/environment (is direct response)
E b/c as shown with the snowshoe hare heatmaps, lots of genetic changes (multiple inputs into an output) contribute to the phenotype
combinatorial is multiple inputs into a single output
gene-mediated is multiple genetic changes (of genes), not direct response (like heat for Siamese cats that degrades proteins for melanin)
give explanation (aka give the def. of gene expression profiling)
C
Gene expression profiling is used to measure activity of many genes at once to understand cellular function, which can be used to compare genetically identical samples AND samples with different or mutated genomes, so it’s not limited to only one or the other
def. coregulation
when genes up or down together (for clusters) ← when looking at the colors for a heatmap
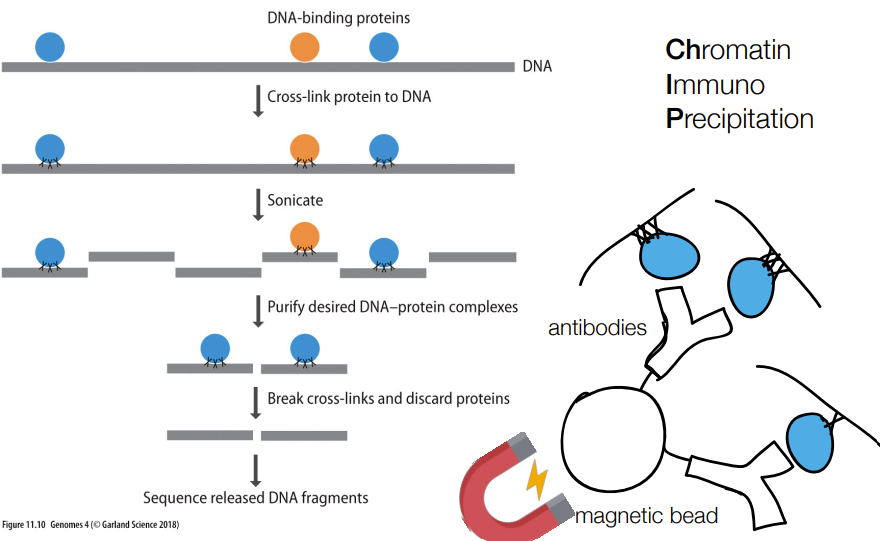
def. ChIP-seq
& abbreviation stands for…
“chromatin immuno precipitation sequencing”
tells where a protein binds to in a genome (aka the binding site AKA the gene/DNA targets of regulatory proteins)
if the protein is a transcription factor, then ChIP-seq helps identify which genes that protein transcription factor regulates
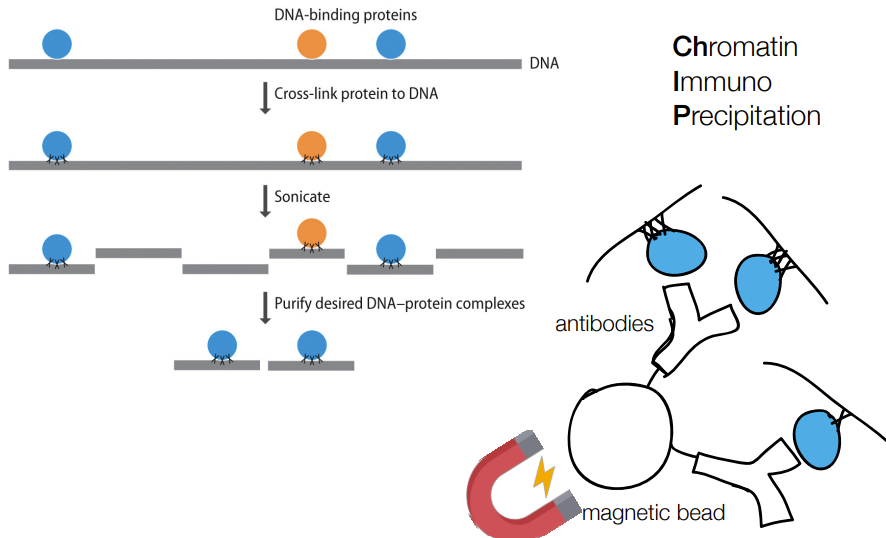
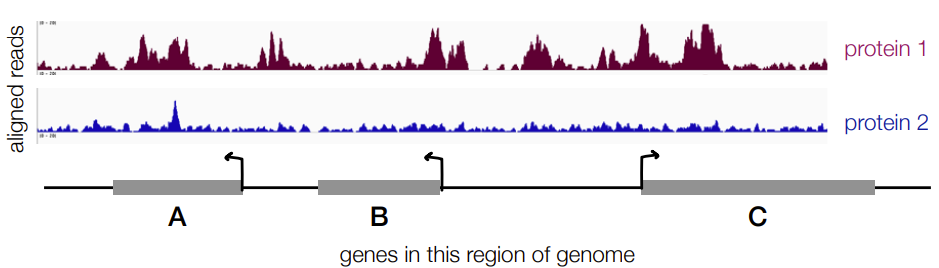
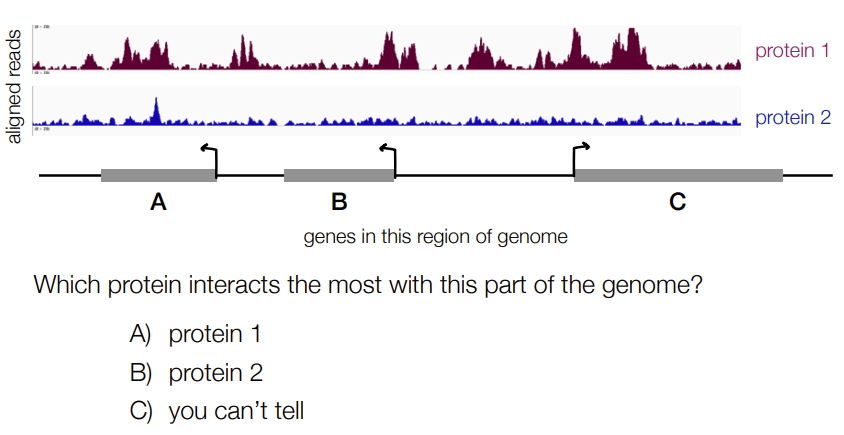
A
Has more reads in general across region/gene A when comparing to # of aligned reads for genes A, B, and C
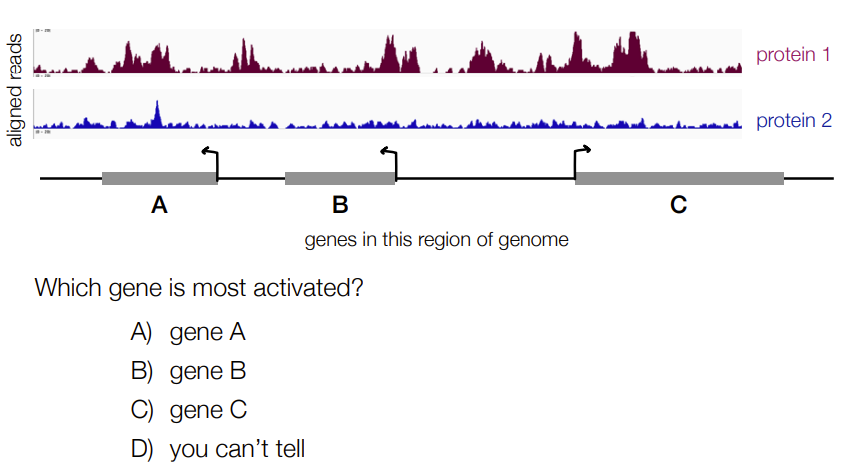
D) you can’t tell
Binding alone doesn’t tell us what the effect or either promoting or inhibiting transcription
Have to combine ChIP-seq and RNA-seq data to know
AKA
this diagram is for ChIP-seq, which tells you the location of a genome that a protein binds to BUT doesn’t tell you the most activated gene aka the gene with the highest RNA expression level. that is determined by RNA-seq → SO have to use RNA-seq and ChIP-seq to find which gene on a genome has the highest RNA expression level that protein binds to
which processes define the epigenome (changes in gene expression, not sequences) that want to make regulation/gene expression last longer
are the responses of these processes are direct or gene-mediated responses?
def. epigenetic regulation
histone modification
methylation
both are gene-mediated response
__
histone modification and methylation define the epigenome
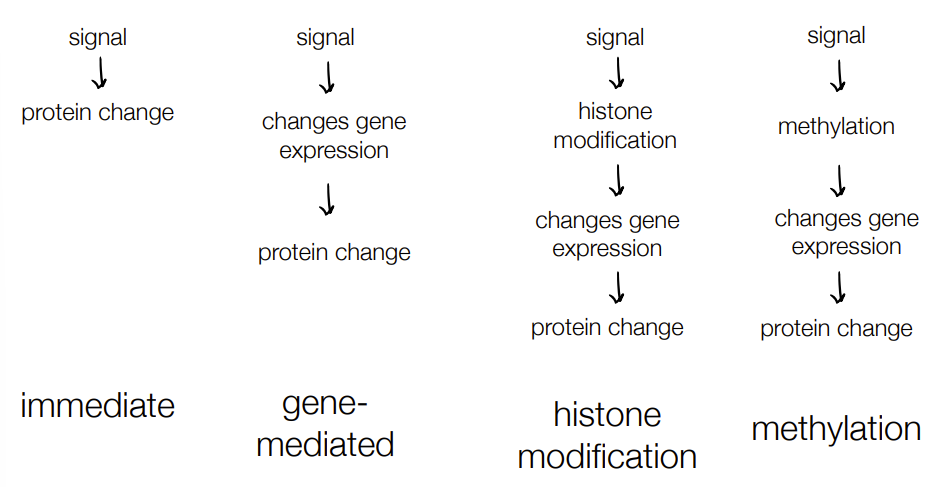
__
epigenetic regulation - modifying chromatin (aka histone proteins) or DNA (w/ methylation) to make longer-term changes in DNA/gene expression
def. heterochromatin vs euchromatin
def. histones
eu/heterochromatin is controlled by…
heterochromatin: is inactive where transcription can’t access DNA b/c of tightly packed chromatin
euchromatin: is active, able to do transcription b/c has low density of chromosomes so has less tightly packed chromatin
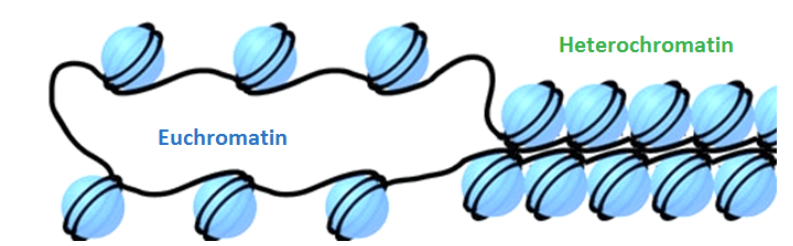
histones: the proteins that make up nucleosomes
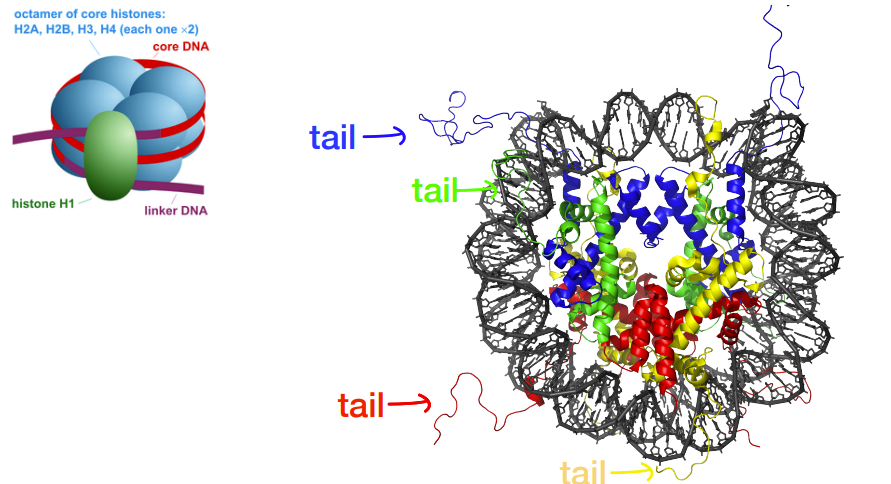
euchromatin/heterochromatin is controlled by how tightly DNA is stuck to histones, which is determined by chemical modification of histone tails that control how tightly histone tails bind to DNA
def. acetylation vs deacetylation (in relation to ability to undergo transcription and gene expression)
how does it relate to HATS vs HDAC
acetylation - add acetyl group to lysine molecule in histone tails (removes “+” charge from lysine, so DNA is more free for RNA polymerases to undergo transcription AKA histone tails are less tightly bound to histone → euchromatin)
deacetylation - remove acetyl group from lysine of histone tail (add “+” charge, which makes it harder to undergo transcription b/c histone tails are more tightly bound to histones → heterochromatin)
__
HATS (histone acetyl transferases) will add an acetyl group
HDAC (histone deacetylases) will removes an acetyl group
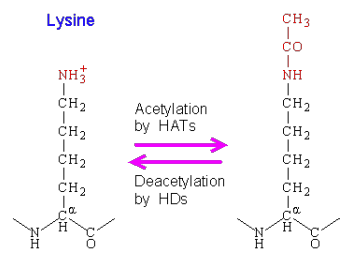
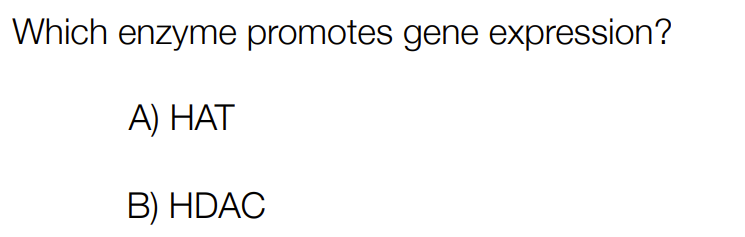
A) HAT
Removes positive charge from lysine, so DNA is more free for other RNA polymerases to undergo transcription
describe methylation (does it use HATs or HDACs)
has CpG islands (type of upstream regulatory sequences found with ~70% of promotors)
methylation of Cs in CpG islands will repress gene expression of adjacent genes
has a targeting mechanism the controls which genes get methylated, BUT isn’t well understood
methylation recruits HDACs (which promote heterochromatin formation b/c remove acetyl group from lysine of histone tail → get “+” charge → DNA less likely to undergo transcription and gene expression, meaning more tightly packed chromatin aka heterochromatin)
methylation is generally stable throughout lifetime
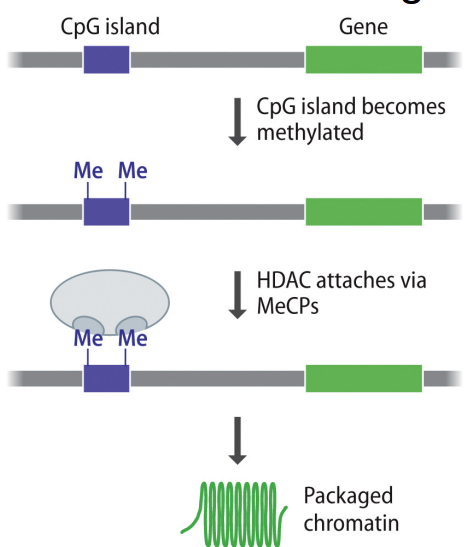
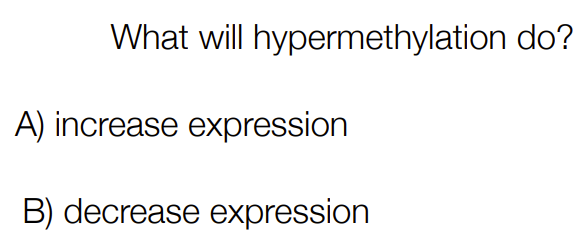
B) decrease expression
More methyl groups (aka more methylation), recruits HDACs, we are left with positively charged lysine, charged lysine hugs onto DNA tighter (tightly packed chromatin), decreased expression
for bisulfite-seq aka methyl-seq:
function
3 steps to do this
how to tell which is unmethylated vs methylated C’s AND added right vs wrong base
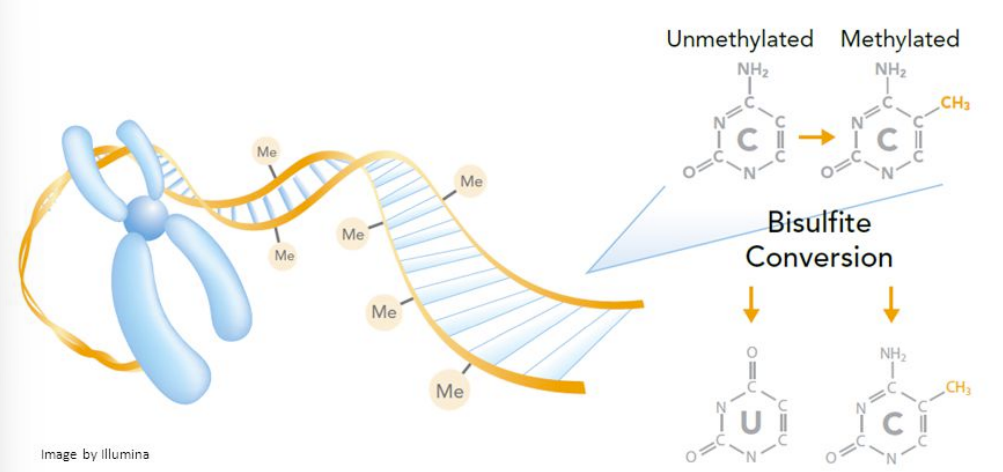
used to locate methylated cytosines in the genome
bisulfite conversion on DNA from specific cell type/cell type of interest
Illumina-seq (remember: U’s are read as T’s)
compare to reference by looking for C’s that stayed as C’s
__
unmethylated C’s → U’s aka T’s (undergo bisulfite conversion into uracil & added base will be wrong)
methylated C’s stay as C’s (doesn’t undergo bisulfite conversion b/c stays as C & add complementary base G, which is the correct added base)
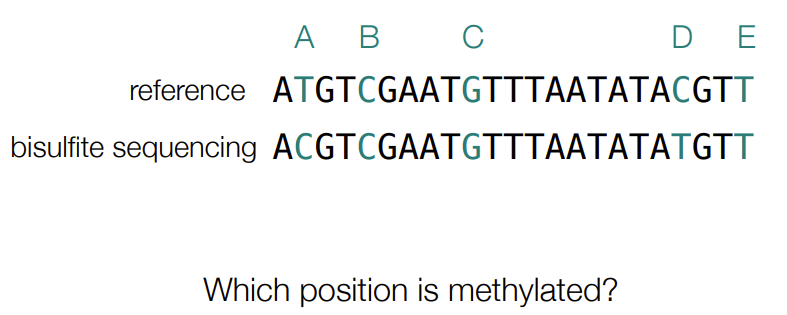
B
Is protected b/c stays as C (D shows an unmethylated cytosine)
A is most likely a SNP or sequencing error
RNA-seq vs. ChIP-seq vs. epigenetic regulation vs. bisulfite-seq
RNA-seq measures RNA expression levels across a genome
ChIP-seq finds (the gene) where specific protein binds on a genome AKA is location of DNA targets of a genome where specific regulatory proteins bind to
epigenetic regulation modifies the chromatin (w/ histone proteins) OR DNA (w/ methylation) to make longer-term changes in DNA expression
bisulfite-seq finds positions where C’s have been methylated
def. development
(is especially important for multicellular organisms)
def. division of labor & how is labor divided (2 ways)
changes in phenotype and the mechanisms that cause them during reproduction and growth of an organism
often involve changes in gene expression (from cell to cell)
division of labor allows organisms to be more complex b/c different cells can specialize in different functions (is b/w germline/germ embryonic cells and somatic cells)
labor divided into (2):
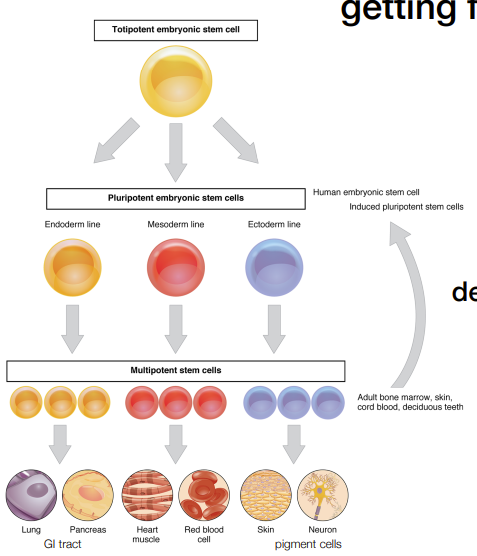
regional specification (unique areas within an embryo: germ/seed layers of embryo are endoderm, mesoderm, ectoderm)
differentiation (process of cells within certain regions becoming more specialized)

def. stem cells
order potency of stem cells in terms of differentiation levels (which is most potent, which is most differentiated)
are cells that multiple cell types could ‘stem’ from
have different levels of 'potency’
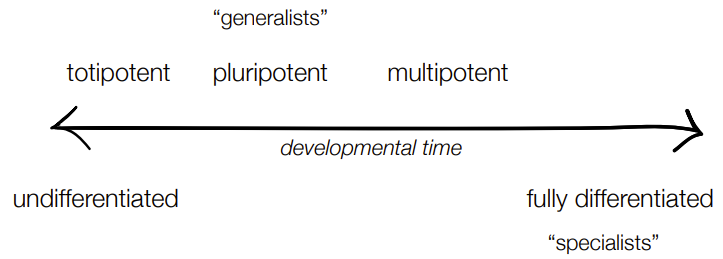
most potent is totipotent (most potent is can differentiate into any cell type)
most differentiated is multipotent
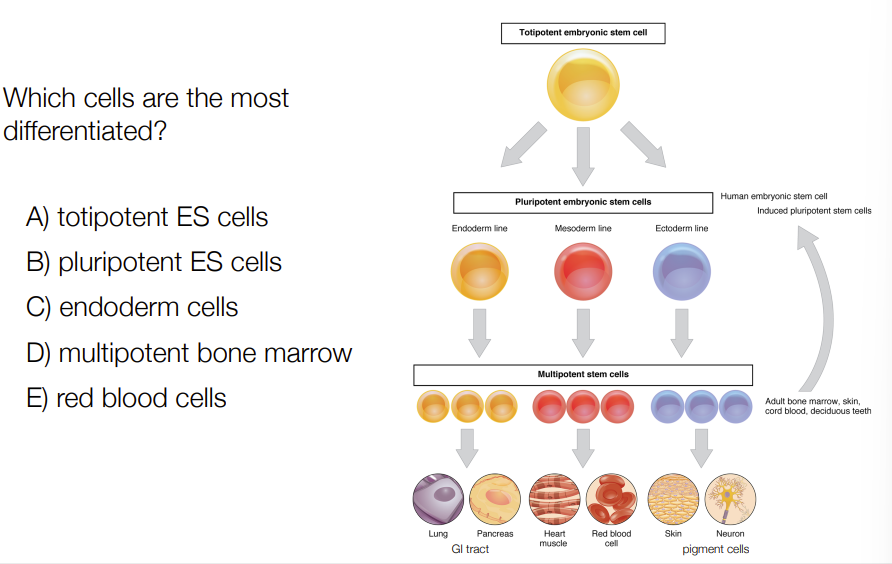
E
Most differentiated is most different
de-differentiation def.
reversing process (of becoming more specialized) to produce induced stem cells
__ __ is environmental determinants is responsible for initiating regional specification (for division of labor for development)
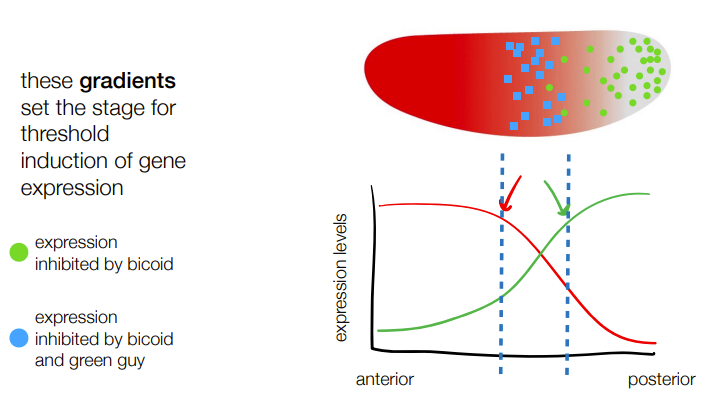
relate to gradients
spatial variation
concentration gradients set the threshold for induction/de-differentiation of gene expression
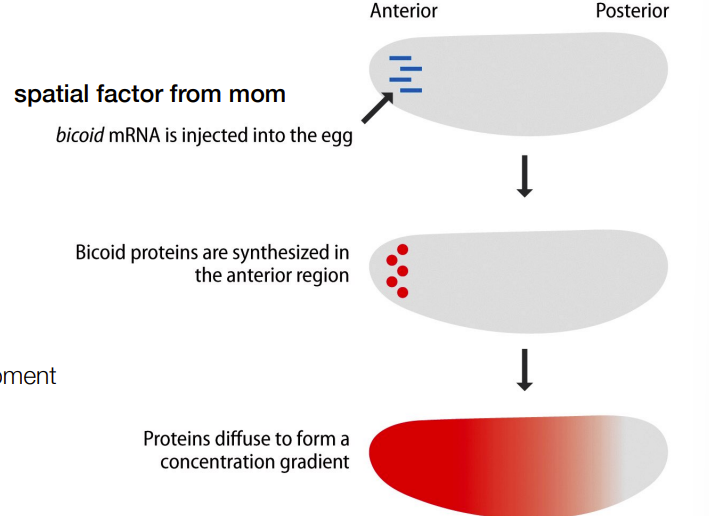
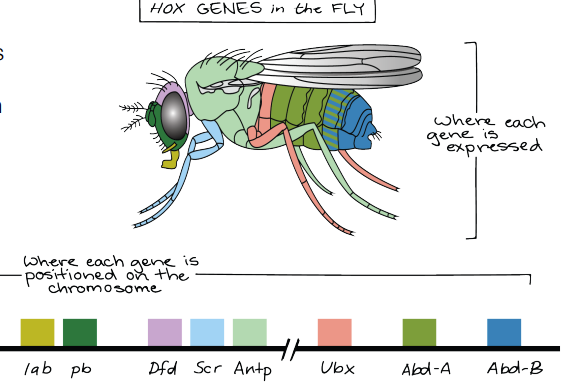
def. hox genes
the concentration gradients formed by spatial variation in regional specification (as part of division of labor for development) will produce ‘segment’ genes’ AKA transcription factors for organ specific genes aka hox genes
for regeneration
when FULLY differentiated HUMAN cells are damaged, they can’t be repaired
for organisms that can do regeneration: they do RNA-seq at different time points
give the times for T1, T2, T3, T4
genes with functions in wound healing would most likely undergo ___
RNA-seq at:
T1 = 0 hours
T2 = 3 hours
T3 = 20 hours
T4 = 96 hours
__
genes with functions in wound healing would most likely undergo de-differentiation/induction

C
T3 is most up-regulated b/c has highest overall FPKM in yellow
T3 = 20 hours
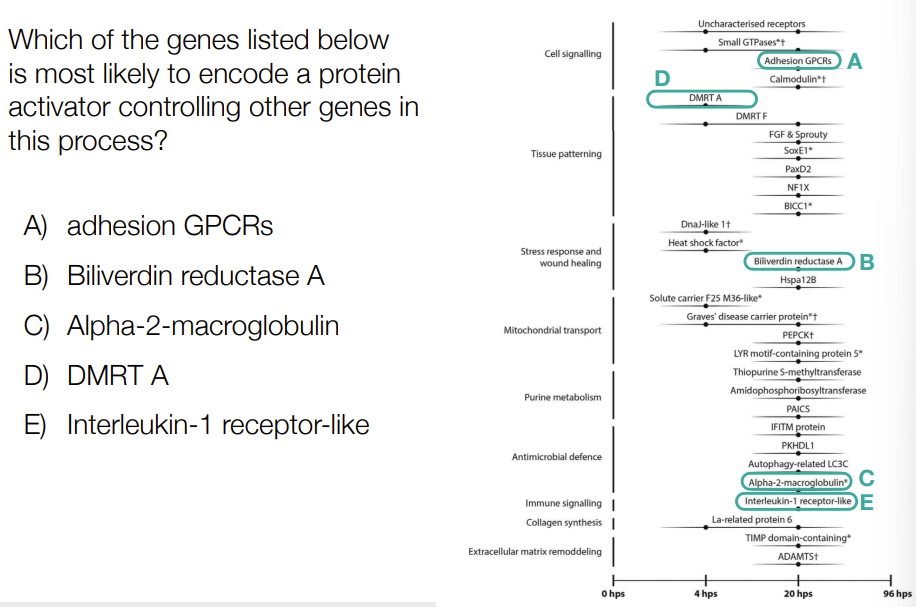
D
Is the only one expressed at that intermediate time point, logic-based reasoning, not confirmed
cont. regeneration:
2 ways to get regeneration in human cells
figure out how animals able to do regeneration do it
ID genes responsible for regeneration, see if humans have the homologs for it, find out what’s repressing these genes (i.e. p21 gene in animals similar to humans, like mice)
make de-differentiated versions of our own cells
for regeneration: to try to make de-differentiated versions of our own cells:
iPSCs stands for… (identify where given diagram) (give examples of iPSCs)
__
your own stems cells can’t fix your disease if it’s - (without genetic engineering), BUT a donor’s could, especially if they’re a -
induced pluripotent stem cells
are pluripotent stem cells
ex: bone marrow, umbilical cord/placental blood
__
your own stems cells can’t fix your disease if it’s genetic (without genetic engineering), BUT a donor’s could, especially if they’re a relative
cont. regeneration:
def. allogenic stem cell therapy vs autologous stem cell therapy
def. reprogramming
allogenic uses multipotent stem cells from a donor relative
autologous uses your own multipotent stem cells, sometimes w/ gene modification
__
reprogramming - ‘tricking’ cells into thinking they’re young again aka to resemble embryonic stem cells
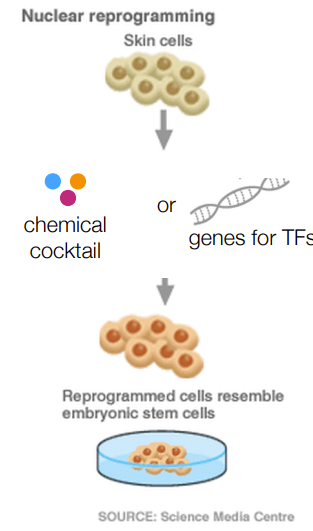
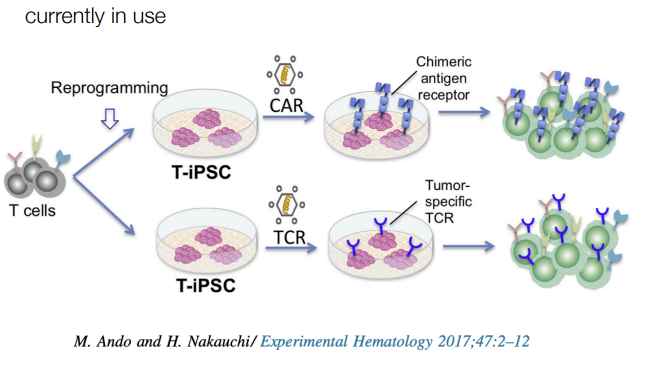
for omics of regeneration in cancer immunotherapy:
describe process
isolate t-cells
reprogram into iPSCs so they can proliferate/grow
engineer them to specifically target cancer cells
reintroduce cells to the patient
how do we know for sure that reprogramming worked in regeneration?
compare epigenome of normal vs artificial stem cells
w/ closeup (10,000 bp) of epigenome
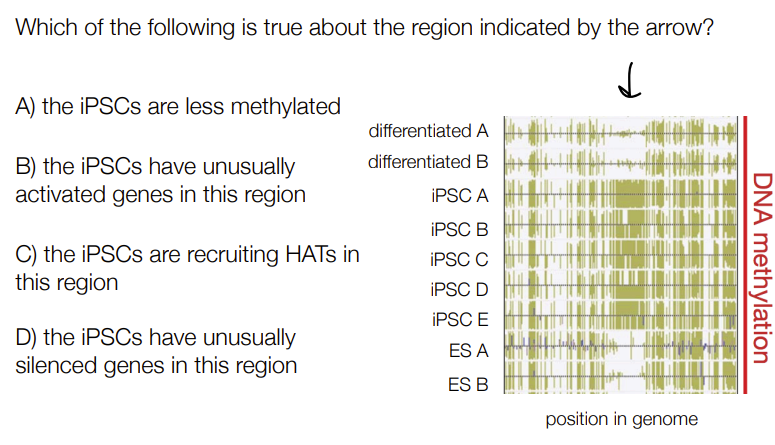
D
Not A b/c iPSCs are most methylated in this region, indicated by having the most yellow ticks
Not B b/c methylation groups recruit HDACs, which deacetylate the lysin and histone tails, so lysine is no longer neutral & instead has a positive charge, meaning that the histones are tightly holding onto the DNA so becomes a tightly packed chromatin
Not C b/c methylation marks are landing sites for HDAC enzymes (aka histone deacetylase enzymes)
D b/c deacetylation means that charged lysines are hugging the DNA. Because DNA is too tightly bound to the histones, DNA is not available to undergo the start of transcription and other gene expression processes
iPSCs are artificial stem cells
in this region, they are more methylated
methylation recruits HDACs (remove acetyl group from lysine → “+” charge → less gene expression & tightly packaged chromatin; histone tails tightly bound to nucleosome)