2. QUALITY CONTROL
 Call Kai
 Learn
Learn Practice Test
 Spaced Repetition
 Match
Match Flashcards
 Knowt Play
1/72

There's no tags or description
Looks like no tags are added yet.
Name | Mastery | Learn | Test | Matching | Spaced | Call with Kai | Chat |
|---|
No analytics yet
Send a link to your students to track their progress
73 Terms
Quality Assurance (QA)
A comprehensive system of policies and procedures that ensures reliable laboratory results by preventing errors throughout the testing process.
Standard Operating Procedures (SOPs)
Written instructions that standardize laboratory procedures to ensure consistent and reliable results.
Quality Control (QC)
A component of Quality Assurance that monitors the accuracy and precision of laboratory testing using quality control materials.
Quality Control Materials
Materials with known values used to monitor QC or the accuracy and precision of laboratory tests.
Reference Materials
Materials used solely to calibrate laboratory instruments and equipment.
Total Quality Management (TQM)
Refers to the overall process used to ensure that laboratory results meet the requirements for health care services to patients
Control limits
s the acceptable range of values that a QC result should fall within.
±2 SD
The ideal QC control limit is _____
Levey-Jennings Chart
is the most commonly used quality control chart in the laboratory.
2
Level 1 = Normal
Level 2 = Abnormal
General chemistry tests usually use __ levels of control.
3
Level 1 = low control
Level 2 = normal control
Level 3 = high control
Immunoassays commonly use __ levels of control.
lyophilized
Most commercially prepared QC materials are _____________
● To check the stability of the machine
● To check the quality of the reagents
● To check technical (operator) errors
ENUMERATE
OBJECTIVES OF QUALITY CONTROL
College of American Pathologists (CAP) proficiency program
It is considered the gold standard for External Quality Control in clinical laboratories.
National Reference Laboratories (NRLs)
are the DOH-designated EQAS providers.
Department Order No. 393-E s. 2000
According to ____________________________, the DOH designated five National Reference Laboratories (NRLs).
Lung Center of the Philippines (LCP)
NRL for Clinical Chemistry
San Lazaro Hospital /STD-AODS Cooperative Central Laboratory (SLH/SACCL)
NRL for Immunology/Serology and HBsAg, HIV, HCV
East Avenue Medical Center (EAMC)
NRL for Toxicology, Occupational and Environmental Health and Micronutrient Assay. Drugs of abuse (methamphetamine and cannabinoids)
National Kidney and Transplant Institute (NKTI)
NRL for Hematology and Coagulation
Research Institute for Tropical Medicine
NRL for Microbiology (identification and antibiotic susceptibility testing) and Parasitology (identification of ova and quantification of malaria)
● Glucose
● Blood Urea Nitrogen (BUN)
● Creatinine
● Uric Acid
● Cholesterol
● Total Protein
● Albumin
● Sodium
● Potassium
● Chloride
10 ANALYTES BEING QUANTIFIED FOR NEQAS CLINICAL CHEMISTRY
Sensitivity
Ability of the analytical method/process to detect the smallest concentration of analyte of interest
Specificity
Ability of an analytical method to measure only the specific analyte of interest
Accuracy
Nearness or closeness of the results to the true or target value
Precision or Reproducibility
Ability of an analytical method to give repeated results on the same sample that agree with one another
Practicability
Degree by which a method is easily repeated
Reliability
Ability of an analytical method to maintain accuracy and precision over an extended period of time during which equipment, reagents, and personnel may change
True Positive
A patient has the disease or condition and is positive on the test
False Negative
the patient has the disease or condition but is negative on the test
Diagnostic Specificity
Ability of a test to correctly identify the absence of a given disease or condition
True Negative
the patient does not have the disease or condition and is negative of the test
False Positive
the patient does not have the disease or condition but is positive of the test
Diagnostic Sensitivity
Ability of a test to detect a given disease or condition
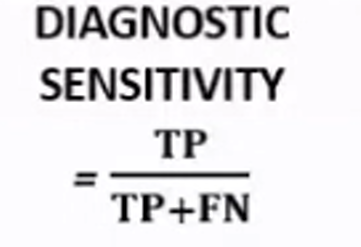
formula for Diagnostic Sensitivity
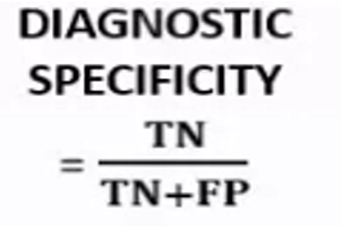
formula for Diagnostic Specificity
RANDOM ERROR
Present in all measurements; due to chance
RANDOM ERROR
this is a type of error due to instrument, operator, environmental conditions such as pipetting error, mislabeling in samples, temperature of analyzer (fluctuations in temperature), and improper mixing of sample or reagent
SYSTEMATIC ERROR
Error always in one direction. It is detected as either positive or negative bias
SYSTEMATIC ERROR
type of error that is often related to calibration problems, deterioration of reagents and control materials, improperly made standard solutions (for calibrations of analyzers in the laboratory), contaminated solutions, unstable and inadequate reagent blanks, leaky ion selective electrode (ISE, or in case you are using ISE to measure patient’s electrolytes), poorly written solutions
Constant error
Proportional Error (Slope/Recent Error)
ENUMERATE
types of systematic error
Constant error
The magnitude of change is constant and not dependent on amount of analyte.
Cause: interference or contamination
Proportional Error (Slope/Recent Error)
Error dependent on analyte concentration
Cause: poor recovery of analyte during an analysis
a. acceptable
if RE and SE (total error) < Ea, the performance of the test is considered ______________
a. acceptable
b. rejected
b. rejected
if RE and SE (total error) > Ea, the performance of the test is considered ______________
a. acceptable
b. rejected
less than 1%
Highly precise analyzers often have a CV of ___________.
Mean
The average of a set of values and the most commonly used measure of central tendency.
Standard Deviation
The most commonly used measure of variation that indicates how far values are dispersed from the mean
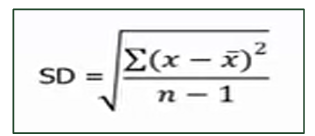
formula for SD
False
T or F
The lower the SD, it’s farther to the mean or the average value
Coefficient of Variation (CV)
An index of precision that expresses variability as a percentage
Variance
A measure of variability equal to the square of the standard deviation (SD²).
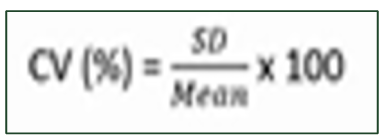
formula of CV
68.3%
______ of the values under the normal curve is between ± 1SD
95.4%
_____ of the values would fall under ± 2SD control limits
99.7%
____ under the normal curve is between ± 3SD
Westgard Rules
Decision rules applied to the Levey-Jennings Chart to determine whether a QC run should be accepted or rejected.
Cumulative Sum (CUSUM) Graph
A QC chart used for the early detection of systematic errors.
Youden / Twin Plot
A QC chart used to identify proportional and constant analytical errors.
TREND
A QC pattern in which control values continuously increase or decrease for 6 consecutive days and cross the mean.
Main cause: deterioration of reagents
SHIFT
A QC pattern in which 6 consecutive control values remain on the same side of the mean.
Main cause: improper calibration of the instrument
(1) QC values continuously increase or decrease for 6 consecutive days, and
(2) the values pass the mean.
Criteria for a Trend
OUTLIERS
○ Are values that are far from the main set of values
○ Are highly deviating values
○ Caused by R/S errors
Yes
if the control value is seen outside the +2S, is it still classified as 12s rule violation?
12s
1 is the control rule, indicates the number of control observations per analytic run
13s + R4s
what are the westgard rules that indicate random error?
22s + 41s + 10x
what are the westgard rules that indicate systematic error?
1₂s
One control observation exceeds the mean ±2 SD; a warning rule used for screening that prompts evaluation using other Westgard rules.
1₃s
One control observation exceeds the mean ±3 SD, indicating a random error.
2₂s
Two consecutive control observations exceed the same mean ±2 SD limit, indicating a systematic error.
4₁s
Four consecutive control observations exceed ±1 SD on the same side of the mean, indicating a systematic error.
R₄s
The difference between the highest and lowest QC result within the same analytical run exceeds 4 SD (one above +2 SD and one below −2 SD), indicating a random error.
10x
Ten consecutive control observations fall on the same side of the mean, indicating a systematic error.