167 - Quality Methods - Topic 4
1/53
Earn XP
Description and Tags
4.4 - Alternate Control Charts (1-13) 4.1 - State of Control (14- 27) 4.2 - Specifications (28-39) 4.3 Process capability (40-
Name | Mastery | Learn | Test | Matching | Spaced | Call with Kai |
|---|
No analytics yet
Send a link to your students to track their progress
54 Terms
When is a ‘variable subgroup size’ control chart used?
Used when the sample size is not the same ]
• Different control limits for each subgroup
• As n increases, limits become narrower
• As n decreases, limits become wider apart
• Difficult to interpret and explain
• To be avoided
![<p>Used when the sample size is not the same ]</p><p>• Different control limits for each subgroup </p><p>• As n increases, limits become narrower </p><p>• As n decreases, limits become wider apart</p><p> • Difficult to interpret and explain </p><p>• To be avoided</p>](https://knowt-user-attachments.s3.amazonaws.com/9c5d3d40-9779-40ac-924d-9e809e2b2c76.png)
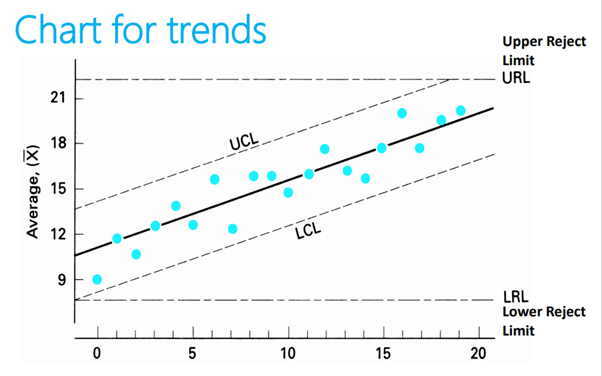
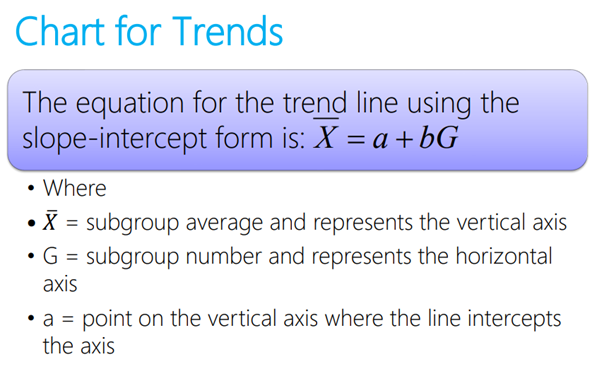
When is a ‘chart for trends’ used? What equation is used?
Used when the plotted points have an upward or downward trend that can be attributed to an unnatural pattern of variation or a natural pattern such as tool wear.
Because the central line is on a slope, its equation must be determined.
This is best accomplished using the ‘least squares method’ of fitting a line to several points
what is a ‘chart for moving average and moving range’?
No calculations are made until the third period
At this point the sum of the three values are posted to the ‘three period moving sum’ column
The average and range are calculated and posted to the 𝑋ത and R column
NOTE: the time period can be whatever is appropriate, 2 hours, 5 days, 3 shifts etc
Used as the effect of extreme values has a greater effect on the conventional chart
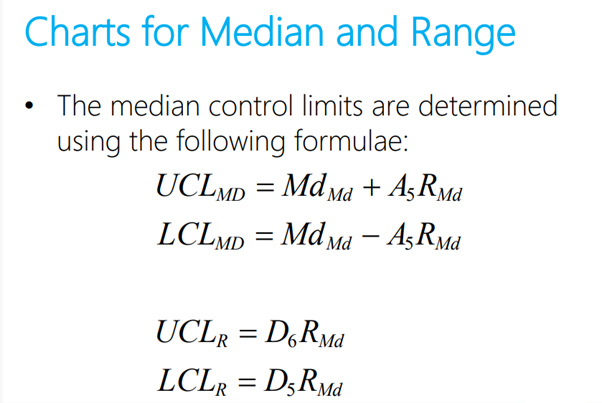
what is a chart for median and range?
A simplified variable control chart that minimises calculation is the median and the range. Data is collected in the conventional way but the mean and range of each subgroup are found.
The medians of the subgroup medians (also termed ‘grand median’) Md subsript Md and the median of the subgroup range, R subscript Md are found by counting to the mid-point value
how do you calculate the median control limits?
What are the advantages and disadvantages for a median and range chart?
Benefits
• Less Arithmetic
• It is easier to understand
• Easily maintained by operators
Disadvantages
• Doesn’t take into account the large/small values in any subgroup
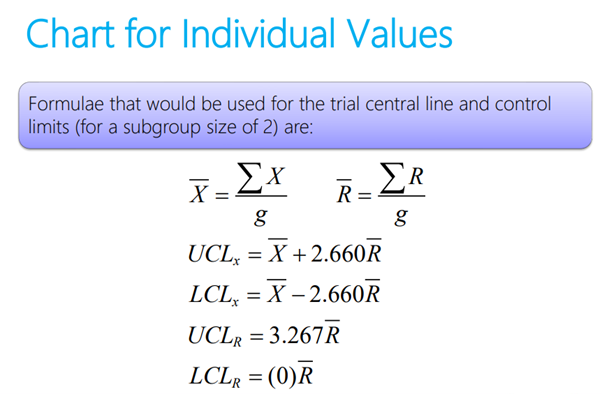
What is the formulae for the trial central line and control limits for the individual charts?
This formulae requires the ‘moving range technique’ with a subgroup size of 2
To obtain the first range point, the value of X1 is subtracted from X2 The second range point is obtained by subtracting X2 from X3 (and so on) Range points are plotted between the subgroup number on the R chart Range points are averaged to obtain 𝑅ത
What are the advantages and disadvantages for charts of individual values?
Advantages of the X chart
• easier to construct on the shop floor
• Provides direct comparison to specifications
Disadvantages:
• Requires too many subgroups to indicate an out of control condition • Doesn’t summarise the data as well as x bar
What are the features of a chart with Non-acceptance limits
Non-Acceptance limits have the same relationship to averages as specifications have to individual values.
Control Limits tell what the process is capable of doing, and reject limits tell when the product is conforming to specifications
What are the three cases of a chart with non-acceptance limits?
Case I
• Non acceptance limits are greater than the control limits – desirable as an out of control condition will not result in an non conforming product
Case II
• Non acceptance limits are equal to the control limits – therefore any out of control situations will result in a non conforming product being produced.
Case III
• Non acceptance limits are inside the control limits, this means that some non conforming product will be produced even when the process is in control
What is an exponential weighted moving average?
Also called the geometric moving average chart
Gives greatest weight to most recent values (less weight to previous data)
Primary advantage is the ability to detect small shifts in the process average
It does not react as quickly to large shift as the 𝑋ത chart
In practise one could plot both on the same chart (in different colours to benefit from both)
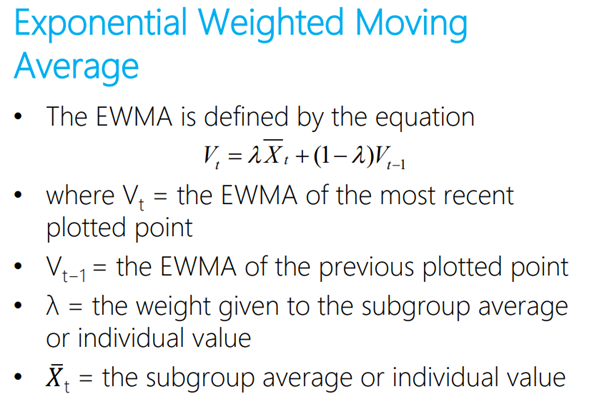
How would you calculate the EWMA (exponential weighted moving average)?
The value of lambda (λ) should be between 0.05 and 0.25 with lower values giving a better ability to detect smaller shifts
Values of 0.08, 0.10 and 0.15 work well
In order to start the sequential calculations, V subscript (t-1) is given the value ‘X bar bar’
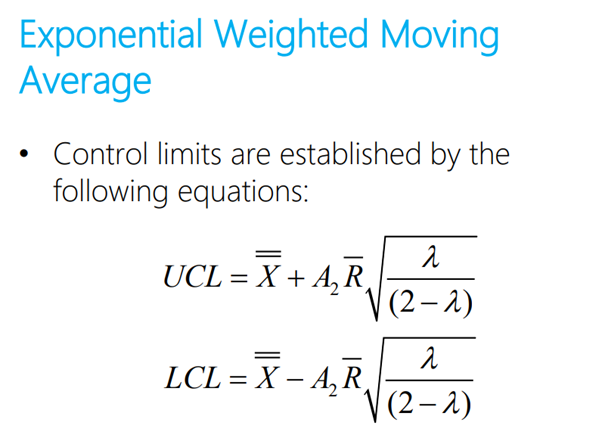
How do you calculate the control limits of EWMA?
What dies it mean to be ‘in a state of control’?
When special causes have been eliminated from the process to the extent that the points plotted on the control chart remain within the control limits
When a process is in control, there occurs a natural pattern of variation
No higher degree of uniformity can be attained with the existing process.
Greater uniformity can, however, be attained through a change in the basic process through quality improvement ideas
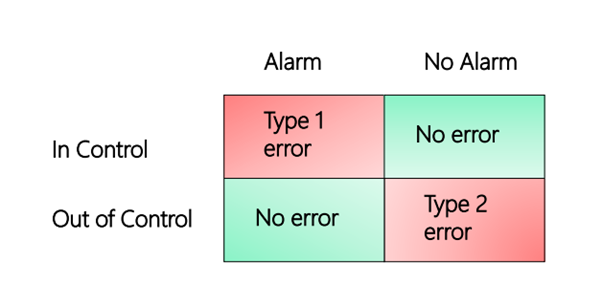
Why do we set the limits 3 standard deviations either side of the central line? (Type, I,II)
3σ limits provide an economic balance between the costs resulting from the two types of errors
When the limits are set at 3 standard deviations, a Type I error will occur 0.27% (3 out of 1000) of the time
In other words, when a point is outside the control limits, it is assumed to be due to an assignable cause, even though it would be due to a chance cause 0.27% of the time
Type II errors, occur when assuming that a common cause of variation is present when in reality, there is a special cause (false negative)
In other words, when a point is inside the control limits, it is assumed to be due to a chance cause, even though it might be due to an assignable cause. We might think of this situation as “innocent until proven guilty.”
What are the 7 things that happen when a process is in control?
Individual units will be more uniform (meaning less variation and fewer rejections0
Because its more uniform, fewer samples are needed to judge the quality therefore cost of inspection can be reduced to a minimum
the process capability or spread is easily attained from 6 standard deviations
trouble can be anticipated (avoiding rejections and interruptions)
The percentage of product that falls within any pair of values may be predicted with the highest degree of assurance
It permits the consumer to use the producer’s data and, therefore, to test only a few subgroups as a check on the producer’s records. The 𝑋 bar and R charts are used as statistical evidence of process control.
It is an indication that the operator is performing satisfactorily from a quality viewpoint. Further improvement in the process can be achieved only by changing the input factors: materials, equipment, environment, and operators. These changes require action by management.
What decisions relative to the specification has to be made once the process is in the control
to decide the product or service specifications or requirements,
to decide the amount of rework or scrap when there is insufficient tolerance, and
to decide whether to produce the product to tight specifications and permit interchangeability of components or to produce the product to ‘loose specifications’ and use selective matching of components.
What does it mean if a process is ‘out of control’?
The term ‘out of control’ is usually thought of as being undesirable; however, there are situations where this condition is ‘desirable’.
It is best to think of the term ‘out of control’ as a change in the process due to an assignable cause.
When a point (subgroup value) falls outside its control limits, the process is out of control.
This means that an assignable cause of variation is present.
Another way of viewing the ‘out of control’ point is to think of the subgroup value as coming from a different population than the one from which the control limits were obtained.
A process can also be considered out of control even when the points fall inside the 3 sigma limits. This situation occurs when unnatural runs of variation are present in the process
What is the best way to determine if an unnatural pattern is out of control?
Rather than divide the space into three equal zones of 1 standard deviation, a simplified technique would divide the space into two equal zones of 1.5 standard deviations. The process is out of control when there are two successive points at 1.5 standard deviations or beyond.
What must be done when a process is out of control?
the assignable cause responsible for the condition must be found.
The investigation necessary to locate the cause of the out of control condition can be minimised by knowledge of the types of out of control patterns and their assignable causes.
What are the types of x bar and r patterns?
Change or jump in level
Trend or steady change in level
Recurring cycles
Two populations (also called mixture)
Mistake
What are the causes in an x bar chart and r chart for a change or jump in level?
X bar :
a) An intentional or unintentional change in the process setting
b) A new or inexperienced operator
c) A different material
d) A minor failure of a machine part
R bar:
a) Inexperienced operator
b) Sudden increase in gear play
c) Greater variation in incoming material
What are the causes in an x bar chart and r chart for a trend or steady change in level?
X bar chart:
a. Tool or die wear
b. Gradual deterioration of equipment
c. Gradual change in temperature or humidity
d. Viscosity breakdown in a chemical process
R chart (not as common on an R chart but still possible):
• An improvement in operator skill (downward trend)
• A decrease in operator skill due to fatigue, boredom, inattention, etc. (upward trend)
• A gradual improvement in the homogeneity of incoming material
What are the causes in an x bar chart and r chart for recurring cycles?
X bar chart:
a)The seasonal effects of incoming material
b)The recurring effects of temperature and humidity (cold morning start-up)
c)Any daily or weekly chemical or mechanical event
d)The periodic rotation of operators
R chart (not as common on an R chart but still possible):
Operator fatigue and rejuvenation resulting from morning, noon, and afternoon breaks
Lubrication cycles
Why do some recurring cycles not get noticed? and how can we fix it?
Its due to the inspection cycle
A cyclic pattern of a variation that occurs approximately every 2 h could coincide with the inspection frequency. Therefore, only the low points on the cycle are reported, and there is no evidence that a cyclic event is present
What are the causes in an x bar chart and r chart for two populations (mixture)?
(When there are a large number of points near or outside the control limits, a two-population situation may be present.
X bar chart:
a) Large differences in material quality
b) Two or more machines on the same chart
c) Large differences in method or equipment
R chart:
• Different operators using the same chart or…
• Materials from different suppliers
What are the causes in an x bar chart and r chart for two populations (mixture)?
a) Measuring equipment out of calibration
b) Errors in calculations
c) Errors in using test equipment
d) Taking samples from different populations
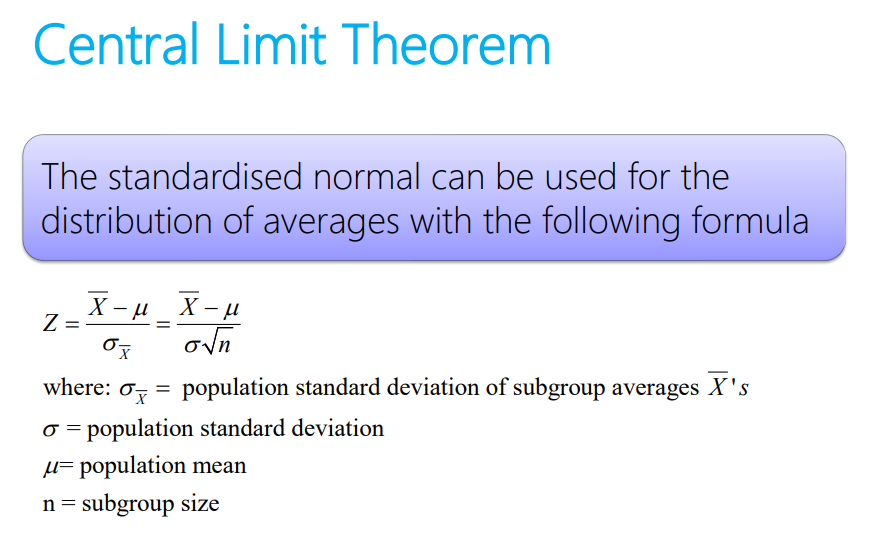
What is the central limit theorem
There exists a difference in the frequency distribution of individual values (X’s) and the frequency distribution of averages (𝑋 bars ’s)
If the population from which samples are taken are NOT normal… the distribution of sample averages will tend toward normality provided the sample size (n) is at least 4
This tendency improves as the sample size gets larger
How do you calculate the distribution of averages?
How is the central limit theorem illustrated?
a uniform population distribution…
and a triangular population distribution of individual value
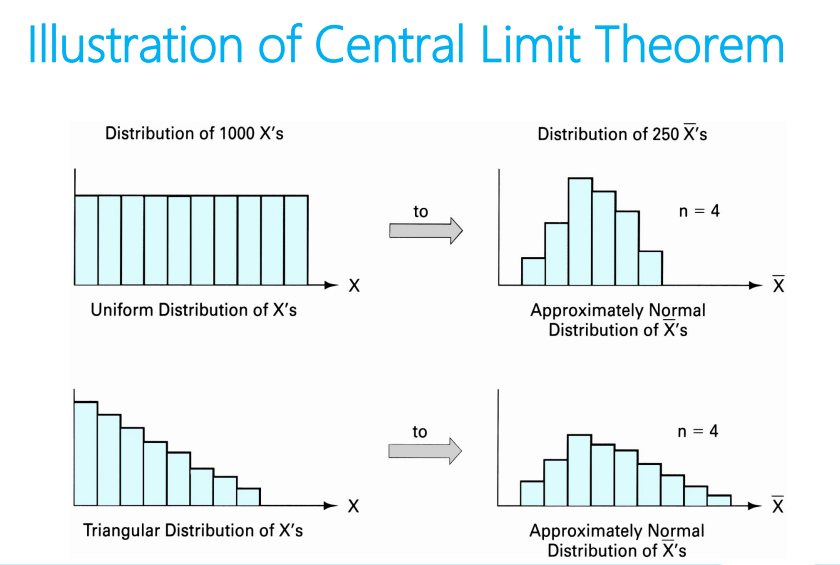
What kind of distribution do you get from x bars?
approximately normal distribution
NOTE: We do not need to be concerned if the distribution of X’s is not normal…
• Provided that the sample size (subgroups) is ≥4
What is ‘unimodal’
symmetrical distribution that tapers off at both tails
What is the difference between control limits and specifications?
Control limits are established as a function of the averages; in other words, control limits are for averages.
Specifications, are the permissible Variation in the size of the part and are, therefore, for individual values.
what factors are independent for control limits?
control limits
process spread
distribution of individual values
They are determined by the process, where as the specifications have an optional location
what is tolerance?
The difference between specifications and capability
what are the three different cases between process capability and tolerance?
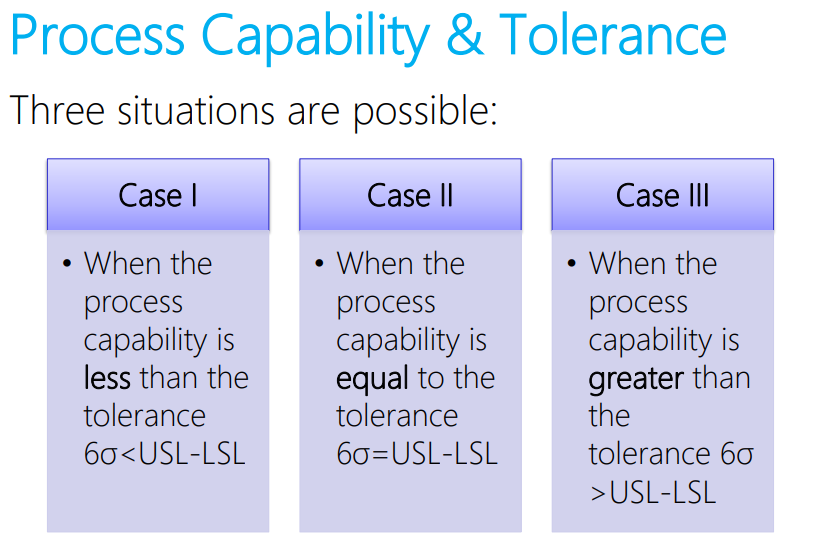
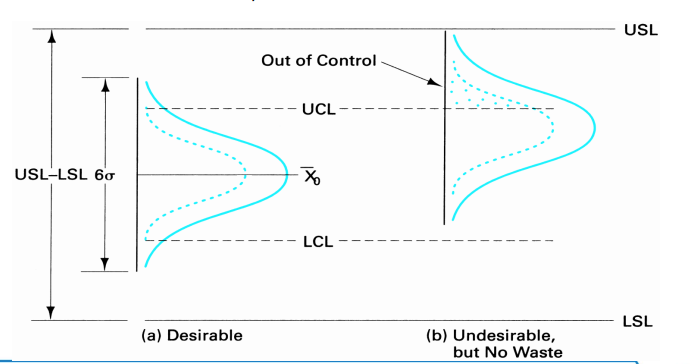
explain case I between process capability and tolerance in more detail
Where the process capability (6σ) is less than the tolerance (USL-LSL) is desirable.
The chart A illustrates the ideal relationship by showing:
• The distribution of individual values (X’s)
• The 𝑋 bar control chart limits
• The distribution of averages (𝑋 bar’s)
The chart B illustrates:
The process is out of control (undesirable):
• The shift has resulted in an ‘out of control’ condition
• However, there is no waste because:
• The distribution of individual values (X’s) has not exceeded the upper specification
• Corrective action is required to bring the process intro control
the process is in control (desirable) if:
the tolerance is greater than the process capability
no substantial difficulty is encountered (even when here is s substantial shift in the process average
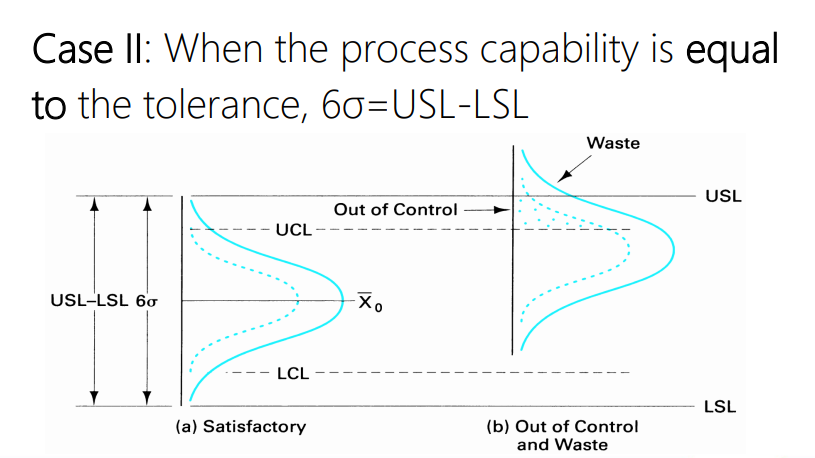
explain case II between process capability and tolerance in more detail
The frequency distribution of X’s in (a) represents a natural pattern of variation.
However, when there is a shift in the process average, as indicated in (b), the individual values (X’s) exceed the specifications.
As long as the process remains in control, no nonconforming product is produced; …
however, when the process is out of control as indicated in (b), nonconforming product is produced.
Therefore, assignable causes of variation must be corrected as soon as they occur.
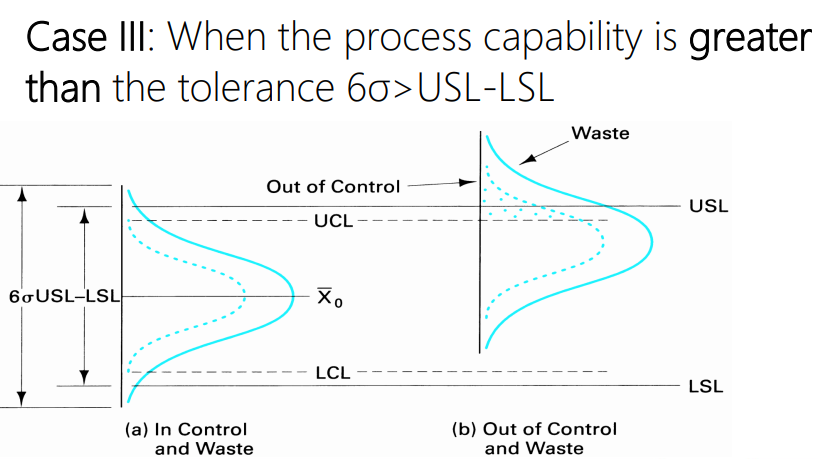
explain case III between process capability and tolerance in more detail
Undesirable, the process capability is greater than the tolerance Even though a natural pattern of Variation is occurring, as shown by the frequency distribution of X’s in (a), some of the individual values are greater than the upper specification and are less than the lower specification 25
Case III: This case presents the unique situation where the process is in control as shown by the control limits and frequency distribution of 𝑋ത’s, but nonconforming product is produced In other words, the process is not capable of manufacturing a product that will meet the specifications. When the process changes as shown in (b), the problem is much worse
When can you determine true process capability?
The true process capability cannot be determined until the 𝑋ത and R charts have achieved optimal quality improvement without substantial investment for e.g. new equipment.
what is process capability equal to?
Process capability is equal to 6σ subscript 0 when the process is in statistical control (note the subscript ‘0’)
The range over which the natural variation of a process occurs as determined by the system of common or random causes
Measured by the proportion of output that can be produced within design specifications
What is the quickest way to determine process capability?
it is sometimes necessary to obtain the process capability by quick method rather than using x bar and r charts
This method assumes the process is stable or in statistical control
Take 25 (g) subgroups of size 4 for a total of 100 measurements
Calculate the range, R, for each subgroup
Calculate the average range, 𝑅 bar= ΣR/g = ΣR/25
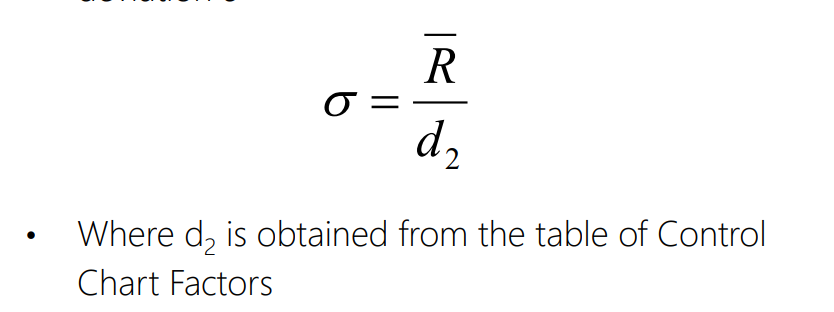
Calculate the estimate of the population standard deviation
Process capability will equal 6σ subscript 0
NOTE: this technique does not give the true process capability and should only be (practically) used if circumstances require it.
—> Using more than 25 subgroups will improve accuracy

How do you calculate an estimate of the population standard deviation?
How do you determine process capability by using standard deviation?
Take 25 (g) subgroups of size 4 for a total of 100 measurements
Calculate the sample standard deviation, s, for each subgroup
Calculate the average sample standard deviation, 𝒔 bar= Σs/g
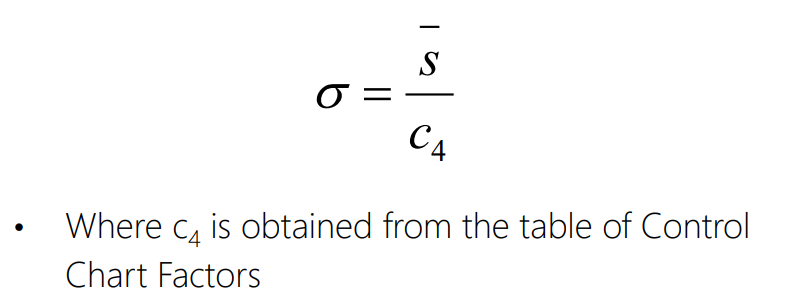
Calculate the estimate of the population standard deviation
Process capability will equal 6σ subscript o
How do you calculate an estimate of the population standard deviation using s bar?
Which method is more accurate to find the process capability?
Either the range or the standard deviation method can be used,
• although,the standard deviation method is more accurate.
How can you determine process capability using a histogram?
Either the range or the standard deviation method can be used,
A histogram should be constructed to graphically present the process capability.
A minimum of 50 measurements is required for a representative histogram.
Process capability and the tolerance are combined to form a capability index
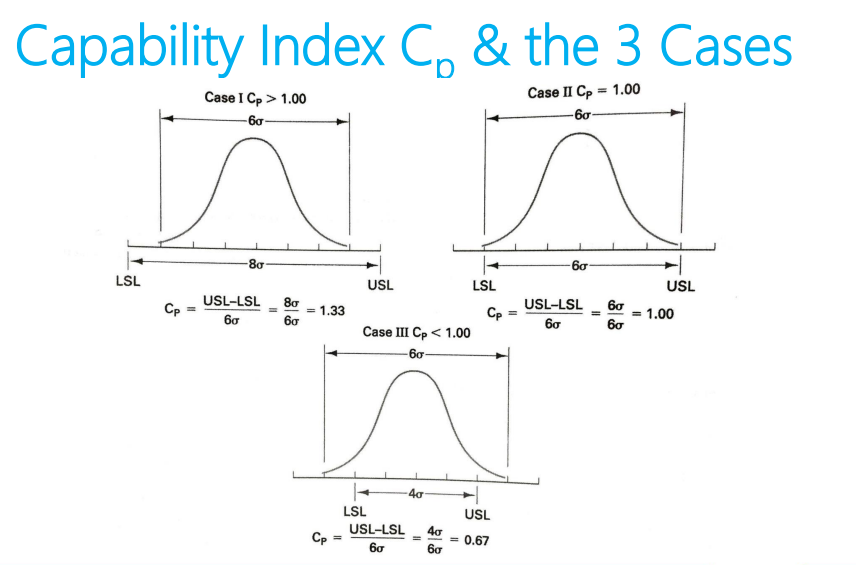
How do you calculate capability index?
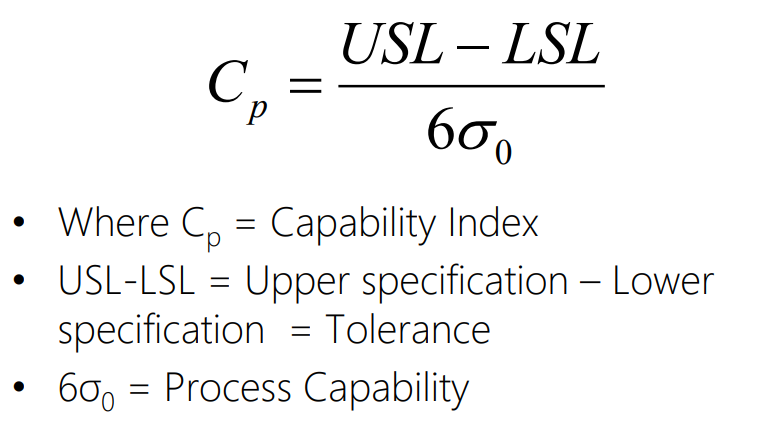
What does the capability index determine?
• If the capability index is 1.00 then we have a Case II situation
• If the ratio is greater than 1.00, this is Case I (desirable)
• If the ratio is less than 1.00, this is Case III (undesirable)
How do we use the capability index concept to measure quality?
Using the Capability Index (C subscript p ) concept, we can measure quality provided the process is centred.
The larger the C subscript p , the better the quality
We should strive to make the C subscript p as large as possible
This is accomplished by having realistic specifications and continually striving to improve process quality
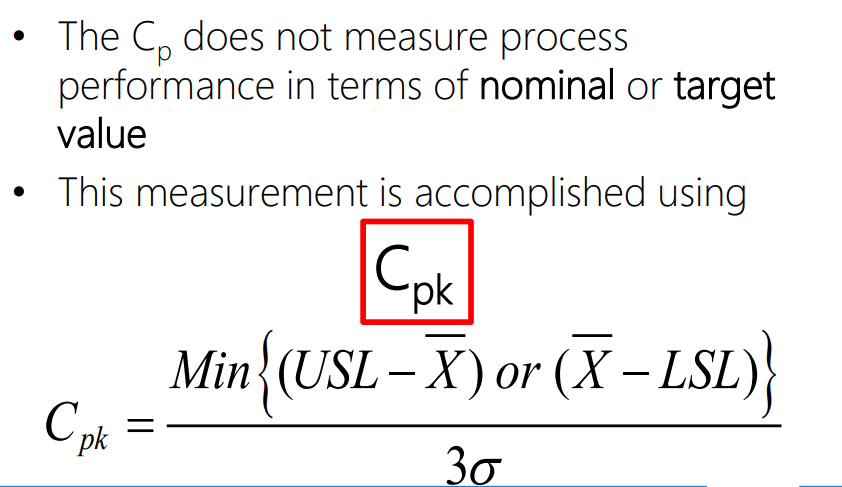
How do you measure process performance in terms of nominal or target values? And why do we use this?
Estimates what the process is capable of producing, considering that the process mean may not be centred between the specification limits.
If the process mean is not centred, Cp overestimates process capability
Cp < 0 = process mean falls outside of the specification limits
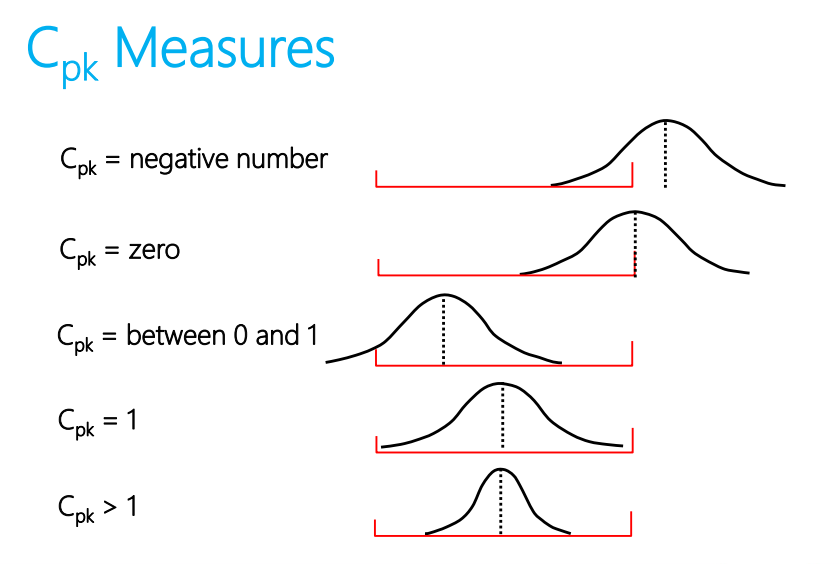
What are the 8 rules of capability index?
1. The Cp value does not change as the process center changes
2. Cp =Cpk when the process is centered
3. Cpk is always equal to or less than Cp
4. A Cpk = 1 indicates that the process is producing product that conforms to specifications
5. A Cpk < 1 indicates that the process is producing product that does not conform to specifications
6. A Cp < 1 indicates that the process is not capable
7. A Cpk=0 indicates the average is equal to one of the specification limits
8. A negative Cpk value indicates that the average is outside the specifications