Microeconomics Exam 1
1/54
Earn XP
Description and Tags
Name | Mastery | Learn | Test | Matching | Spaced | Call with Kai |
|---|
No analytics yet
Send a link to your students to track their progress
55 Terms
Cost-benefit principle
Costs and benefits are the incentives that shape decisions. Pursue only choices with benefits at least as large as cost
Opportunity cost principle
True cost of something is the next best alternative that you have to give up
Marginal principle
Decisions about quantities are best when made incrementally, so break “how many?” questions into smaller marginal decisions
Interdependence principle
Your best choice depends on other factors:
Dependence between individual choices
Dependence on others’ choices
Dependence between markets
Dependence through time
Marginal Cost
Extra cost from one extra unit of a good
Scarcity
Limited resources
Economic Surplus
Total benefits minus total cost
Framing Effect
When a decision is affected by how a choice is described or framed
Opportunity cost
The next best alternative you give up when making a decision
Sunk cost
Cost already incurred that cannot be reversed and should be ignored
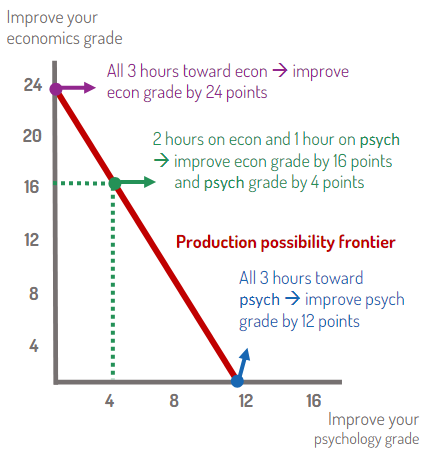
Production Possibility Frontier (PPF)
Shows the different sets of outputs attainable with scarce resources. Used to help visualize the trade-offs of opportunity cost

Willingness to pay
Conversion of non financial costs or benefits into their monetary equivalent
Marginal benefit
Extra benefit from one extra unit of a good
Rational Rule
If something is worth doing then keep doing it until marginal benefit = marginal cost
Economics
The study of choices
Complementary goods
Goods that work well together
Congestion Effect
A good becomes less valuable when other people use it
Decrease in demand
Shift of demand curve to the left
Diminishing marginal benefit
Each additional item yields a smaller marginal benefit than the previous unit
Ceteris Parabus
holding all other things constant
Increase in demand
Shift of demand curve to the right
Individual demand curve
Curve that plots the quantity of an item that an individual plans to purchase at each price
Inferior goods
A good for which a higher income causes a decrease in demand
Law of demand
Tendency for quantity demanded to be higher when the price is lower
Market demand curve
Composed by adding the quantity demanded at each price in multiple individual demand curves, still looks similar.
Movement along demand curve
As price increases, quantity demanded decreases
Network Effect
Good which becomes more useful as other people use it.
Normal good
A good for which a higher income causes an increase in demand
Rational rule for buyers
Buy one more if the marginal benefit ≥ price
Shift in demand curve
Occurs when changes to any of these occur: Income, Preferences, Price of related goods, Expectations, Network and congestion effects, Type and number of buyers
Substitute goods
Goods that can replace each other
Complements in production
Goods that are made together
Decrease in Supply
Shift of supply curve to the left
Diminishing marginal product
Marginal product declines as input increases
Fixed costs
Costs that don’t vary based on changes in output produced
Increase in supply
Shift of the supply curve to the right
Individual Supply Curve
Graph plotting the quantity of an item that a business plans to sell at each price
Law of Supply
The higher the price is, the higher the quantity supplied will be
Marginal Product
Increase in output due to additional input
Market Supply Curve
Total quantity supplied by the entire market at each price
Movement along supply curve
As price increases, quantity supplied increases
Perfect competition
Occurs when goods are identical and have many buyers and sellers that are each relatively small within the market
Price taker
A seller who charges the prevailing price because they cannot affect it.
Rational Rule for Sellers in Competitive Markets
Supply one more unit until price ≥ marginal cost
Shift in Supply Curve
Occurs when changes to any of these occur: Input Prices, Productivity and technology, prices of related outputs, expectations, the type and number of sellers
Substitutes in Production
Alternative uses of resources
Variable costs
Costs that vary with the amount of output produced
Equilibrium
A point at which there is no tendency for change, occurs when the market quantity demanded is equivalent to the quantity supplied
Equilibrium Price
Price at which the market is in equilibirum
Equilibrium Quantity
Quantity demanded and supplied when the market is in equilibrium
Market
A setting that brings together buyers and sellers
Market Economies
Each person makes their own production and spending decisions
Planned Economies
Centralized decisions are made about what is produced, how, by whom, and who gets what.
Shortage
When the market quantity demanded is greater than the quantity supplied
Surplus
When the market quantity supplied is greater than the quantity demanded