AP Statistics Chapters 1-3 Concepts
0.0(0)
Studied by 17 peopleCard Sorting
1/63
Earn XP
Description and Tags
Last updated 2:27 AM on 9/12/22
Name | Mastery | Learn | Test | Matching | Spaced | Call with Kai | Chat |
|---|
No analytics yet
Send a link to your students to track their progress
64 Terms
1
New cards
individuals
the objects described by a set of data; may be people, animals, or things
2
New cards
variables
Any characteristics of an individual; can take different values for different individuals
3
New cards
categorical variable
a variable that places and individual into one of several groups or categories
4
New cards
quantitative variable
a variable that takes numerical values for which it makes sense to find an average
5
New cards
distribution
tells us what values the variable takes and how often it takes these values
6
New cards
frequency
the number of times a particular value for a variable has been observed
7
New cards
relative frequency
the ratio that compares the frequency of each category to the total frequency
8
New cards
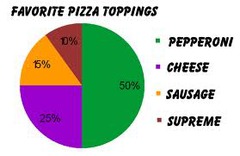
pie graphs/charts
used only when you want to emphasize each category's relation to the whole
9
New cards
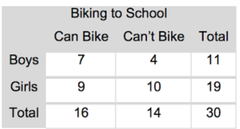
two-way table
a way to display the frequencies of two categorial variables; one variable is represented by rows, the other by columns
10
New cards
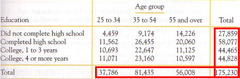
marginal distribution
in a two-way table of counts, the distribution of values of one of the categorical variables among all individuals described by the table
11
New cards
conditional distribution
describes the values of a variable among individuals who have a specific value of another variable; basically, looking for the values of this variable that satisfy a condition of the other variable
12
New cards
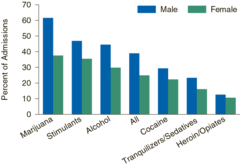
side-by-side bar graph
used to compare the distribution of a categorical variable in each of several groups; for each value of the categorical variable, there is a bar corresponding to each group. can be in counts of percents
13
New cards
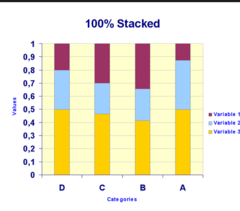
segmented bar graph
displays the distribution of a categorical variable as segments of a rectangle, with the area of each segment proportional to the percent of individuals in the corresponding category
14
New cards
association between variables
if knowing the value of one variable helps predict the value of the other; if it doesn't then there is no association (the bar graphs would look the same)
15
New cards
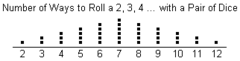
dotplot
a graph w/ a horizontal axis and w/ dots above locations on the number line; displays quantitative variables . . . remember to label the graph
16
New cards
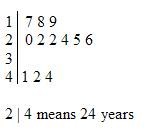
stemplot
used for fairly small data sets; show distribution by putting the final digit on the outside (leaves) and having the first digit(s) on the inside (stem) . . . remember to add a key . . . can also have a back-to-back stemplot
17
New cards
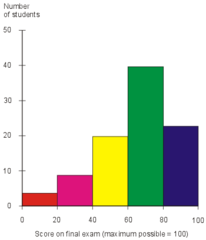
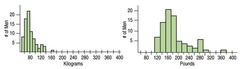
histogram
nearby values of quantitative data are grouped together . . . bars are side by side/connected . . . can be frequency counts of relative frequency
18
New cards
"describe this distribution"
describe shape, outliers, center, spread, and include context
19
New cards
outliers and rule
any point that lies MORE than 1.5 IQR's from either quartile
1.5*IQR+Q3< = outlier
Q1-1.5*1QR> = outlier
1.5*IQR+Q3< = outlier
Q1-1.5*1QR> = outlier
20
New cards
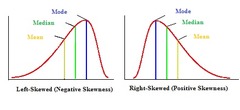
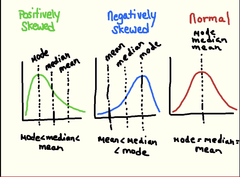
skewed left/right
a non-symmetrical distribution where one tail stretches out further (to the left/right) than the other . . . if the long tail is to the right, it's skewed-right, if the long tail is to the left, it's skewed-left
21
New cards
"compare these distributions"
describe the shape, outliers, spread, center, of each, but use comparative words/phrases and explain how they differ from each other . . . include CONTEXT
22
New cards
mean vs. median (when to use)
use the mean (and SD) when you have symmetric data with NO outliers or skewness . . . use the median (and IQR) when you have heavy skewness or outliers because the median is resistant
23
New cards
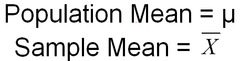
mean of population vs. sample
use X̄ (x-bar) when you are describing the mean of a sample . . . use μ (mew) when you are describing the mean of a population (whole thing)
24
New cards
standard deviation of population vs. sample
use s_x when you are describing the standard deviation of a sample . . . use σ (sigma) when you are describing the standard deviation of a population (whole thing)
25
New cards
quartiles
values that divide a data set into four equal parts . . . first (lower) quartile is @ 25th percentile and halfway between the minimum and the median . . . second quartile is @ 50th percentile and is the median . . . third (upper) quartile is @ 75th percentile and is halfway between the median and the maximum . . . the fourth quartile is irrelevant,
26
New cards
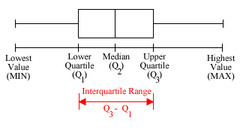
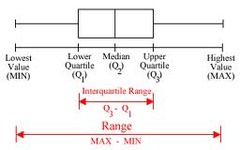
IQR (interquartile range)
third quartile - first quartile; the middle half /50% of the data
27
New cards
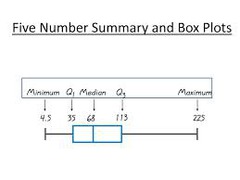
5 number summary
consists of the minimum, first quartile, median (second quartile), third quartile, and maximum
28
New cards
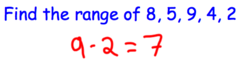
range
maximum - minimum . . . is a single number . . . you cannot say the range is 100-300 , must say the range is somewhere between 100-300, etc.
29
New cards
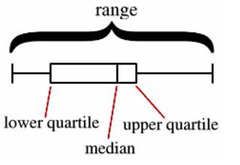
boxplot
a graph that does not display shape very well and does not display amount of observations but does display the 5 number summary in the form of a split box with two "whiskers" . . . also called a box-and-whisker plot
30
New cards
variance
the standard deviation squared . . . does not use the same units as the standard deviation and original data, so can only be used to prove something mathematically . . . s_x^2
31
New cards
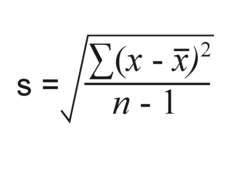
standard deviation
the average deviation of data from the mean . . . ex: on average, the football scores deviate/are off from the mean by 3 points . . . lowest the SD can be is 0 . . . measured with same units as original (when all points are the same) . . . is not resistant
32
New cards
resistant measure of center
the median is a resistant measure of center because it is only taking into account one point (the center point)
33
New cards
mean/SD vs. median/IQR
the mean/SD are NOT resistant (because they use every data point) and will be affected by outliers and skewness, so they should only be used to describe a distribution when the data is roughly symmetric . . . the median/IQR ARE resistant (because they only use 1-2 points) and should be used when there is heavy skewness or outliers
34
New cards
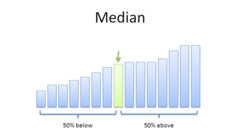
percentile
the value with p percent of the observations less than or equal to it . . . expressed as a percentile . . . interpreted as: "the value of ___ is at the pth percentile. about p percent of the values are less than or equal to ___."
35
New cards
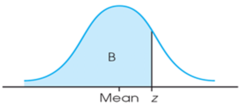
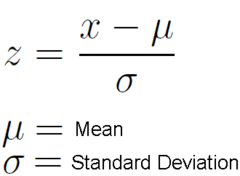
z-score (standardized score)
a measure of how many standard deviations you are away from the mean (negative = below, positive = above) . . . calculated by (observation - mean)/(standard deviation)
36
New cards
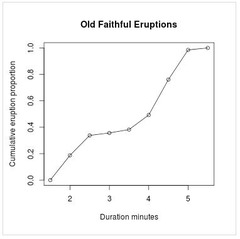
cumulative relative frequency graph
can be used to describe the position of an individual within a distribution or to locate a specified percentile of the distribution . . . uses percentiles on y-axis . . . the steeper areas mean more observations in that area, and vice versa for gradually growing areas
37
New cards
recentering vs. rescaling
recentering is when you add/subtract a constant to the distribution, moving it on the x-axis either left or right, NOT changing shape, spread (range and IQR), SD, . . . rescaling is when you multiply/divide by a constant, either making it more spread apart or closer together, NOT changing shape, median, mean
38
New cards
density curve
a mathematical curve that is always on or above the horizontal axis, has an area of 1 underneath it, and describes the overall pattern of a distribution . . . outliers are NOT described by the curve
39
New cards
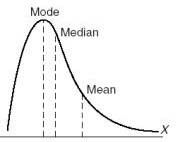
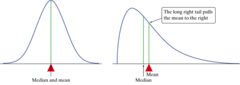
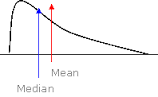
find mean/median in density curve
when the density curve is symmetric, the mean/median are the same and are in the middle . . . when the curve is skewed-right, the mean will be closer to the tail than the median, and the median will be at the middle of the data while the mean will be @ the "balance point" . . . vice versa for skewed-left distributions
40
New cards
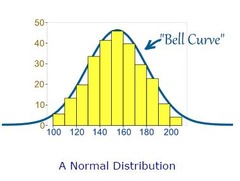
Normal distributions of data
distributions that fall in a bell-shaped shape and follow somewhat closely the empirical (68-95-99.7) rule . . . can be modeled by a Normal curve/model
41
New cards
Normal curve/model
mathematical model that describes normal distributions . . . they have the same overall pattern: symmetrical, single-peaked, bell-shaped . . . described by giving it's mean and SD (larger SD means more flat)
42
New cards
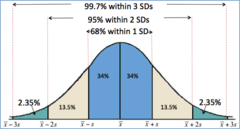
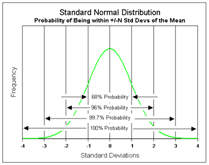
60%-95%-99.7% (empirical) rule of thumb
in a Normal model, 68% of data will be between 1 SD of the mean, 95% within two SD's, and 99.7% within three SD's
43
New cards
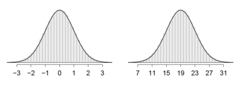
standard Normal model
the Normal model w/ mean 0 and SD 1 . . . the completely standardized Normal distribution
44
New cards
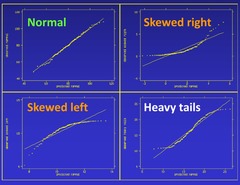
Normal probability plot
a display to help assess whether a distribution of data is approximately normal; if it is nearly straight, the data satisfy the nearly normal condition . . . found by getting the percentiles of each observation, then the z-scores for every percentile, and plot the data x w/ expected z-scores on the y-axis
45
New cards
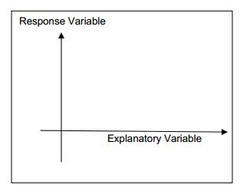
response variable
on the y-axis, measures an outcome of a study

46
New cards
explanatory variable
on the x-axis, may help explain or predict changes in a response variable
47
New cards
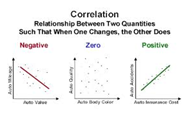
correlation (r)
measures the direction and strength of the LINEAR relationship between two QUANTITATIVE variables . . . just because correlation is high does not indicate linear-ness . . . can be -1 ≤ r ≤ 1 , where 0 is no correlation, and ±1 is perfect correlation . . . has NO unit of measurement . . . does NOT imply causation . . . NOT resistant . . . when x and y are flipped, the correlation r stays the same
48
New cards
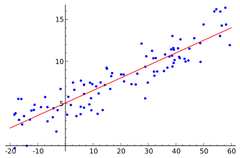
regression line
a line that describes how a response variable y changes as an explanatory variable x changes . . . oftentimes, these lines are used to predict the value of y for a given value of x . . . ONLY used when one variable helps explain/predict the other . . . also known as line of best fit
49
New cards
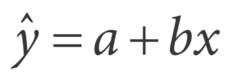
regression line equation
ŷ = a +bx
- ŷ (y hat) is the PREDICTED value of the response variable y for a given value of the explanatory variable x
- b is the slope, the amount by which y is PREDICTED to change when x increases by one unit
- a is the y-intercept, the PREDICTED value of y when x=0
- ŷ (y hat) is the PREDICTED value of the response variable y for a given value of the explanatory variable x
- b is the slope, the amount by which y is PREDICTED to change when x increases by one unit
- a is the y-intercept, the PREDICTED value of y when x=0
50
New cards
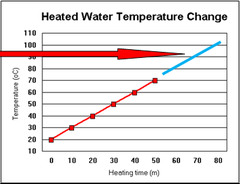
extrapolation
the use of a regression line for prediction far outside the interval of values of the explanatory variable x used to obtain the line, these predications are NOT accurate . . . sometimes the y-intercept is an extrapolation because x=0 wouldn't make sense or makes y negative
51
New cards
residuals
the difference between an observed value of the response variable and the value predicted by the regression line (vertical difference)
= observed y - predicted y
= y - ŷ
= observed y - predicted y
= y - ŷ
52
New cards
least squares regression line (LSRL)
the line of y on x that makes the sum of the squared residuals as small as possible . . . it's the residuals squared because if you didn't square them, when you added them together they would all cancel out . . . the mean of the least squares residuals is always 0
53
New cards
residual plot
a scatterplot of the residuals against the explanatory variable . . . helps to assess whether a linear model is appropriate . . . turns the regression line horizontal . . . if random scatter is on the plot, it is linear, if there is a pattern left over (such as a curve), it's not linear and the linear model is not appropriate
54
New cards
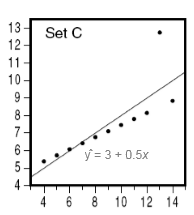
standard deviation of the residuals (s)
measures the the typical/approximate size of the typical prediction errors (residuals) when using the regression line . . . is s . . . written in original units . . . interpreted as: "when using the LSRL w/ x=[explanatory] to PREDICT y=[response], the model will typically be off by about ____ units."
![measures the the typical/approximate size of the typical prediction errors (residuals) when using the regression line . . . is s . . . written in original units . . . interpreted as: "when using the LSRL w/ x=[explanatory] to PREDICT y=[response], the model will typically be off by about ____ units."](https://knowt-user-attachments.s3.amazonaws.com/8cc02fdf8715409299d58478cd54b7be.jpg)
55
New cards
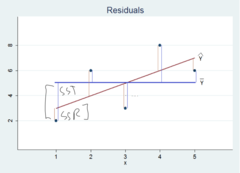
coefficient of determination (r^2)
the PERCENTAGE of the variation in the values of y that is accounted for by the LSRL of y on x . . . no units . . . measured 0 (does not predict at all) ≤ r ≤ 1 (perfect) . . . is the correlation squared . . . interpreted as: "___% of the variation in [response] is accounted for/explained by the linear model on [explanatory]."
56
New cards
describing slope of LSRL
"This model PREDICTS that for every 1 additional [explanatory], there is an increase by ____ more [response]."
57
New cards
describing y-intercept of LSRL
"This model PREDICTS that [explanatory] of 0 (context) would have a [response] of ____."
58
New cards
outlier in regression
a point that does not follow the GENERAL TREND shown in the rest of the data AND has a LARGE RESIDUAL when the LSRL is calculated
59
New cards
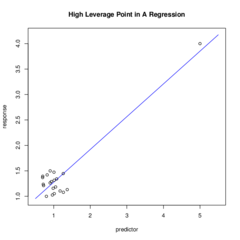
high-leverage point
a point in regression with a substantially larger or smaller x-value than the other observations
60
New cards
influential point
any point in regression that, if removed, changes the relationship substantially (much dif, slope, y-int, correlation, or r^2) . . . oftentimes, outliers and high-leverage points are influential
61
New cards
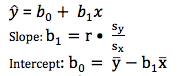
writing LSRL equations
ŷ = a +bx
b= correlation * (standard deviation of y's/ standard deviation of x's)
b= r (s_y)/(s_x)
a= mean of y values * slope * mean of x values
a= ȳ-bx̄
LSRL always passes through point (x̄,ȳ)
b= correlation * (standard deviation of y's/ standard deviation of x's)
b= r (s_y)/(s_x)
a= mean of y values * slope * mean of x values
a= ȳ-bx̄
LSRL always passes through point (x̄,ȳ)
62
New cards
regression to the mean
in a LSRL, ŷ is going to be closer to ȳ than x is to x̄, except for when r = 1 or -1 . . . ŷ is r*(s_y) above ȳ, whereas x is just 1(s_x) above x̄
63
New cards
standardizing regressions
(x̄,ȳ) becomes (0,0), s_x = s_y = 1, and b=r (slope is equal to the correlation), because b= r (s_y)/(s_x), b= r (1/1) . . .
64
New cards
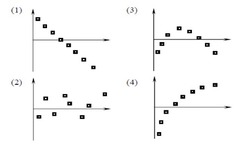
describing scatterplots
form (linear, non-linear (curved, etc.))
direction (positive, negative, none)
strength (strong, moderately-strong, moderate, moderately-weak, weak)
outliers (possible outliers, one @ (x,y), etc.)
context (Ex: actual and guessed ages . . .)
direction (positive, negative, none)
strength (strong, moderately-strong, moderate, moderately-weak, weak)
outliers (possible outliers, one @ (x,y), etc.)
context (Ex: actual and guessed ages . . .)
