Stats Chapter 1
0.0(0)
Studied by 5 peopleCard Sorting
1/34
Earn XP
Description and Tags
Last updated 1:18 AM on 8/26/23
Name | Mastery | Learn | Test | Matching | Spaced | Call with Kai | Chat |
|---|
No analytics yet
Send a link to your students to track their progress
35 Terms
1
New cards
A study was done to determine the age, number of times per week, and the duration (amount of time) of residents using a local park in Toronto. The first house in the neighborhood around the park was selected randomly and then every eighth house in the neighborhood around the park was interviewed. The sampling method was:
systematic
stratified
cluster
simple random
systematic
stratified
cluster
simple random
systematic
2
New cards
The heights of everyone in the class
\
Qualitative
Quantitative, Discrete
Quantitative, Continuous
\
Qualitative
Quantitative, Discrete
Quantitative, Continuous
Quantitative, Continuous
3
New cards
The number of books you own
\
Qualitative
Quantitative, Discrete
Quantitative, Continuous
\
Qualitative
Quantitative, Discrete
Quantitative, Continuous
Quantitative, Discrete
4
New cards
The type of phone you own
\
Qualitative
Quantitative, Discrete
Quantitative, Continuous
\
Qualitative
Quantitative, Discrete
Quantitative, Continuous
Qualitative
5
New cards
The distance from your home to school
\
Qualitative
Quantitative, Discrete
Quantitative, Continuous
\
Qualitative
Quantitative, Discrete
Quantitative, Continuous
Quantitative, Continuous
6
New cards
The number of courses you have gotten A's in
\
Qualitative
Quantitative, Discrete
Quantitative, Continuous
\
Qualitative
Quantitative, Discrete
Quantitative, Continuous
Quantitative, Discrete
7
New cards
The number of years that the average temperature was above 25 degrees
\
Qualitative
Quantitative, Discrete
Quantitative, Continuous
\
Qualitative
Quantitative, Discrete
Quantitative, Continuous
Quantitative, Discrete
8
New cards
The city you were born in
\
Qualitative
Quantitative, Discrete
Quantitative, Continuous
\
Qualitative
Quantitative, Discrete
Quantitative, Continuous
Qualitative
9
New cards
"Number of times per week" is what type of data?
\
quantitative, discrete
qualitative, continuous
quantitative, continuous
qualitative, discrete
\
quantitative, discrete
qualitative, continuous
quantitative, continuous
qualitative, discrete
Quantitative, Discrete
10
New cards
Which one of the following variables is not qualitative?
\
Age of a person
Gender of a person
Choice of true or false on a test
marital status of a person
\
Age of a person
Gender of a person
Choice of true or false on a test
marital status of a person
Age of a person
11
New cards
A study was done to compare the lung capacity of coal miners to the lung capacity of farm workers. The researcher studied 200 workers of each type. Other factors that might affect lung capacity are smoking habits and exercise habits. The smoking habits of the two worker types are similar, but the coal miners generally exercise less than the farm workers.
Which of the following might interfere with the results of the study? (called the confounding variable)
\
occupation
lung capacity
exercise
smoking or not
Which of the following might interfere with the results of the study? (called the confounding variable)
\
occupation
lung capacity
exercise
smoking or not
exercise
12
New cards
A study was done to compare the lung capacity of coal miners to the lung capacity of farm workers. The researcher studied 200 workers of each type. Other factors that might affect lung capacity are smoking habits and exercise habits. The smoking habits of the two worker types are similar, but the coal miners generally exercise less than the farm workers.
Which of the following is the sample in this study?
\
all coal miners
all farm workers
all coal miners and farm workers
200 coal miners and 200 farm workers
Which of the following is the sample in this study?
\
all coal miners
all farm workers
all coal miners and farm workers
200 coal miners and 200 farm workers
200 coal miners and 200 farm workers
13
New cards
A study was done to compare the lung capacity of coal miners to the lung capacity of farm workers. The researcher studied 200 workers of each type. Other factors that might affect lung capacity are smoking habits and exercise habits. The smoking habits of the two worker types are similar, but the coal miners generally exercise less than the farm workers.
Which of the following is a response variable in this study?
\
exercise
smoking or not
lung capacity
occupation
Which of the following is a response variable in this study?
\
exercise
smoking or not
lung capacity
occupation
lung capacity
14
New cards
A study was done to compare the lung capacity of coal miners to the lung capacity of farm workers. The researcher studied 200 workers of each type. Other factors that might affect lung capacity are smoking habits and exercise habits. The smoking habits of the two worker types are similar, but the coal miners generally exercise less than the farm workers.
Which of the following is the population in this study?
\
all coal miners
all farm workers
200 coal miners and 200 farm workers
all coal miners and farm workers
Which of the following is the population in this study?
\
all coal miners
all farm workers
200 coal miners and 200 farm workers
all coal miners and farm workers
all coal miners and farm workers
15
New cards
A study was done to compare the lung capacity of coal miners to the lung capacity of farm workers. The researcher studied 200 workers of each type. Other factors that might affect lung capacity are smoking habits and exercise habits. The smoking habits of the two worker types are similar, but the coal miners generally exercise less than the farm workers.
Which of the following is the explanatory variable in this study?
\
occupation
smoking or not
lung capacity
exercise
Which of the following is the explanatory variable in this study?
\
occupation
smoking or not
lung capacity
exercise
occupation
16
New cards
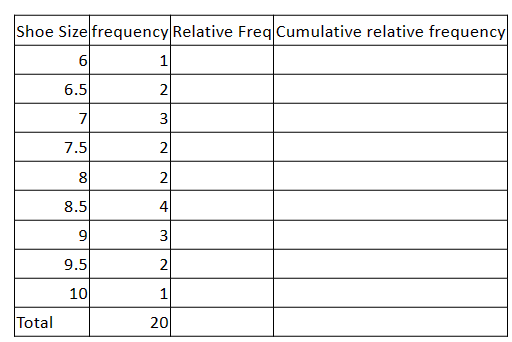
The shoe size was determined for all female students in a class.
What proportion of the students have size 8 or 8.5 shoe size?
Question 7 options:
0\.85
0\.7
0\.3
1\.2
What proportion of the students have size 8 or 8.5 shoe size?
Question 7 options:
0\.85
0\.7
0\.3
1\.2
0\.3
17
New cards
The sum of relative frequencies will always be
Question 8 options:
1
different depending on the data
the total number of outcomes
between 0 and 1
Question 8 options:
1
different depending on the data
the total number of outcomes
between 0 and 1
1
18
New cards
The sum of frequencies will always be
Question 6 options:
between 0 and 1
different depending on the data
1
the total number of outcomes
Question 6 options:
between 0 and 1
different depending on the data
1
the total number of outcomes
the total number of outcomes
19
New cards
The relative frequency is computed by
Question 5 options:
dividing the frequency by the midpoint
dividing the midpoint by the sample size
dividing the sample size by the frequency
dividing the frequency by the sample size
Question 5 options:
dividing the frequency by the midpoint
dividing the midpoint by the sample size
dividing the sample size by the frequency
dividing the frequency by the sample size
dividing the frequency by the sample size
20
New cards

The shoe size was determined for all female students in a class.
What proportion of the students have size 8 or more shoe size?
Question 4 options:
0\.5
1
0\.6
0\.7
What proportion of the students have size 8 or more shoe size?
Question 4 options:
0\.5
1
0\.6
0\.7
0\.6
21
New cards

The shoe size was determined for all female students in a class.
What proportion of the students have size 8 or less shoe size?
Question 3 options:
0\.1
0\.5
1\.2
0\.7
What proportion of the students have size 8 or less shoe size?
Question 3 options:
0\.1
0\.5
1\.2
0\.7
0\.5
22
New cards

The shoe size was determined for all female students in a class.
What proportion of the students have size 11 shoe size?
Question 1 options:
can't answer
1
0
0\.95
What proportion of the students have size 11 shoe size?
Question 1 options:
can't answer
1
0
0\.95
0
23
New cards
A cumulative relative frequency distribution shows
Question 2 options:
the total of the relative frequencies before the current row
the total of the relative frequencies before and including the current row
the total of the relative frequencies after the current row
Question 2 options:
the total of the relative frequencies before the current row
the total of the relative frequencies before and including the current row
the total of the relative frequencies after the current row
the total of the relative frequencies before and including the current row
24
New cards
All samples lead to a good prediction about an entire population.
False
25
New cards
To find out what the preferred juice is, wait outside the cafeteria and ask every 4th person leaving to name their favourite flavour until you get 25 responses is an example of...
Simple Random Sampling
Convenience Sampling
Systematic Sample
Stratified Random Sample
Simple Random Sampling
Convenience Sampling
Systematic Sample
Stratified Random Sample
Systematic Sample
26
New cards
To study the amount of time students spend doing homework each day, use a random number generator to select 25 students from the student enrollment database to survey.
Convenience Sampling
Systematic Sample
Simple Random Sampling
Stratified Random Sample
Convenience Sampling
Systematic Sample
Simple Random Sampling
Stratified Random Sample
Simple Random Sampling
27
New cards
To determine the average number of students who study at the library, the first 25 students who arrive to the library are asked their if they study there. This is a good representative sample?
False
28
New cards
To study the amount of time students spend doing homework each day, Randomly select 4 classrooms and survey everyone in those rooms.
Simple Random Sampling
Cluster Sampling
Stratified Random Sample
Systematic Sample
Simple Random Sampling
Cluster Sampling
Stratified Random Sample
Systematic Sample
Cluster Sampling
29
New cards
A Sample of 100 undergrad San Jose State students is taken by organizing the students names by classification (freshmen, sophomore, junior and senior) and then selecting 25 students from each.
Stratified
30
New cards
A random number generator is used to select a student from the alphabetical listing of all undergrads students in the fall semester. Every 50th student is chosen until 75 students are included in the sample
Systemic
31
New cards
A completely random method is used to select 75 students. Each undergrad student in the fall semester has the same probability of being chosen at any stage of the sampling process.
Simple random
32
New cards
The freshmen, sophomore, junior, and senior years are numbered 1;2;3;4 respectively. A random number generator is used to pick 2 of those years/groups. All students in those two years are in the sample.
Cluster
33
New cards
An admin assistant is asked to stand in front of the library on Wednesday and ask the first 100 undergrad students he encounters what they paid for tuition the Fall semester. Those 100 are the sample.
Convenience
34
New cards
Two possible wordings for a questionnaire on gun control are as follow:
I. The United States has the highest rate of murder by handguns among all countries. Most of these murders are known to be crimes of passion or crimes provoked by anger between acquaintances. Are you in favor of a 7- day cooling-off period between the filing of an application to purchase a handgun and the resulting sale?
II. The United States has one of the highest violent crime rates among all countries. Many people want to keep handguns in their homes for self-protection. Are you in favor of a 7-day waiting period between the filing of an application to purchase a needed handgun and the resulting sale?
One of these questions showed that 25% of the population favored a 7-day waiting period between application for purchase of a handgun and the resulting sale, while the other question showed that 70% of the population favored the waiting period. Which produced which result and why?
Question 1 options:
The first question probably showed 25% and the second question 70% because of a placebo effect due to the wording of the questions.
The first question probably showed 70% and the second question 25% because of the lack of randomization in the choice of pro-gun and anti-gun subjects as evidenced by the wording of the questions.
The first question probably showed 25% and the second question 70% because of response bias due to the wording of the questions.
The first question probably showed 70% and the second question 25% because of the lack of a control group.
The first question probably showed 70% and the second question 25% because of response bias due to the wording of the questions.
The first question probably showed 70% and the second question 25% because of response bias due to the wording of the questions.
35
New cards
The CRA decides to audit 26 companies. The auditor lists all the companies that start with A, assigns each a number, and used a random number generator to pick one of the numbers and thus one company. The auditor does the same for all letters of the alphabet. Which of the following are true? **Select all that apply.**
Question 2 options:
This is an example of stratified sampling
Each company has an equal probability of being audited
This is a simple random sample
The procedure makes use of chance.
Question 2 options:
This is an example of stratified sampling
Each company has an equal probability of being audited
This is a simple random sample
The procedure makes use of chance.
This is an example of stratified sampling
The procedure makes use of chance.
The procedure makes use of chance.