Ch.5 Normal Distributions
0.0(0)
0.0(0)
Card Sorting
1/4
There's no tags or description
Looks like no tags are added yet.
Study Analytics
Name | Mastery | Learn | Test | Matching | Spaced |
|---|
No study sessions yet.
5 Terms
1
New cards
Density curve
describes the overall pattern for a continuous distribution
- always located above the X-axis
-area under the curve is exactly 1
-the median divides the area under the curve in half
2
New cards
Normal distribution curve
-continuous -symmetric -bell shaped - unimodal -doesn't touch the x-axis -total area under the curve is equal to 1
3
New cards
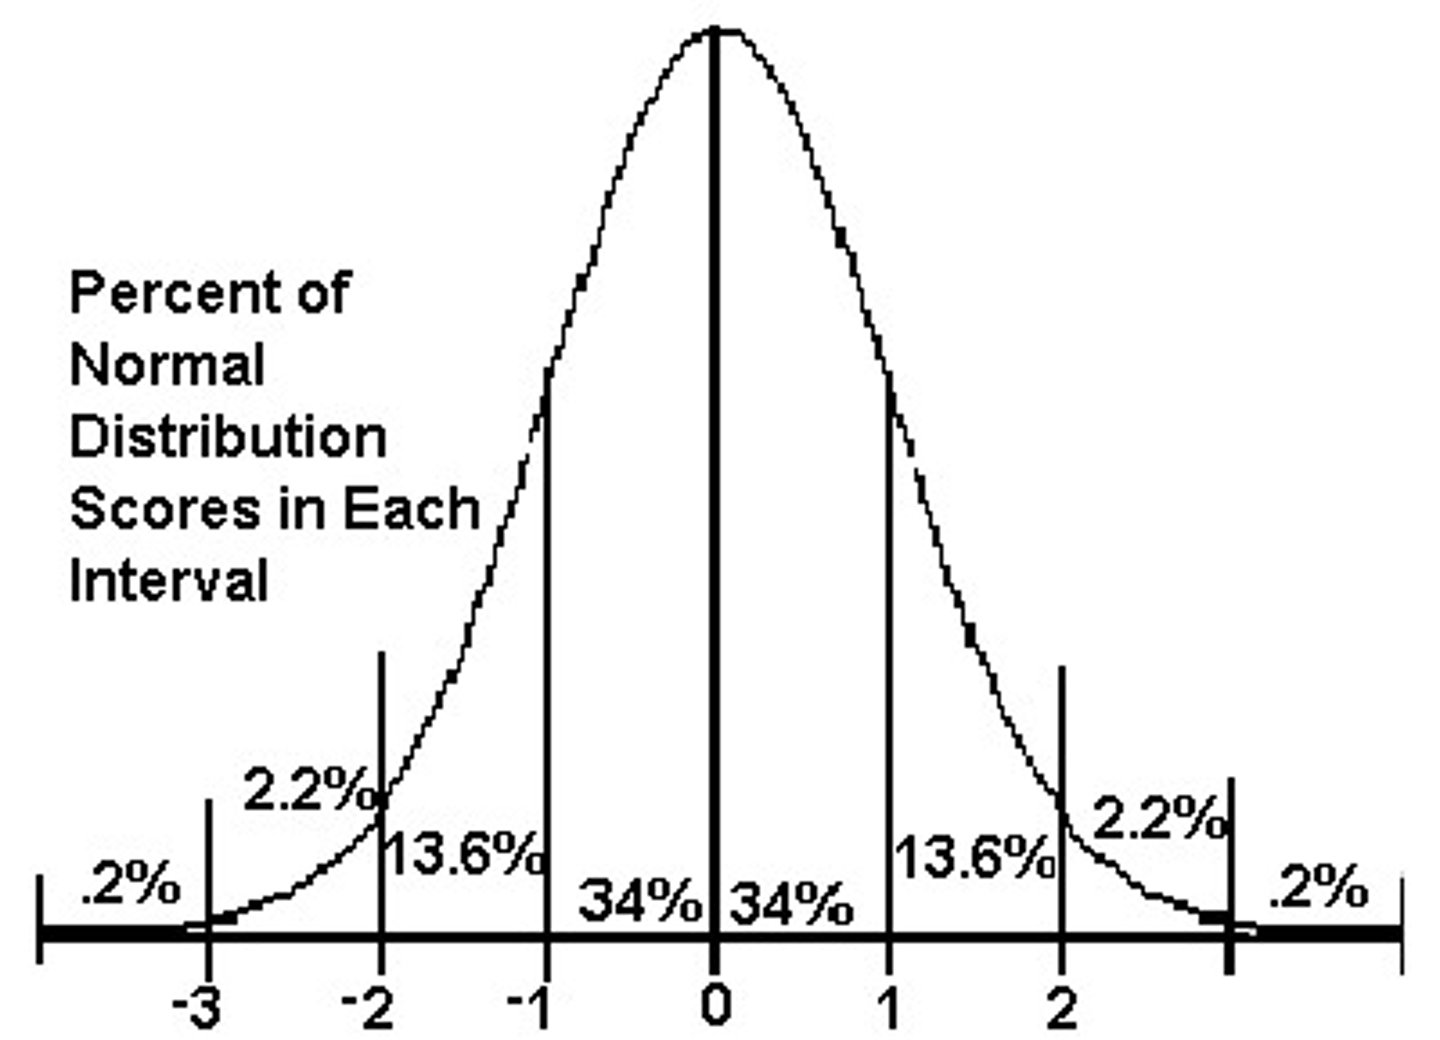
68% rule
For a normal distribution, 68% of the observations lie within 1 standard deviation of the mean
4
New cards
95% rule
for a normal distribution - 95% of observations lie within 2 standard deviations of the mean
5
New cards
99% rule
for a normal distribution - 99% of distributions lie within 3 standard deviations of the mean