HTHSCI 2S03 - Lecture: Descriptive Statistics & Intro to Probability
1/56
There's no tags or description
Looks like no tags are added yet.
Name | Mastery | Learn | Test | Matching | Spaced |
|---|
No study sessions yet.
57 Terms
Descriptive Statistics
Goal of Data Summarization
- To calculate one or two numbers that convey important information about the data (summarizes results in 1 or 2 numbers)
- Such numbers that are used to describe data are called descriptive measures
Statistic
A descriptive measure computed from a sample is called a statistic, common measures:
- Mean of a sample: x ̅
- Number of observation in a sample: n

Parameter
A descriptive measure computed from a population is called a parameter, common measures:
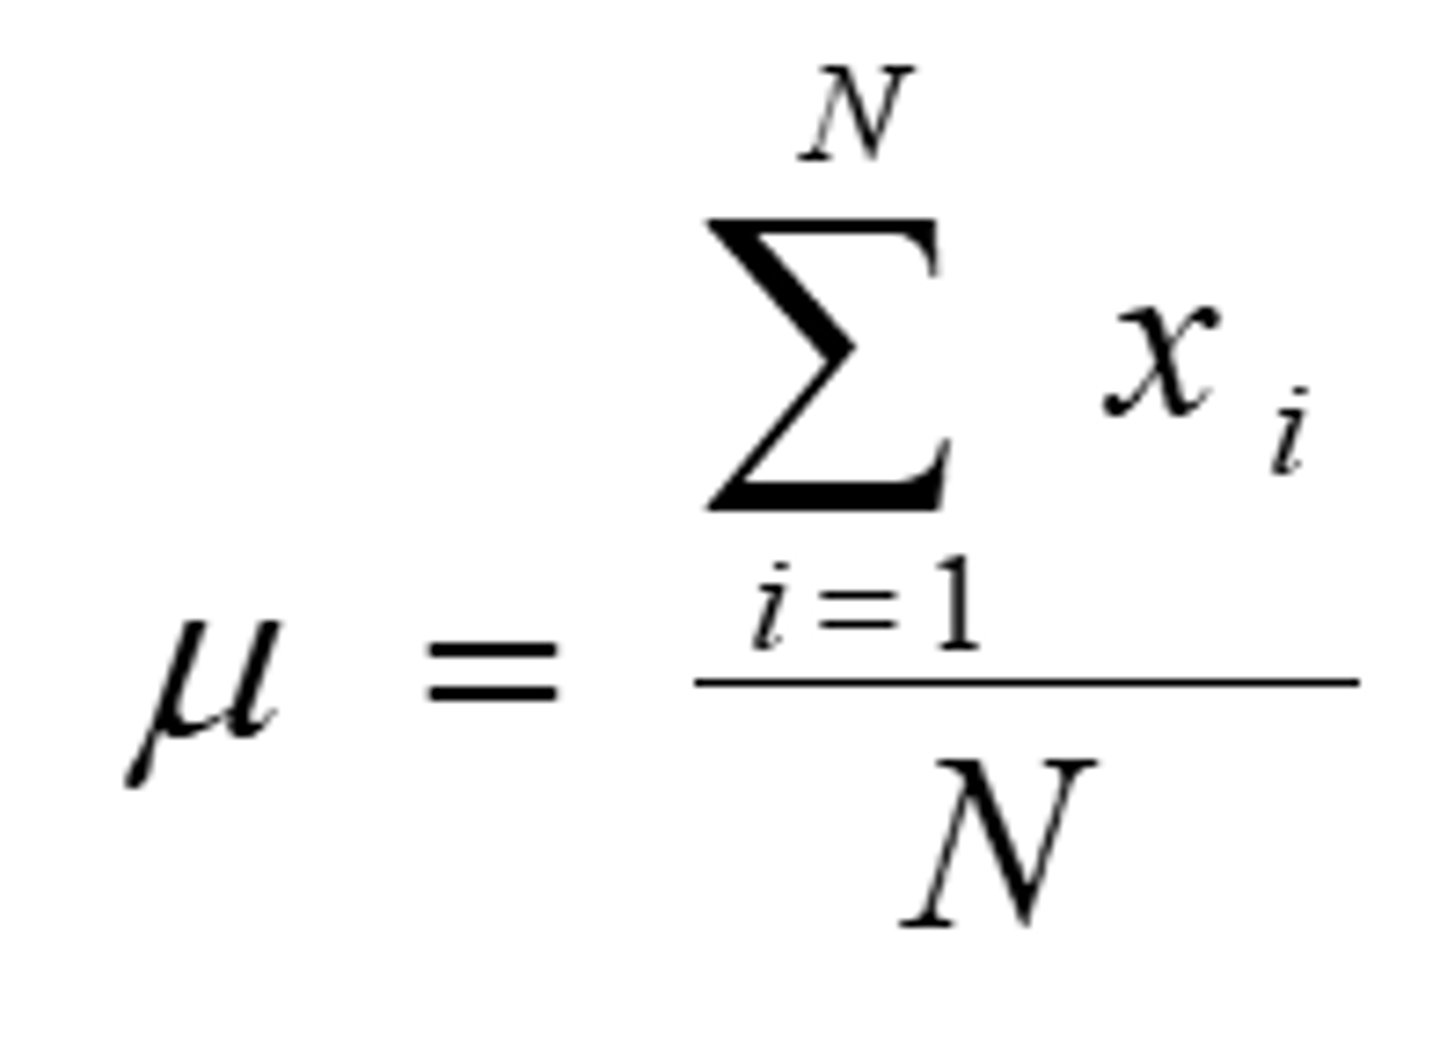
- Mean of a population: μ
- Number of observation in a population: N
Groups of Descriptive Measures
- Measures of central tendency
- Measures of dispersion
Measures of Central Tendency
- Convey information regarding the average value of a set of values; the “average” can be defined in different ways
- The three most commonly used measures of central tendency are the mean, the median, and the mode
Mean
- The sum of a set of numbers divided by the number of the numbers
Properties:
- Uniqueness (only 1 mean per data set)
- Simplicity
- Affected by extreme values (if their are large outliers, the mean may not be the best to use)
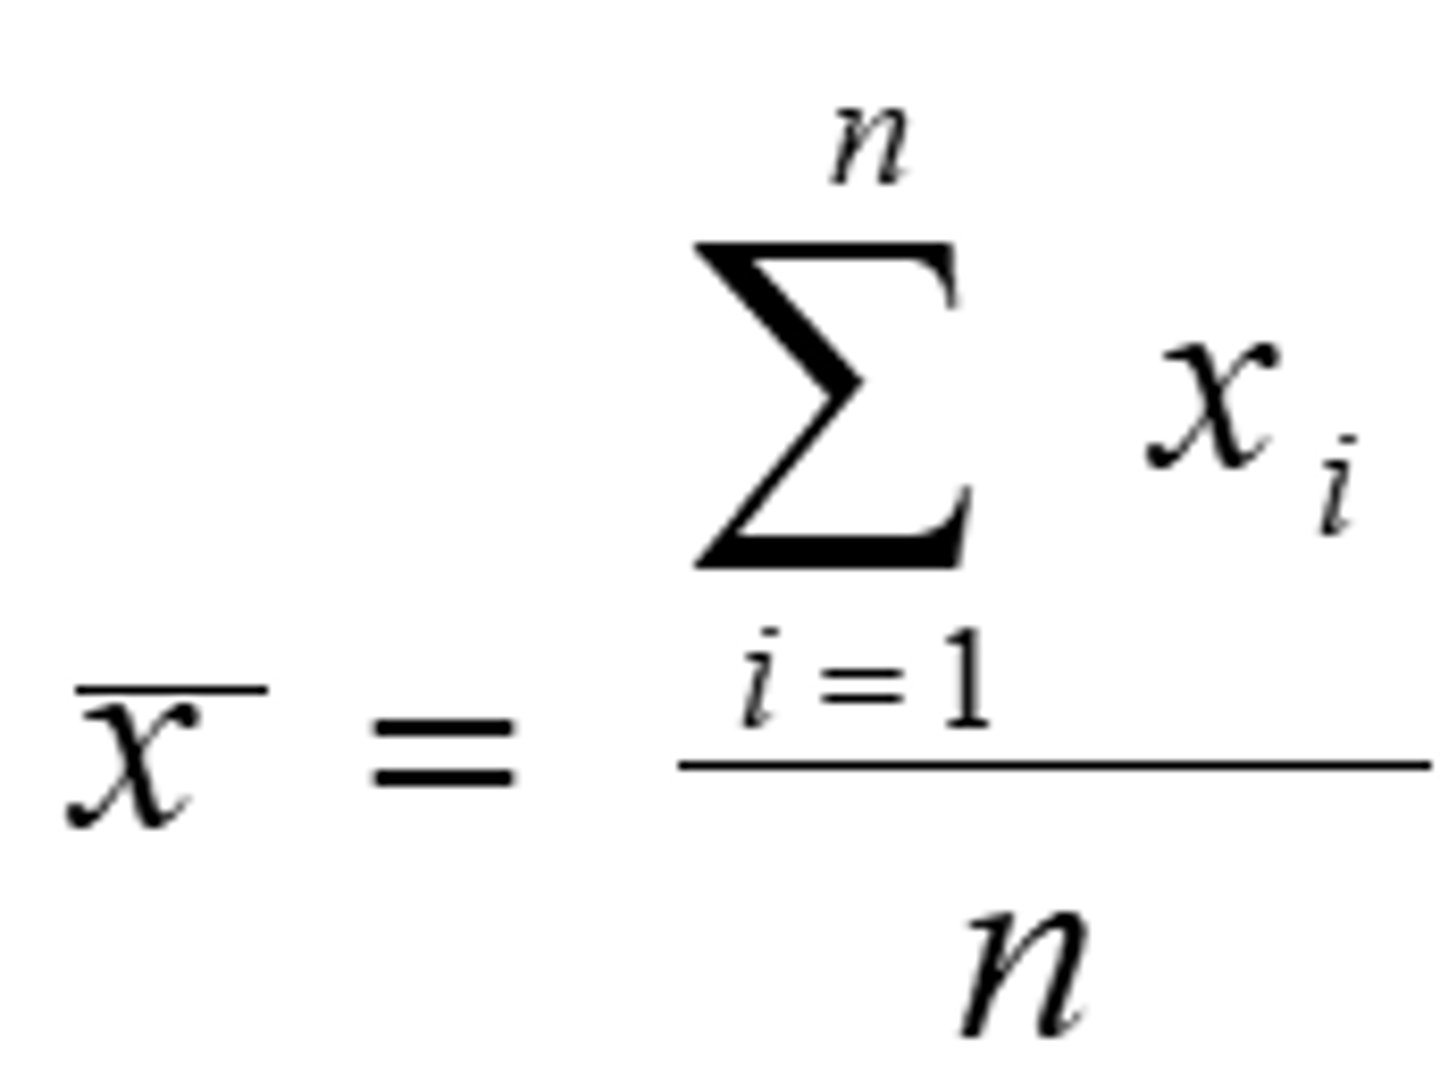
General Formula for Mean Sample
- If a random variable in the population is shown by X and a realization of it (an observation) from a sample is x, then to distinguish between the different observations we assign a subscript to each
Mean Sample Example
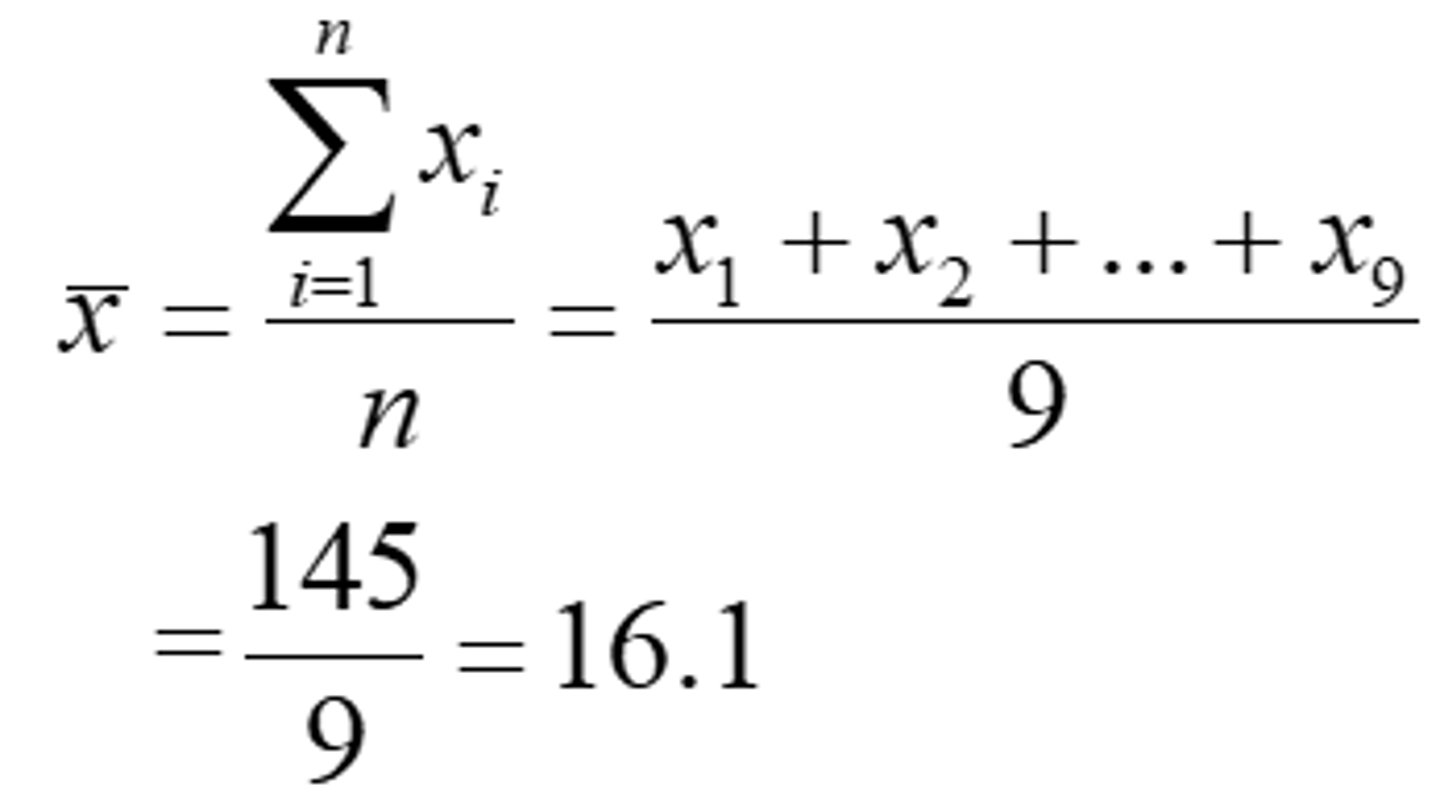
Ex. These data show the age of a sample of 9 patients with cystic fibrosis:
- 8, 19, 19, 20, 13, 8, 16, 19, 23
- x1 = 8, x2 = 19…x9 = 23
- Mean = (8+19+19+…+23)/9 = 145/9 = 16.1 years
General Formula for Mean Population
Mean Population Example
- Ex. Income for sample of 5 families: 20k, 25k, 22k, 23k, 200k → x ̅=58k
Median
- The median of a dataset divides the dataset into two equal parts such that the number of values equal to or greater than the median is equal to the number of values equal to or less than the median
- The median of a dataset is the (n+1)/2th observation when the observations have been ordered
Properties:
- Uniqueness
- Simplicity
- Not affected by the extreme values
Median Example - ODD Number of Observations
Ex. Age = 8, 8, 13, 16, 19, 19, 19, 20, 23
median = (9+1)/2th observation
= 10/2 = 5th observation
= 19
Ex. Income for 5 families: 20k, 25k, 22k, 23k, 200k
median = (5+1)/2th observation = 3rd observation = 23k
Median Example - EVEN Number of Observations
Ex. Age= 8, 8, 13, 16, 19, 19, 19, 20, 23, 25
median = (10+1)/2th observation
= 11/2 = 5.5th observation
= (19+19)/2 = 19 (calculate both mean numbers - only use whole values)
Mode
- The mode of a set of values is the value that occurs most frequently
- A set of values may have no mode, one mode, or more than one mode
Mode Examples

Mean vs. Median vs. Mode
Mean & Median:
- Continuous variables
- Quantitative data
Mode:
- Categorical variables
Measures of Dispersion
- A measure of dispersion conveys information regarding the amount of variability present in a set of data.
- There will be no dispersion if all the values are the same.
Ex. 3 Datasets with mean = 15:
- 15, 15, 15, 15, 15
- 13, 14, 15, 16, 17
- 10, 12, 15, 18, 20
Mean = 15 for all
Range
- The difference between the largest and the smallest value in a set of observations
- xL = Max value
- xs = mean value
- Only 2 numbers that are contributing to the range (do not know what is happening in the middle of the graph)

Range Example
For the values of 2, 5, 8, 4, 20, 13, 20 the range is:
R = xL - xS = 20 - 2 = 18
Percentile
- Given a set of observations x1, x2,…, xn, the pth percentile is the value such that p percent or less of the observations are less than P and (100-p) percent or less are greater than P
Quartile
- The first quartile (Q1) = the 25th percentile
- The 2nd (middle) quartile (Q2) = the 50th percentile (the median)
- The third quartile (Q3) = the 75th percentile
*The quartiles can also be defined as (n is the number of observations)

Interquartile Range (IQR)
- The difference between first and third quartiles that comprises the middle 50% of the data
- IQR = Q3 - Q1
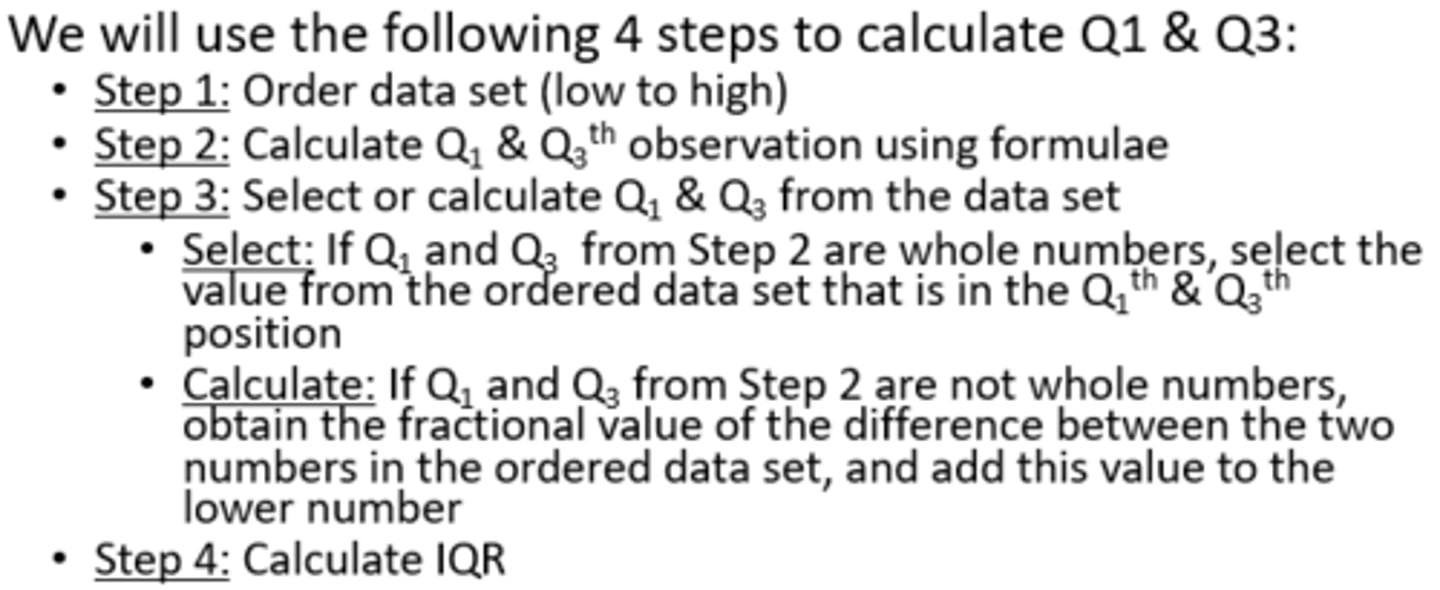
- There is one universal way to calculate the median (Q2), but various methods are used to calculate Q1 and Q3 (thus IQR)
Interquartile Range Equation Example
For the seven values of 2, 5, 8, 4, 20, 13, 20 (n=7) the quartiles are:
2, 4, 5, 8, 13, 20, 20 (ordered values)
Q1 = 4, Q2 = 8, Q3 = 20
IQR = Q3 - Q1 = 16
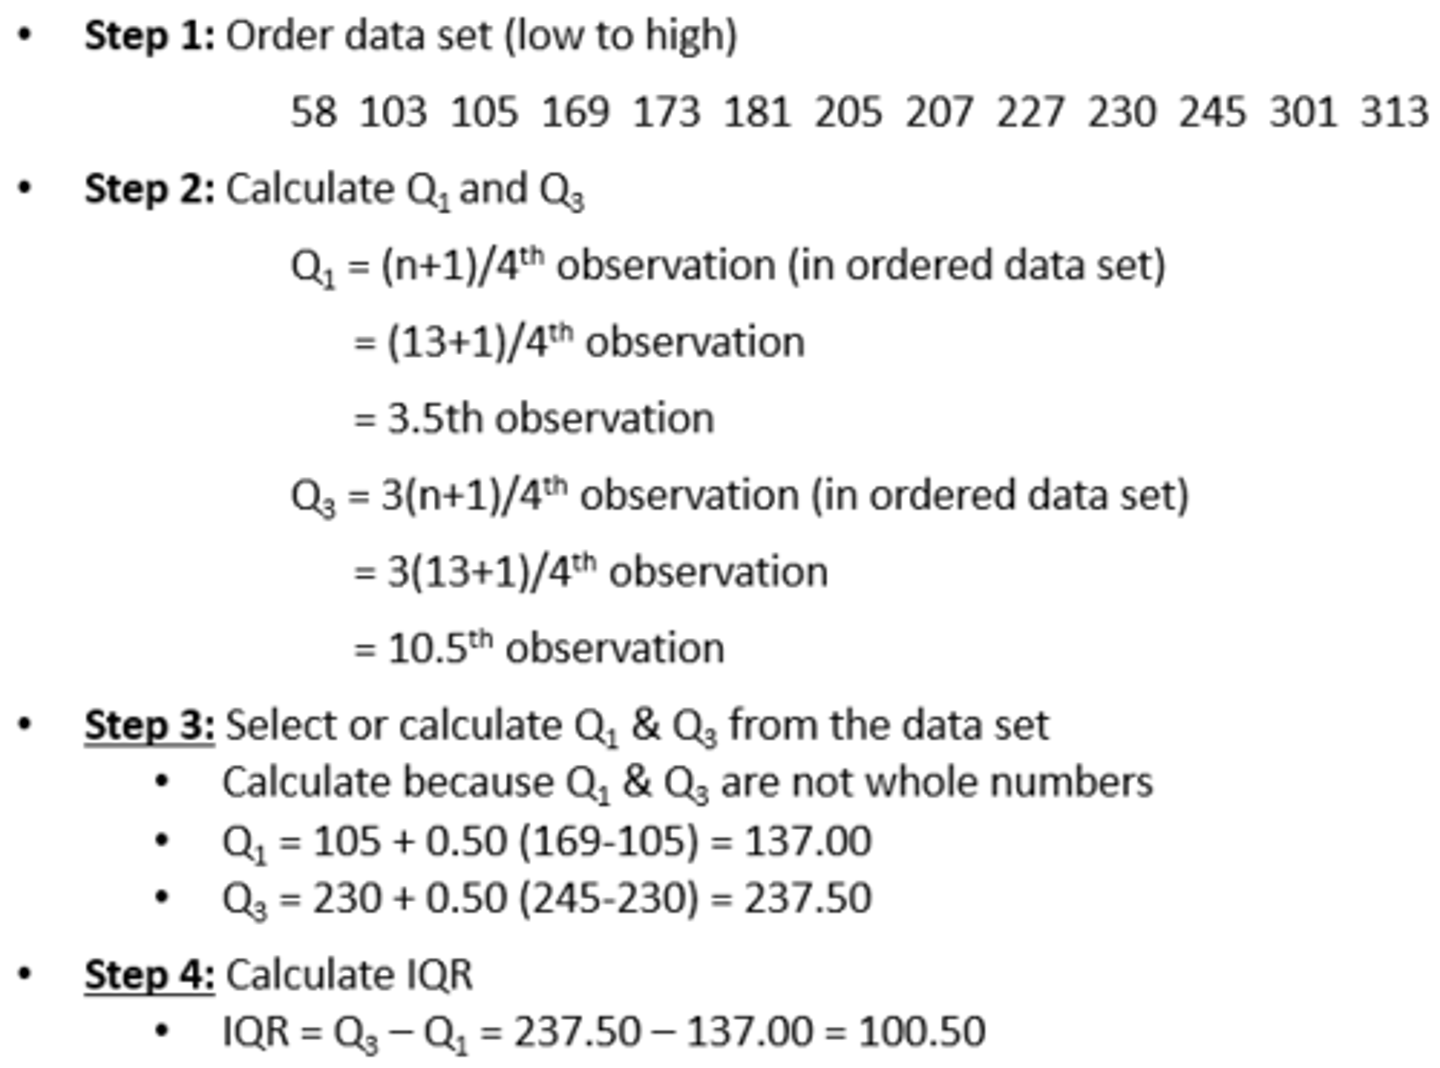
Steps of Interquartile Range
Interquartile Range Example
CD4 cell counts (x 10^6/L) in 13 HIV-positive patients:
230 205 313 207 227 245 173 58 103 181 105 301 169
Ordered = 58 103 105 169 173 181 205 207 227 230 245 301 313
*0.5 represented by 3.5th observation (use decimal value - changes)
Skewness
- Data distributions may be classified on the basis of whether they are symmetric or asymmetric
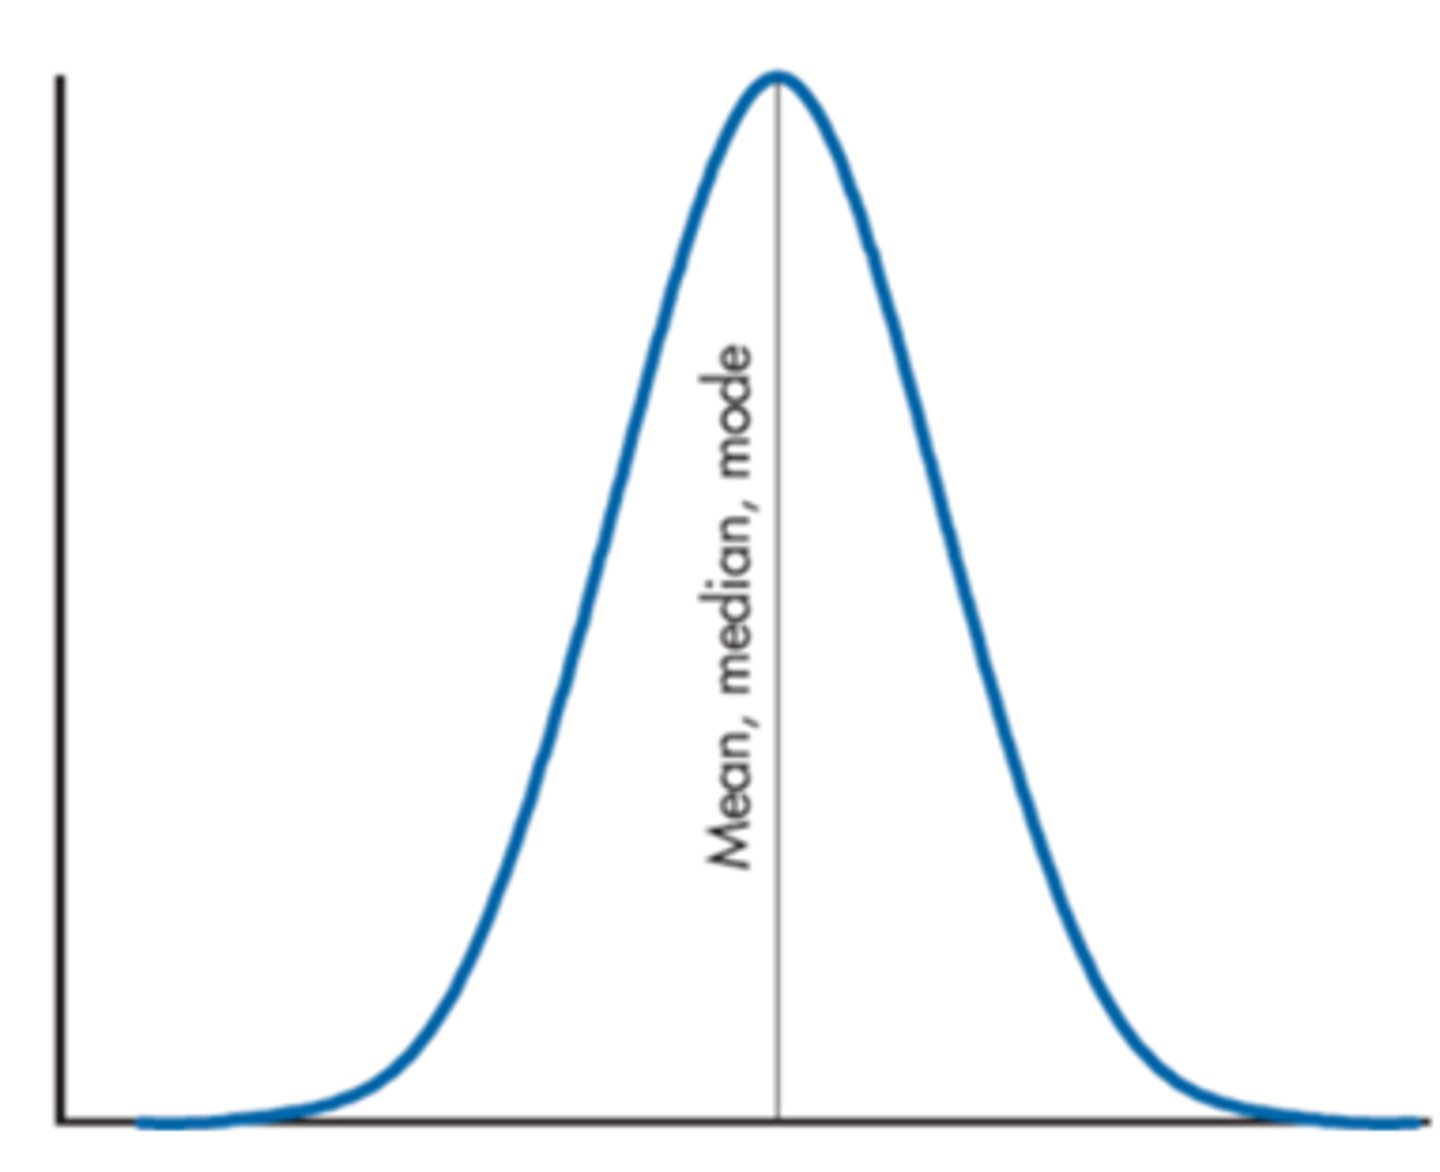
- If a distribution is symmetric, the left half of the graph (histogram or frequency polygon) will be the mirror image of its right half
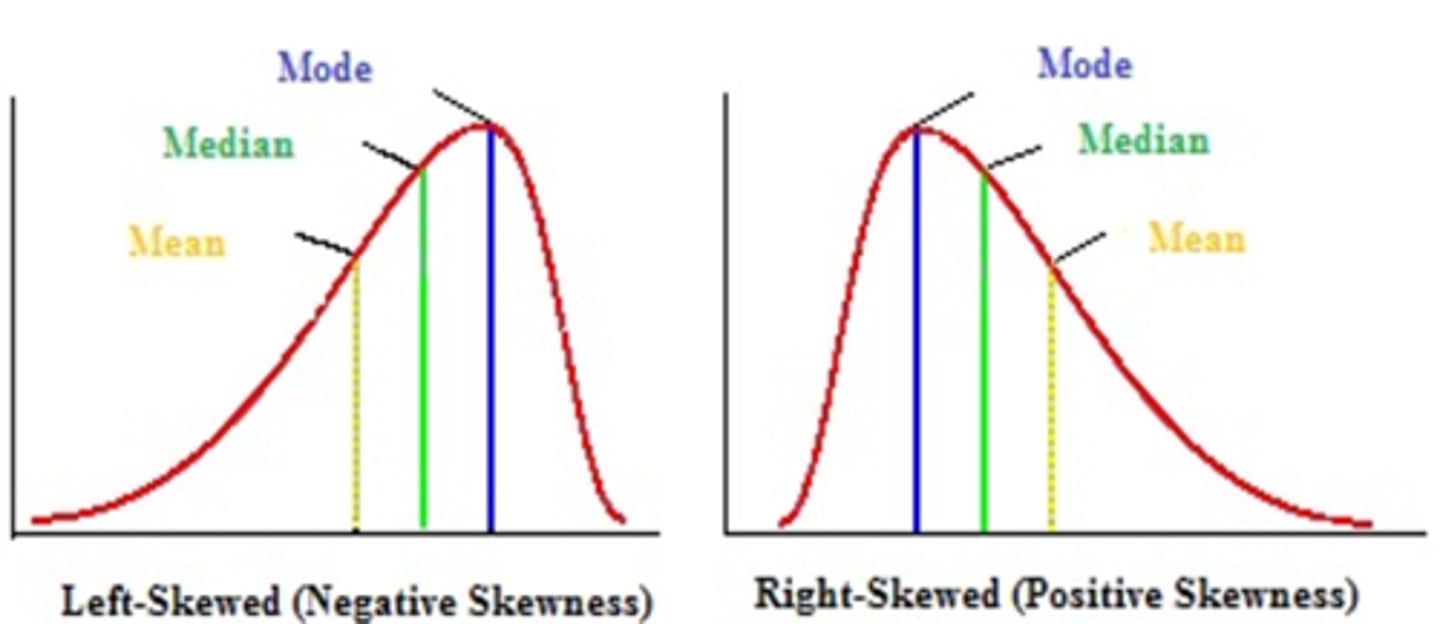
- Otherwise, the distribution is asymmetric
Symmetrical Distribution
Skewed Distributions
*Further they are from each other = More skewed
Variance
- Measures the amount of variability or spread around the mean
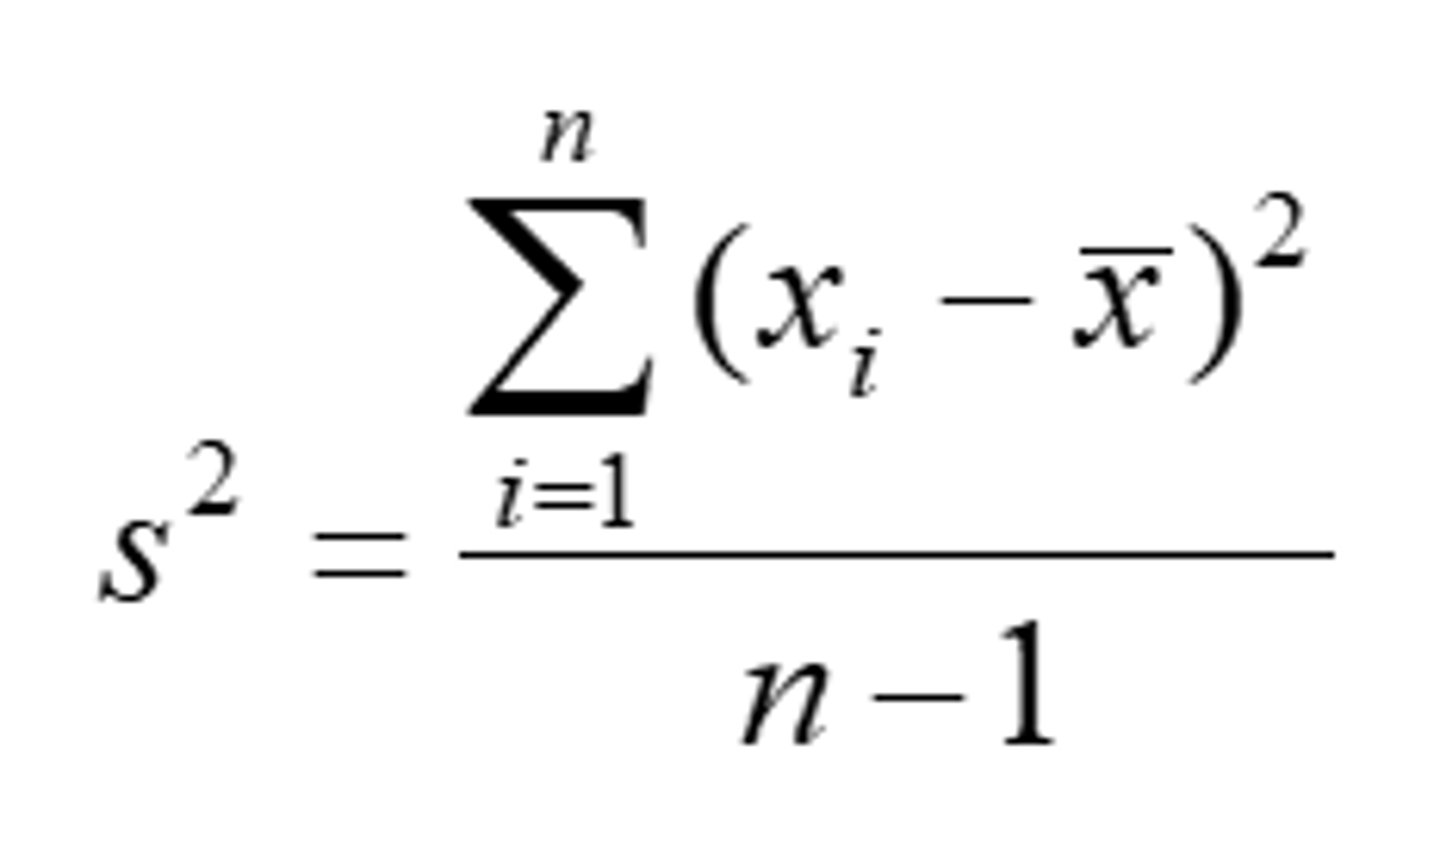
Variance - Sample
- The sum of the squared deviations of the values from their mean divided by the sample size minus one
- Unit = -^squared
i
- Continuing # for # of values in the data set
Variance - Sample Example
- For the sample of 2, 5, 8, 4, 20, 13, 20 (n=7):

Variance - Population
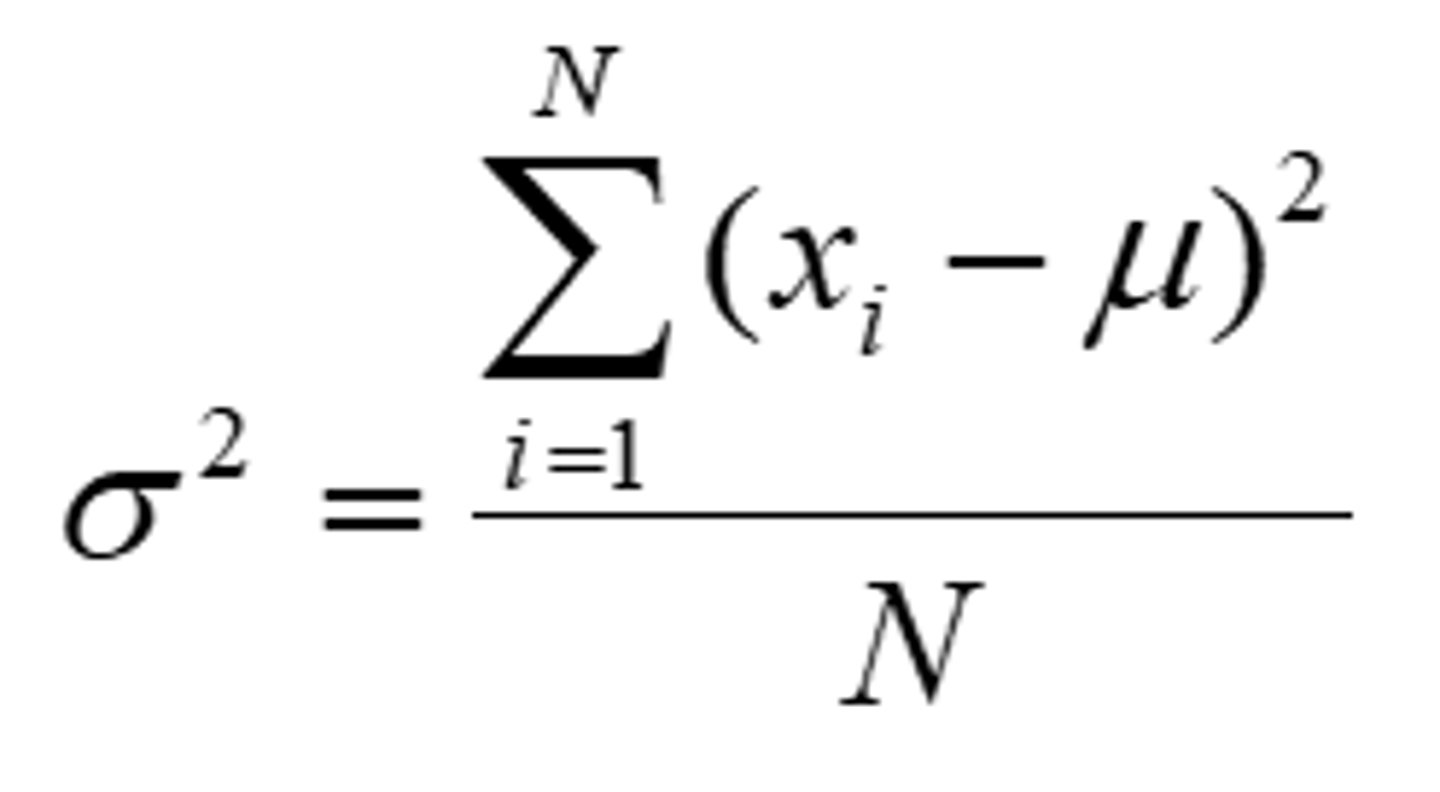
Standard Deviation
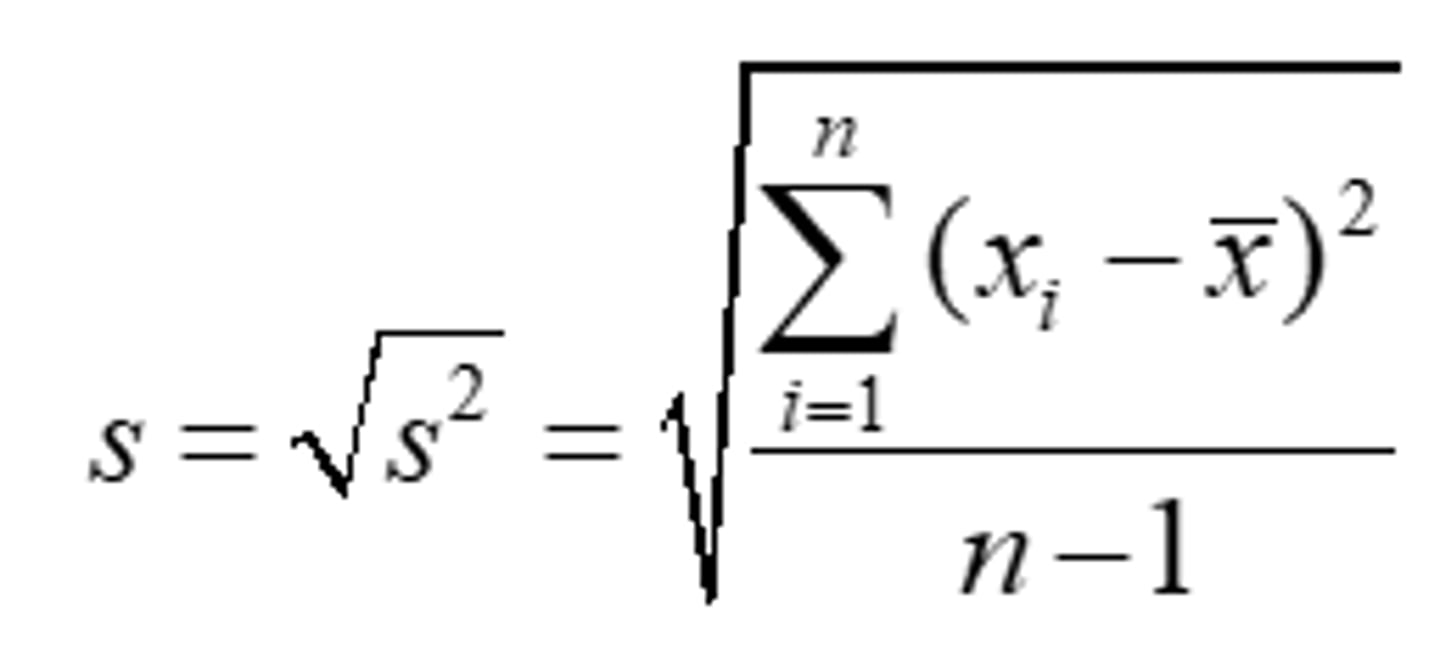
- The variance represents dispersion based on the squared measure of the original units (how far values are from the mean value)
- Standard deviation (s or SD) represents the variation based on the original units of the variable
Median - ODD Number of Observations
•Example 1, age = 8, 8, 13, 16, 19, 19, 19, 20, 23
median = (9+1)/2th observation
= 10/2 = 5th observation
= 19
A measure of central tendency tells us, using a single value, the best representation of the entire data set.
A measure of dispersion tells us:
a) If the highest and lowest values cancel each other out
b) If the mean is greater than the mode
c) How well the measure of central tendency represents the entire data set
d) Whether or not to compute percentiles
Answer = c
Introduction to Probability
Probability
- The formal way of measuring uncertainty of an event
- It provides a precise measurement of the likelihood that an event will occur
- Critical to understanding healthcare research results
- The likelihood of an event in the sample space
- Likelihood of an event happening
- Event = Any possible outcome of a sample space
Probability in Healthcare Research
- Premature births in a hospital
- Smoking status of clients with type II diabetes
- Achievement of weight loss goal by clients enrolled in a fitness program
- Cardiac events in clients with untreated hypertension
Cross-Tabulation Tables - Probability
- Marginal, joint, conditional probabilities
p-Values - Probability
- Central to inferential statistics, refers to probability of getting a result by chance alone
Probability Categories
- Empirical (or Relative) Probability
- Theoretical (or Classical) Probability
Empirical (or Relative) Probability
- Likelihood of events inferred by collecting data
- Ex. Collect data on cardiac events for clients with and without diabetes, collect data on smoking status of people with different education levels
Theoretical (or Classical) Probability
- Likelihood of events inferred without collecting data
- Ex. Flipping coins, rolling dice, using probability distributions (ex. Binomial, Poisson, Normal)
- The foundation of statistical inference
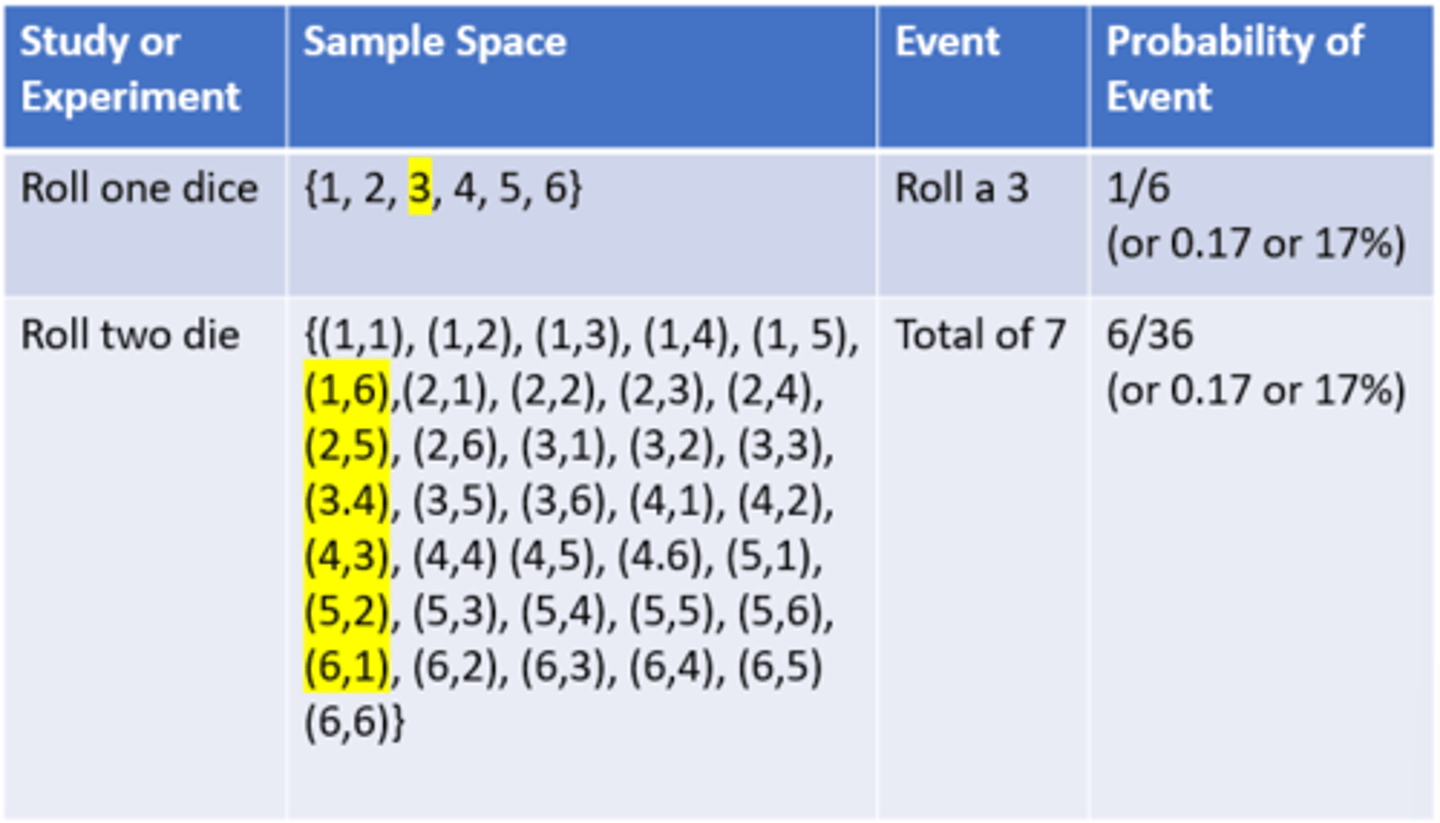
Sample Space
- The set of all possible results or outcomes of a study
- Ex. Dice: 1, 2, 3, 4, 5, 6
Theoretical Probability Example
Properties of Probability
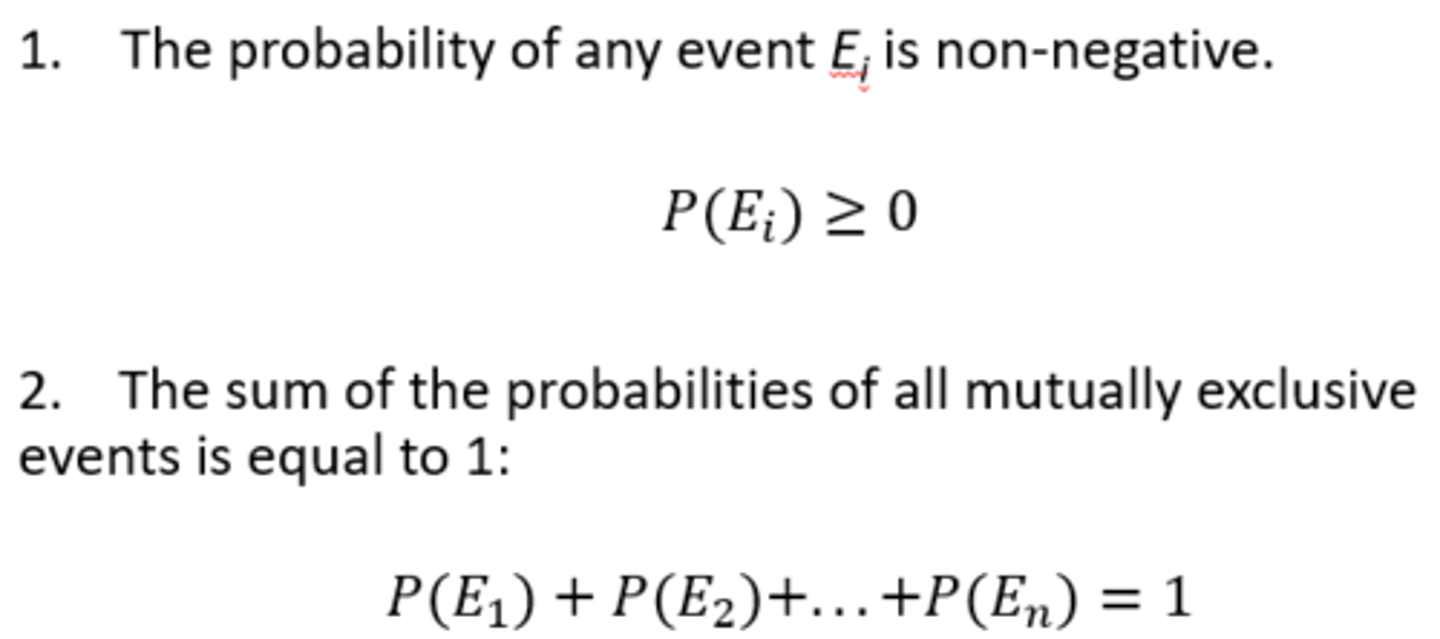
Given a study (or experiment) with n mutually exclusive (events can not happen together) events of E1, E2, …, En
*Probability always between 0 & 1
Marginal Probability
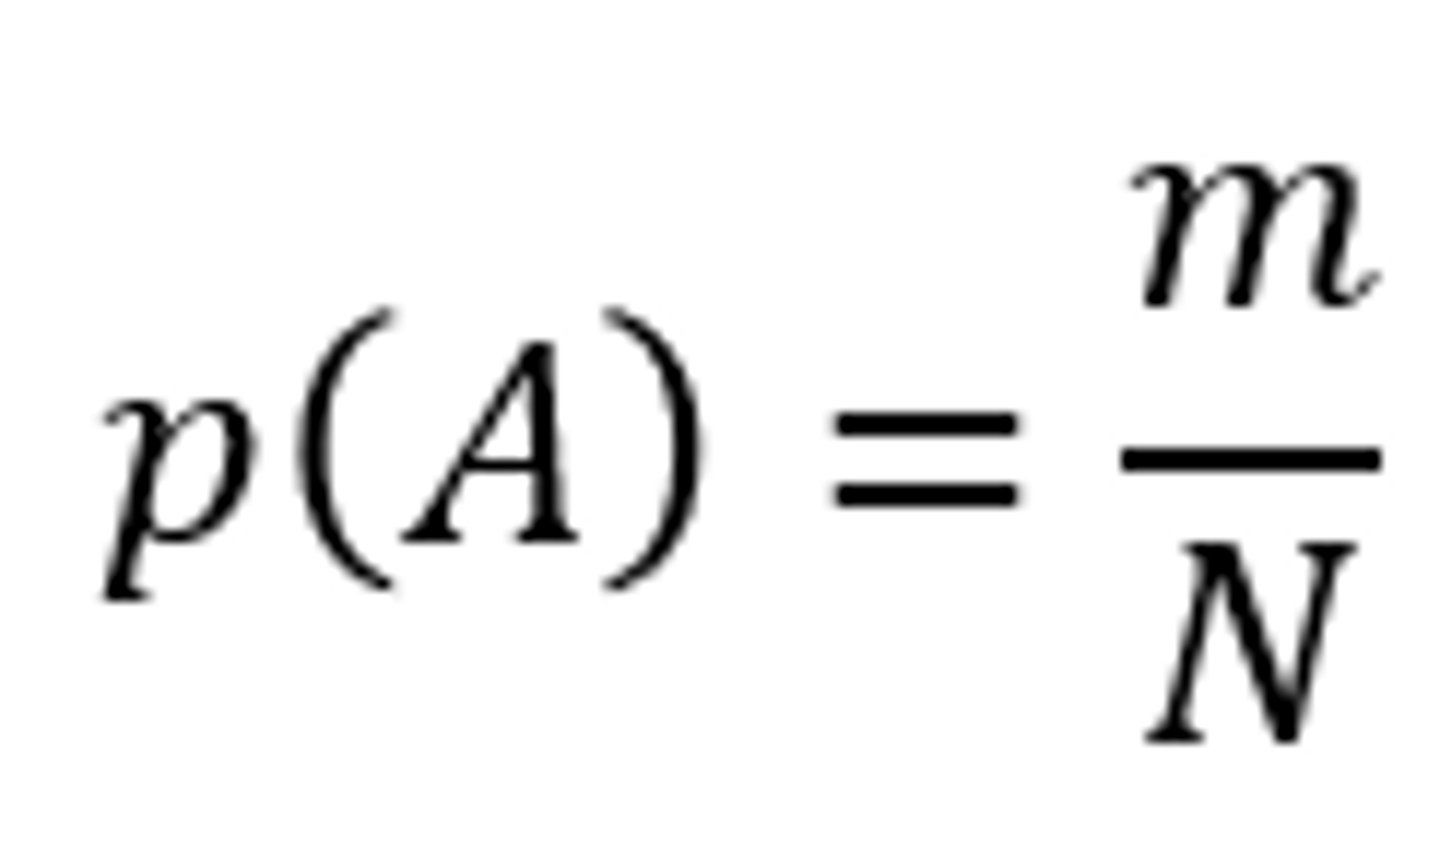
- p(A) is the marginal probability that event A will occur
- Using relative frequency probability, p(A) is calculated by taking the number of times the event occurred (m) and dividing it by the total number of trials (N)
Marginal Probability Example
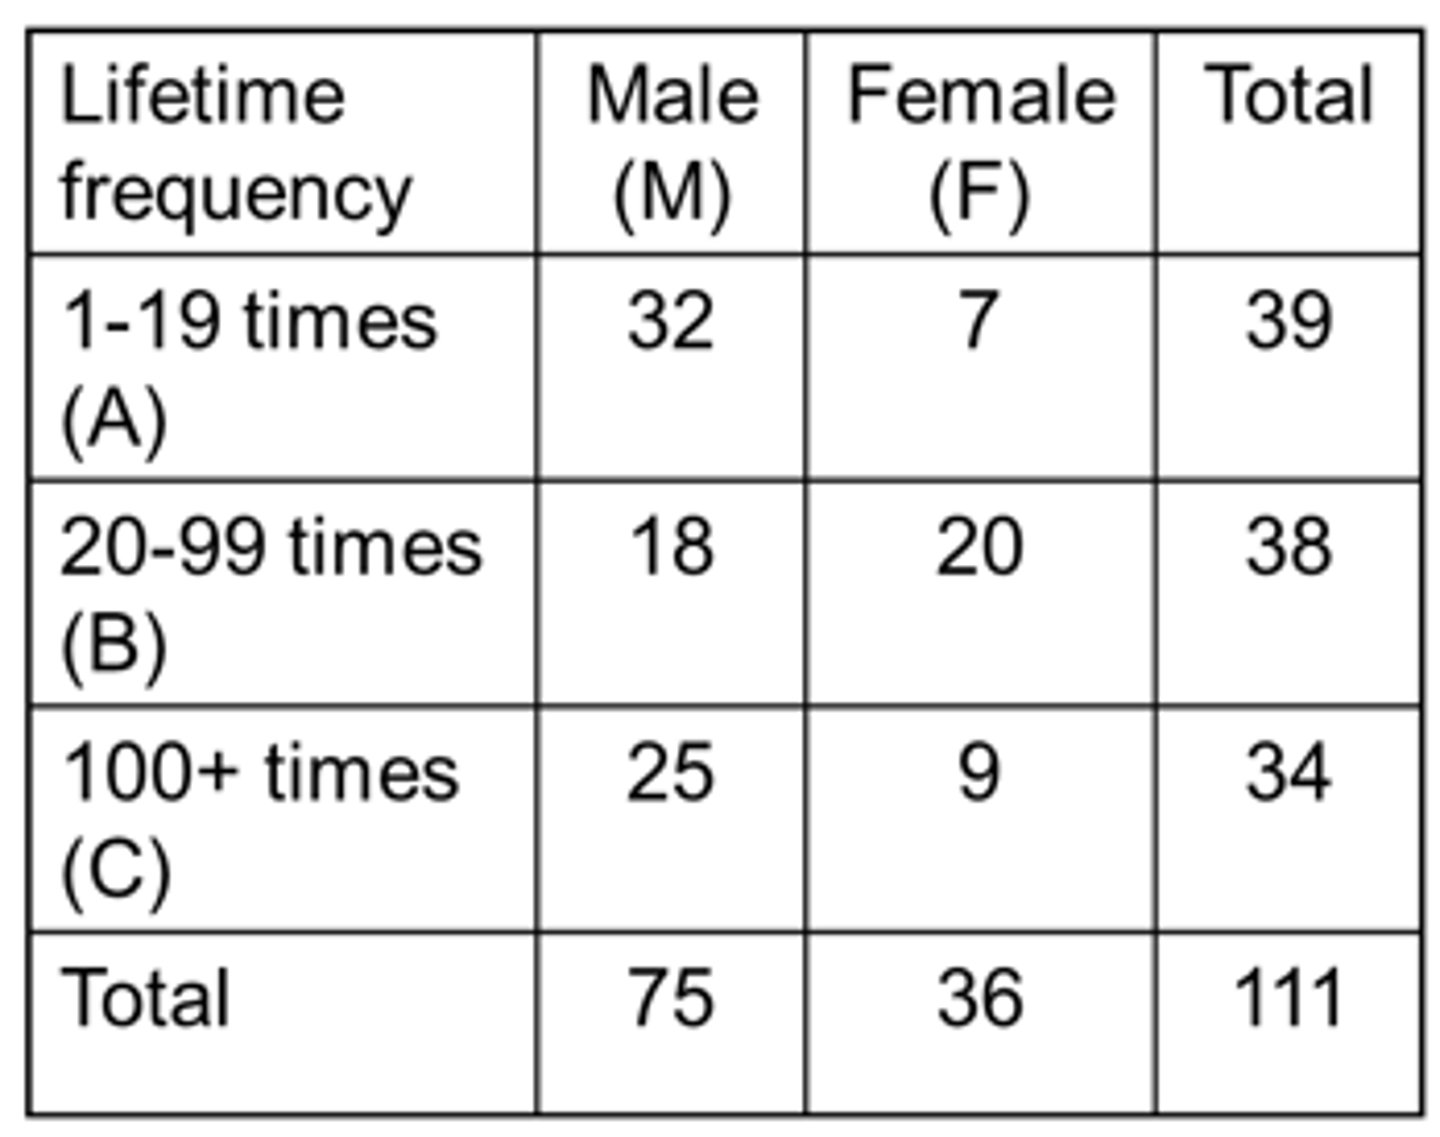
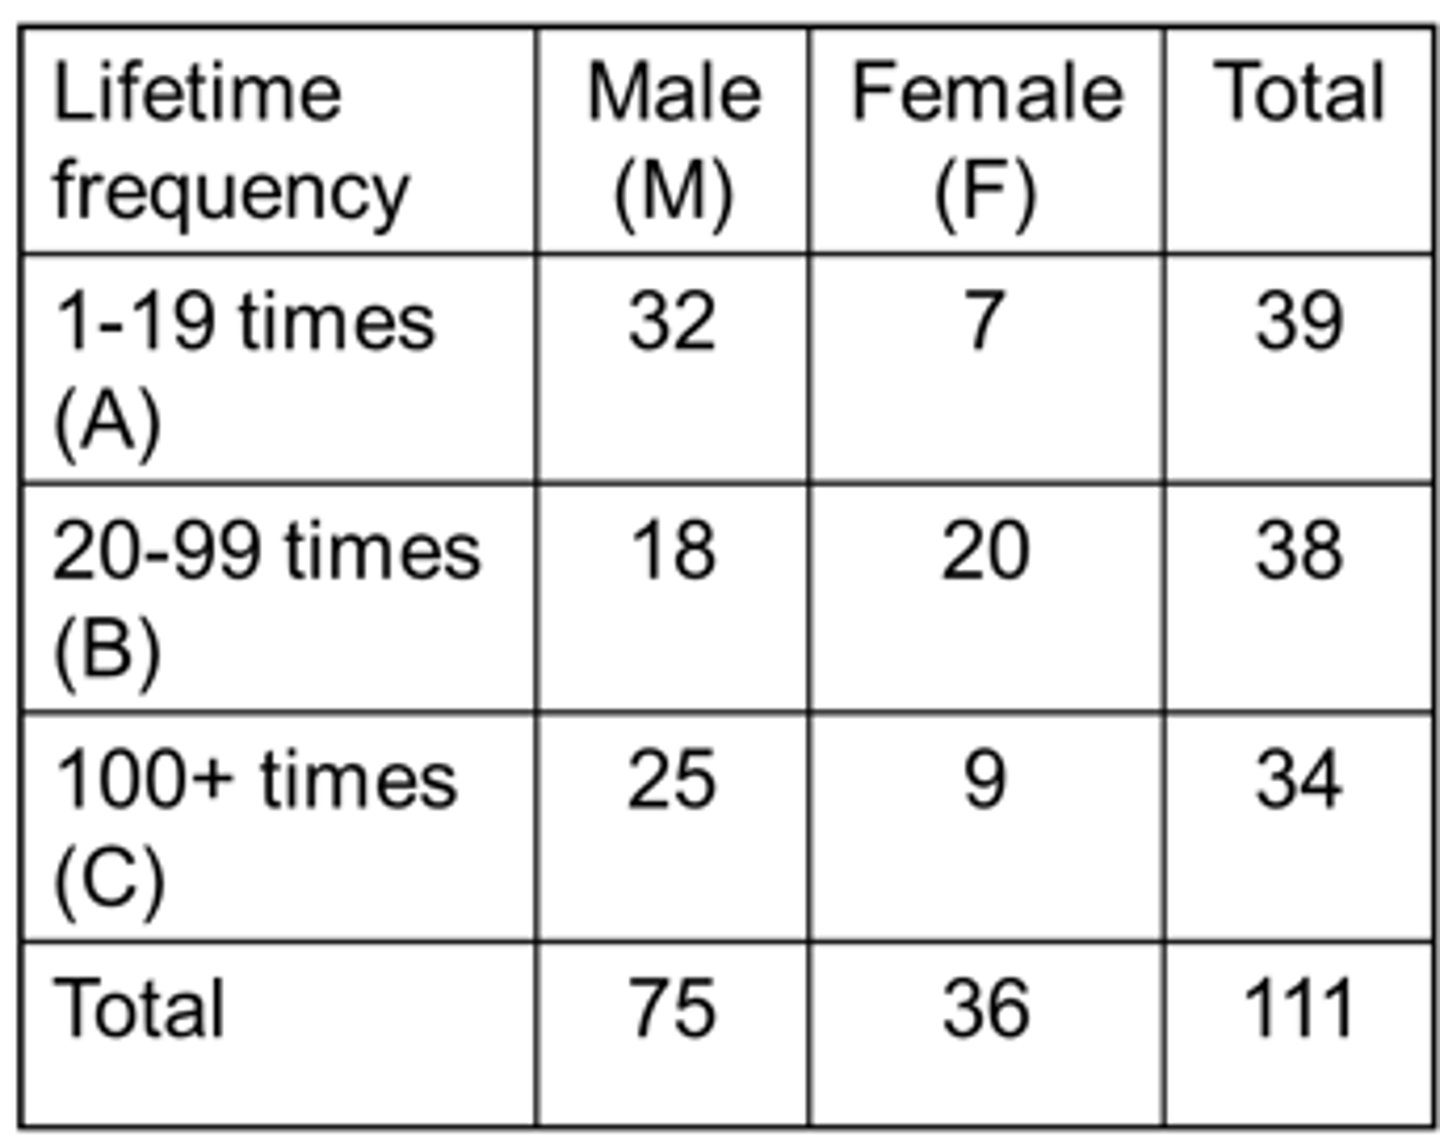
If we pick a person at random from this group what is the probability that the person is:
1. A male?
- P(M) = 75/111 = 0.676 = 67.6%
2. A female?
- P(F) = 36/111 = 0.324 = 32.4%
3. A 1-19 times lifetime user?
- P(A) = 39/111 = 0.351 = 35.1%
Marginal Probability - Complement
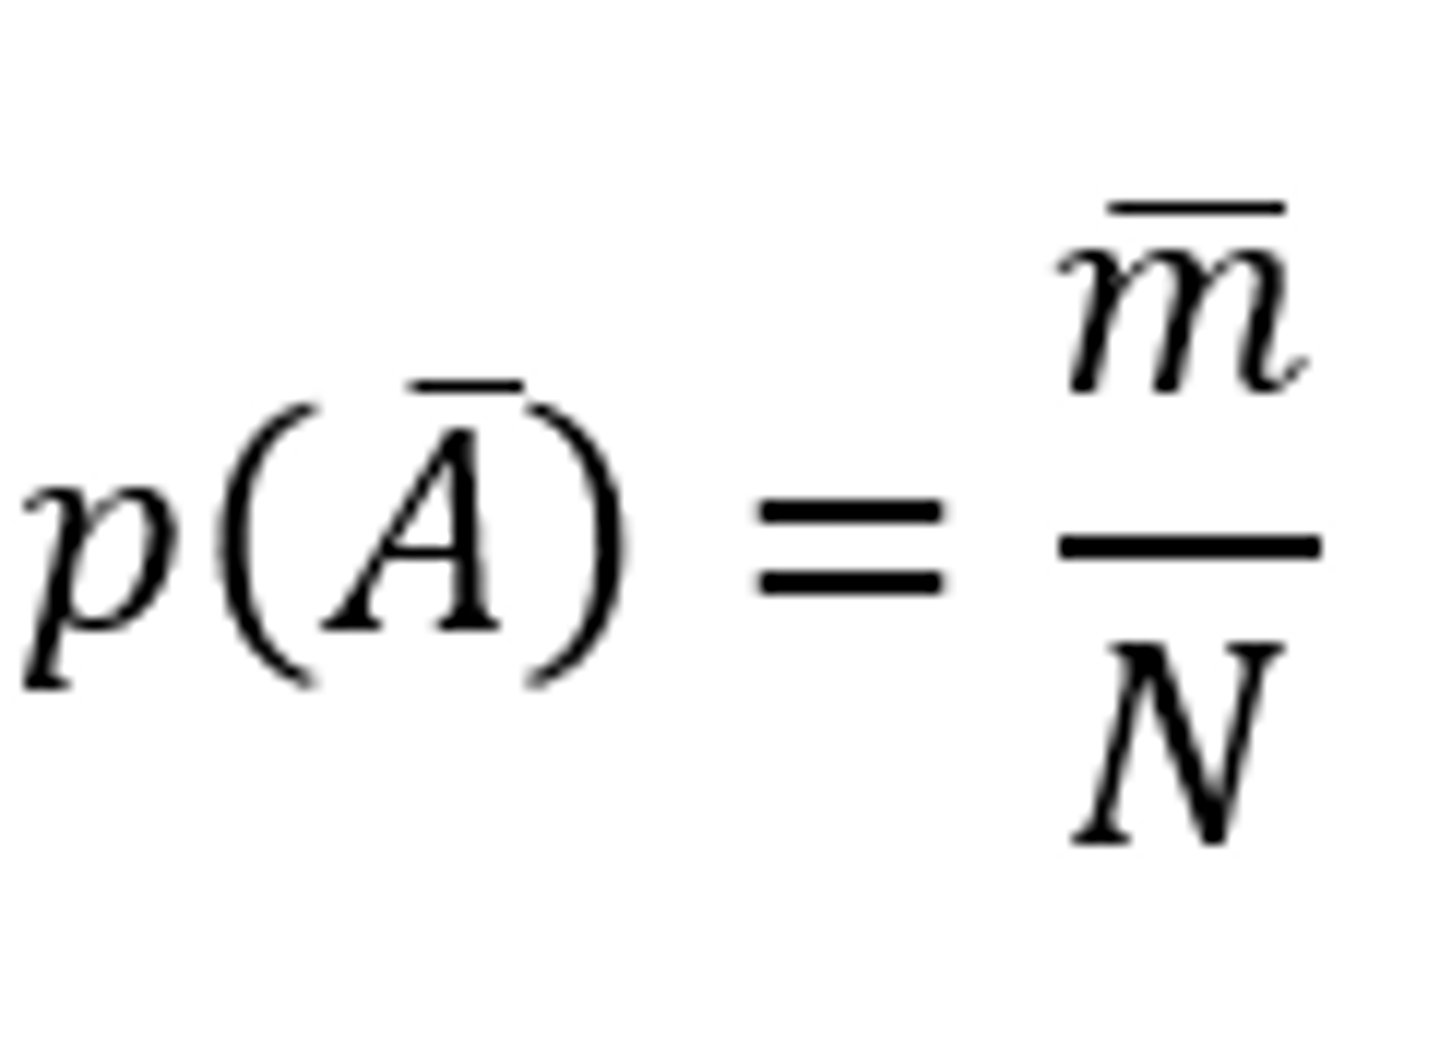
- 𝐩(A ̅) is the marginal probability that event A will not occur
- Using relative frequency probability, 𝐩(A ̅) is calculated by taking the number of times events other than A occurred (m ̅ ) and dividing it by the total number of trials (N)
𝐩(A ̅) = 1 - 𝐩(A )
𝐩(A ) = 1 - 𝐩(A ̅)
Marginal Probability - Complement Example
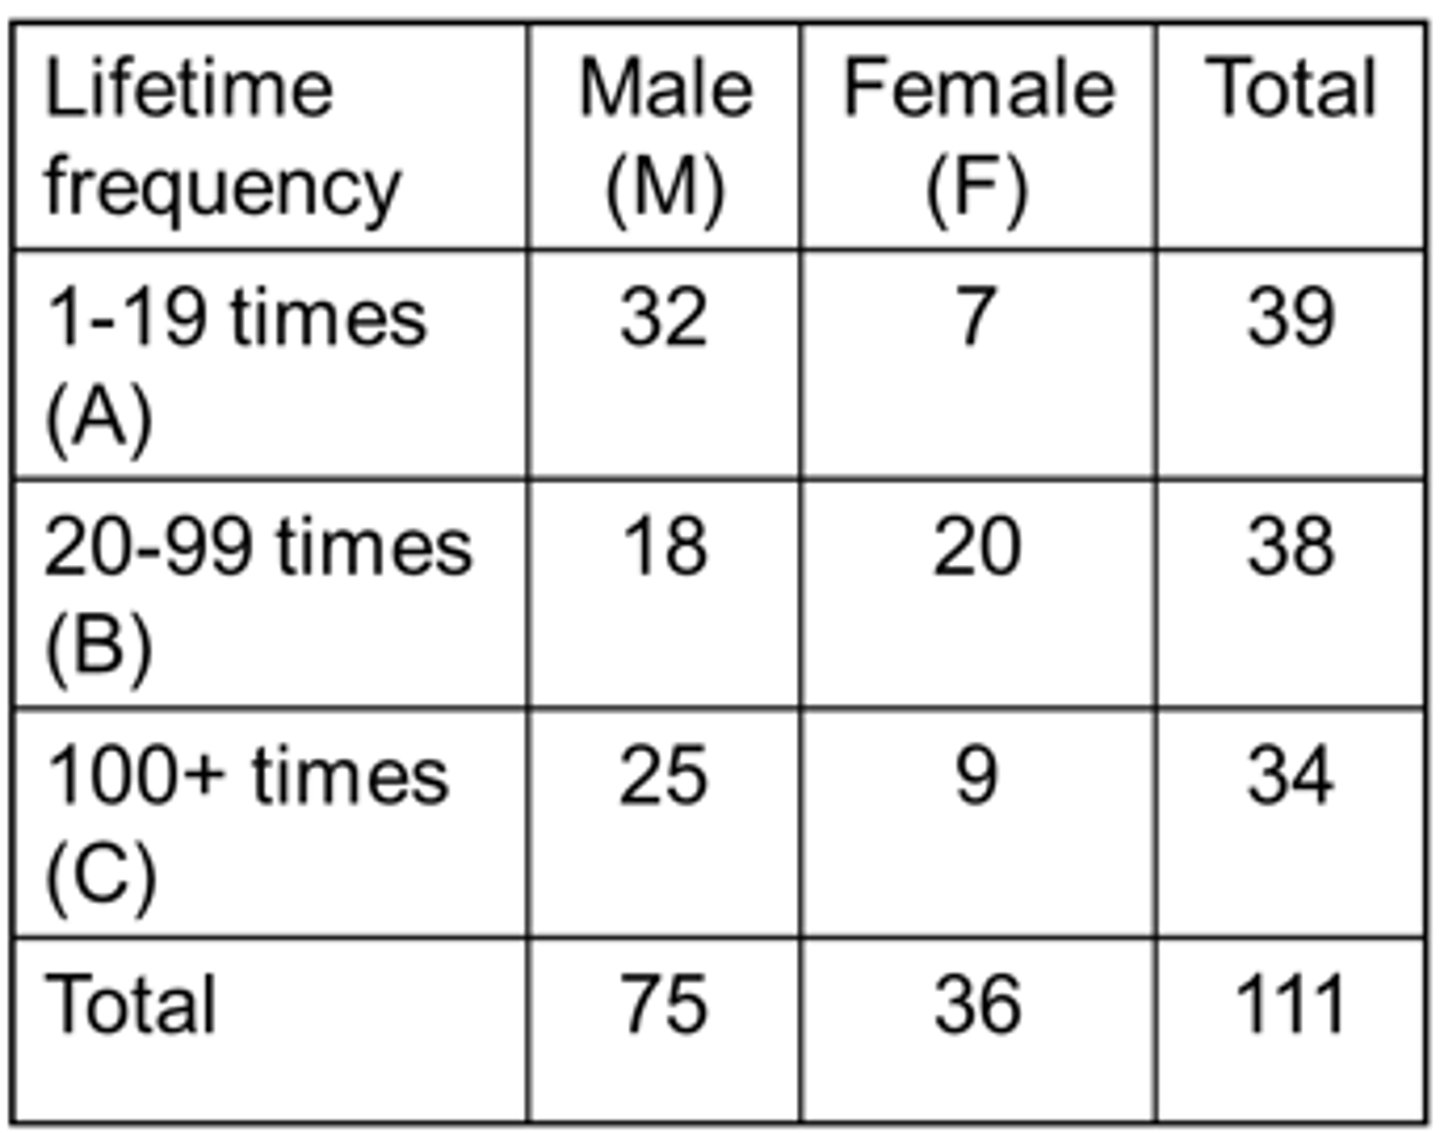
If we pick a person at random from this group what is the probability that the person is:
1. Not a male?
- 𝑝(M ̅) = 36/111 = 0.324 = 32.4%
2. Not a female?
- 𝑝(F ̅) = 75/111 = 0.676 = 67.6%
3. Not a 1-19 times lifetime user?
- p(A ̅) = (38+34)/111 = 0.649 = 64.9%
Conditional Probability
- P(A|B) is the probability that event A will occur given that event B has occurred
- Using conditional probabilities means that only a subset of the data is being used
- Must know which condition has occurred to select the correct denominator when calculating conditional probabilities
(A|B)
- A given B
- A conditional on B
Conditional Probability Example
Lifetime cocaine use will be 100+ times, given that the person is a male?
- P(C|M) = 25/75 = 0.333 = 33.3%
A person is female, given that they have a lifetime cocaine use of 100+ times?
- P(F|C) = 9/34 = 0.265 = 26.5%
Conditional Probability Wording
A question may not always say ‘given that’ to signal a conditional probability. Other ways of signaling a conditional probability for condition = male include:
- What is the probability of lifetime cocaine use of 100+ times among (or in) males?
- Assuming the person is male, what is the probability of lifetime cocaine use of 100+ times?
- Suppose you select a male at random from the population, what is the probability they will have a lifetime cocaine use of 100+ times?
Events which can never occur together are called:
a) Collectively exclusive
b) Mutually exhaustive
c) Mutually exclusive
d) Collectively exhaustive
Answer = C