Module 3 (Week 5) - Chapter 8: Real GDP and the Price Level in the Short Run
1/47
There's no tags or description
Looks like no tags are added yet.
Name | Mastery | Learn | Test | Matching | Spaced | Call with Kai |
|---|
No analytics yet
Send a link to your students to track their progress
48 Terms
Changes in the price level result in changes in ______ and changes in ______.
Changes in the price level result in changes in consumption and changes in net exports.
The relationship between the price level and desired consumption involves how changes in the price level lead to changes in household ______, and thus, to changes in desired ______.
The relationship between the price level and desired consumption involves how changes in the price level lead to changes in household wealth, and thus, to changes in desired spending.
A rise in the price level ______ the real value of money held by the private sector, allowing ______ goods to be purchased. A fall in the price level ______ the real value of money, allowing ______ goods to be purchased.
A rise in the price level lowers the real value of money held by the private sector, allowing fewer goods to be purchased. A fall in the price level increases the real value of money, allowing more goods to be purchased.
Explain the relationship between changes in the price level, consumption, and the AE function.
Rise in Price Level: AE function shifts downward
Reduction in wealth leads to decrease in desired consumption
Fall in Price Level: AE function shifts upward
Rise in wealth leads to increase in desired consumption
Explain the relationship between changes in the price level, net exports, and the AE function.
Rise in Domestic Price Level: AE function shifts downward
Canadian goods become more expensive (relative to foreign goods), leading to decrease in net exports
Fall in Domestic Price Level: AE function shifts upward
Canadian goods become less expensive, leading to increase in net exports
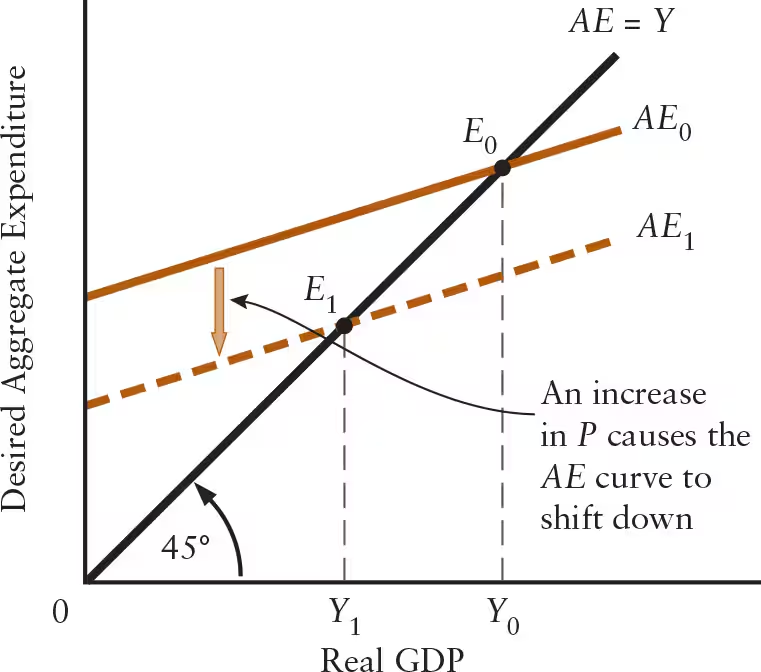
An exogenous rise in the price level causes a(n) ______ shift in the AE function, ______ the equilibrium level of real GDP.
An exogenous rise in the price level causes a(n) downward shift in the AE function, lowering the equilibrium level of real GDP.
An exogenous fall in the price level causes a(n) ______ shift in the AE function, ______ the equilibrium level of real GDP.
An exogenous fall in the price level causes a(n) upward shift in the AE function, increasing the equilibrium level of real GDP.
The price level and real equilibrium GDP are ______ related, as shown by the ______.
The price level and real equilibrium GDP are negatively related, as shown by the aggregate demand curve.
Define aggregate demand (AD) curve.
A curve showing the combinations of real GDP and price level at which desired aggregate expenditure is equal to actual national income
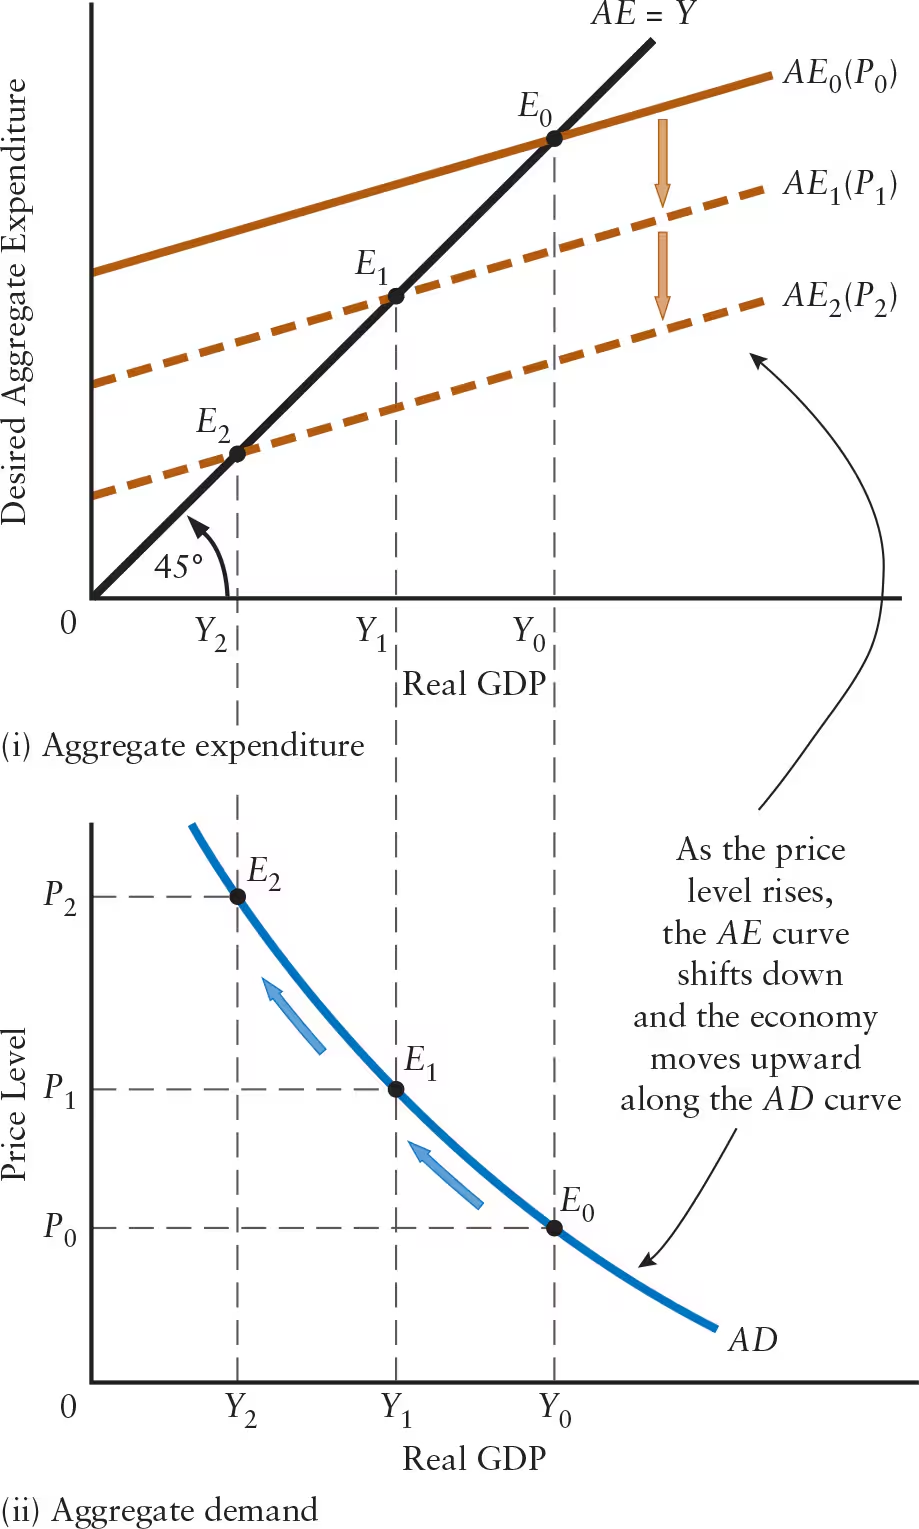
A change in the price level causes a ______ in the AE curve but a ______ along the AD curve.
A change in the price level causes a shift in the AE curve but a movement along the AD curve.

Explain the relationship between changes in the price level, the AE curve, and the AD curve.
Rise in Price Level: AE curve shifts downward, leading to movement upward and to the left along the AD curve
Decrease in equilibrium level of GDP
Fall in Price Level: AE curve shifts upward, leading to movement downward and to the right along the AD curve
Increase in equilibrium level of GDP

Define aggregate demand shock.
Any event that causes a shift in the aggregate demand (AD) curve
Any change (other than a change in the ______) that causes the AE curve to shift will also cause the AD curve to shift.
Any change (other than a change in the price level) that causes the AE curve to shift will also cause the AD curve to shift.

What are the 4 examples of aggregate demand shocks that shift the AD curve to the right?
Increase in desired consumption (C )
Increase in desired investment (I )
Increase in government purchases (G )
Increase in desired exports (X )
What are the 4 examples of aggregate demand shocks that shift the AD curve to the left?
Decrease in desired consumption (C )
Decrease in desired investment (I )
Decrease in government purchases (G )
Decrease in desired exports (X )
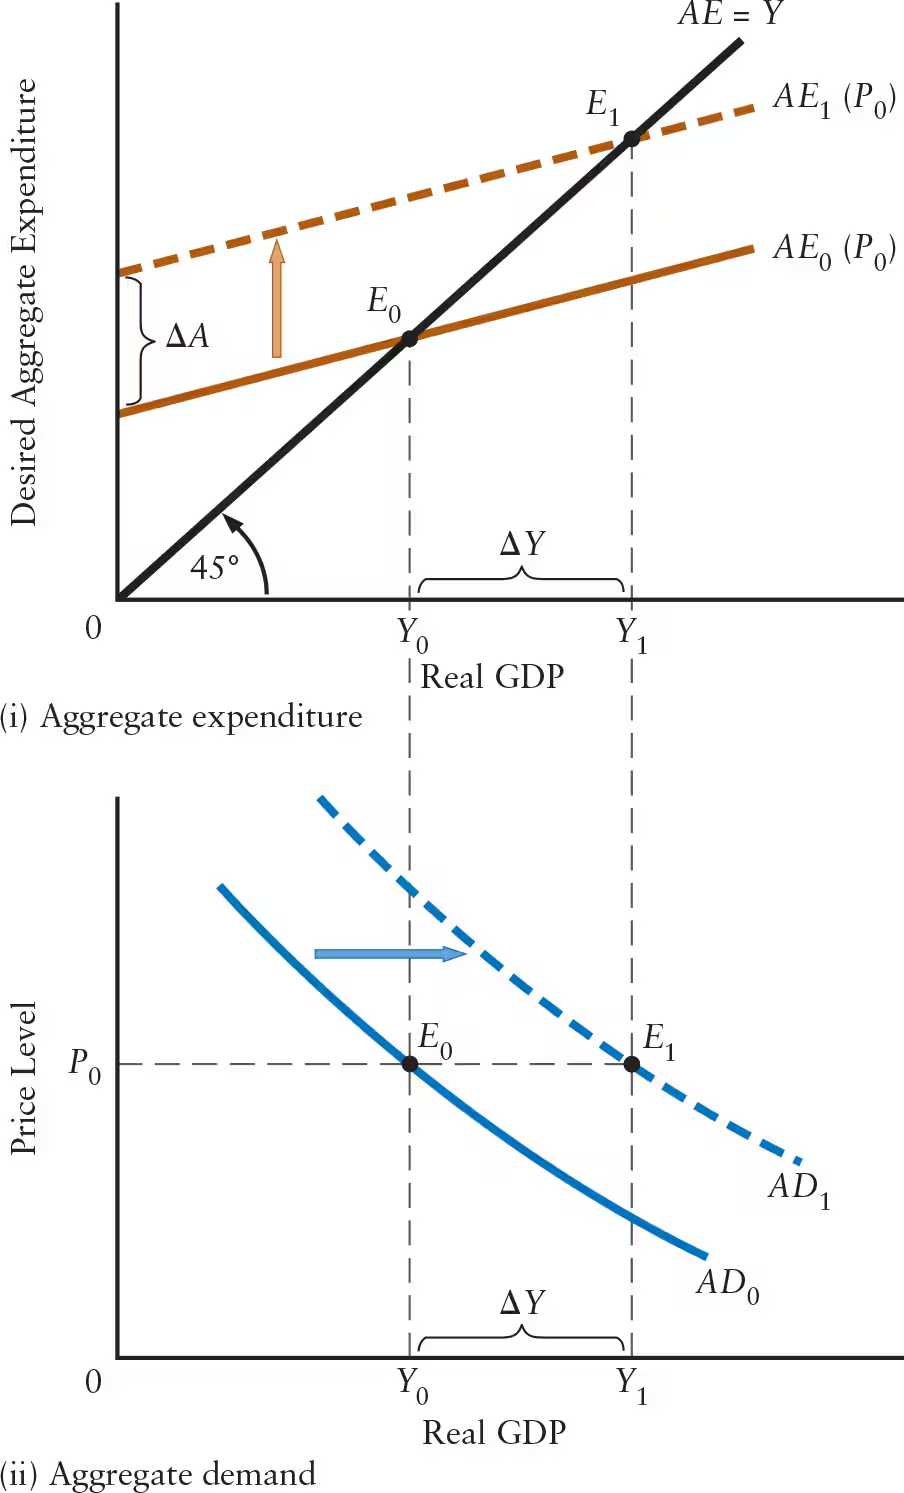
Explain the relationship between changes in autonomous aggregate expenditure, the AE curve, and the AD curve.
Rise in Autonomous Aggregate Expenditure: AE curve shifts upward, and AD curve shifts to the right
Fall in Autonomous Aggregate Expenditure: AE curve shifts downward, and AD curve shifts to the left
The simple multiplier measures the ______ shift in the AD curve in response to a change in autonomous desired expenditure.
The simple multiplier measures the horizontal shift in the AD curve in response to a change in autonomous desired expenditure.
Define aggregate supply (AS) curve.
A curve showing the relation between price level and quantity of aggregate output supplied, assuming constant factor prices and technology
Define unit costs.
Cost per unit of output, equal to total cost divided by total output
Explain the relationship between level of output and unit costs.
Rise in Output: rise in unit costs
Less efficient standby plants have to be used
Less efficient workers are hired
Existing workers are paid overtime rates for additional work
The ______ relationship between output and unit costs leads to the ______ slope of the AS curve. Firms who are interested in increasing profits (and avoiding losses) will not produce more output unless they charge ______ prices to cover ______ unit costs.
The positive relationship between output and unit costs leads to the positive slope of the AS curve. Firms who are interested in increasing profits (and avoiding losses) will not produce more output unless they charge higher prices to cover higher unit costs.

The higher the level of output, the ______ unit costs tend to rise with each extra increment of output. Thus, the AS curve becomes ______ as output rises.
The higher the level of output, the faster unit costs tend to rise with each extra increment of output. Thus, the AS curve becomes steeper as output rises.
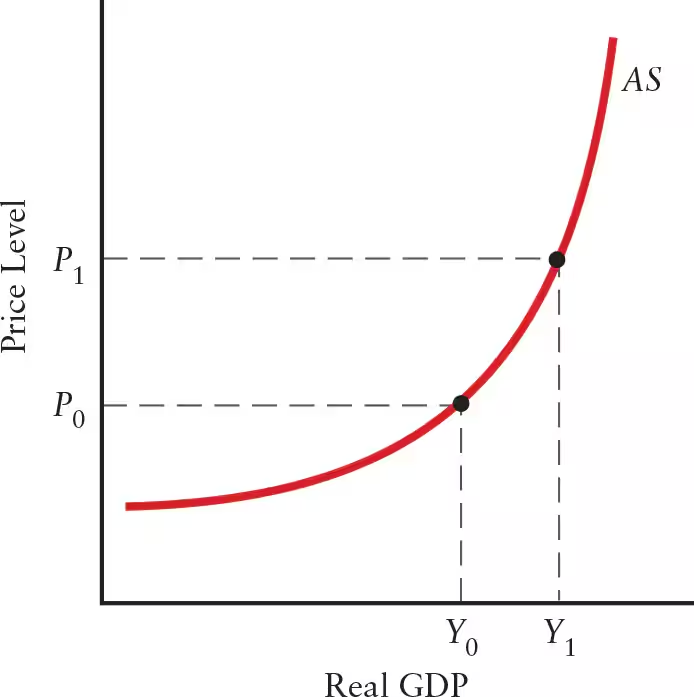
At low levels of output, firms have ______ capacity, and increases in output do not lead to higher unit costs. Thus, the AS curve is ______.
At low levels of output, firms have excess capacity, and increases in output do not lead to higher unit costs. Thus, the AS curve is horizontal (flat).
Define aggregate supply shocks.
Any shift in the aggregate supply (AS) curve caused by an exogenous force
A shift in the AS curve is caused by changes in 2 exogenous variables: changes in ______ and changes in ______.
A shift in the AS curve is caused by 2 exogenous variables: changes in factor prices and changes in technology.
Explain the relationship between changes in factor prices and the AS curve.
Rise in Factor Prices (and Other Input Prices): AS curve shifts upward and to the left
Firms’ profits at current levels of output are reduced
Ex: rise in the prices of raw materials (inputs)
In response to the rise in factor prices, aggregate supply falls
Fall in Factor Prices (and Other Input Prices): AS curve shifts downward and to the right
Production becomes more profitable, leading to an increase in aggregate supply

Explain the relationship between changes in technology and the AS curve.
Improvement in Technology: AS curve shifts downward and to the right
Improvements lead to lower unit costs, allowing output to be sold at lower prices
Increase in aggregate supply
Deterioration in Technology: AS curve shifts upward and to the left
Deterioration leads to higher unit costs
Ex: poor weather affecting agricultural production
Decrease in aggregate supply
______ occurs at the intersection of the AD and AS curves, determining the equilibrium values of ______ and ______.
Macroeconomic equilibrium occurs at the intersection of the AD and AS curves, determining the equilibrium values of real GDP and price level.


The equilibrium values of real GDP and price level occur at the intersection of the AD and AS curves, as shown by Point ______. This is called the ______.
The equilibrium values of real GDP and price level occur at the intersection of the AD and AS curves, as shown by Point E0. This is called the macroeconomic equilibrium.
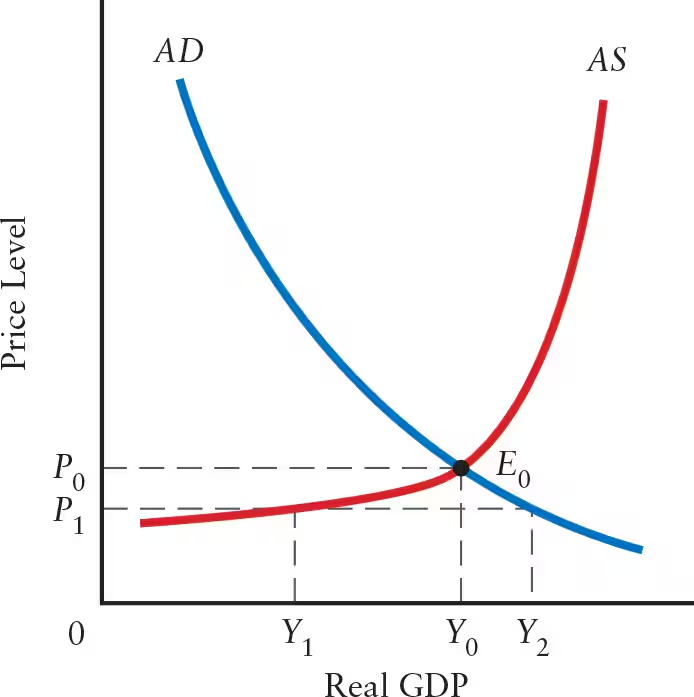
If the price level is equal to P1, the desired output of firms would be ______. However, at P1, the level of output demanded is equal to ______. Thus, when the price level is less than P0 (______), the desired output of firms is ______ than total output demanded.
If the price level is equal to P1, the desired output of firms would be Y1. However, at P1, the level of output demanded is equal to Y2. Thus, when the price level is less than P0 (macroeconomic equilibrium), the desired output of firms is less than total output demanded.

When the price level is greater than P0, the desired output of firms is ______ than total output demanded.
When the price level is greater than P0, the desired output of firms is greater than total output demanded.
What are the 2 types of aggregate demand (AD) shocks?
Positive AD Shock: AD curve shifts to the right
Increase in desired aggregate spending
Increase in equilibrium GDP and price level
Negative AD Shock: AD curve shifts to the left
Decrease in desired aggregate spending
Decrease in equilibrium GDP and price level
What are the 2 types of aggregate supply (AS) shocks?
Positive AS Shock: AS curve shifts to the right
Increase in aggregate supply
Increase in equilibrium GDP
Negative AS Shock: AS curve shifts to the left
Decrease in aggregate supply
Decrease in equilibrium GDP

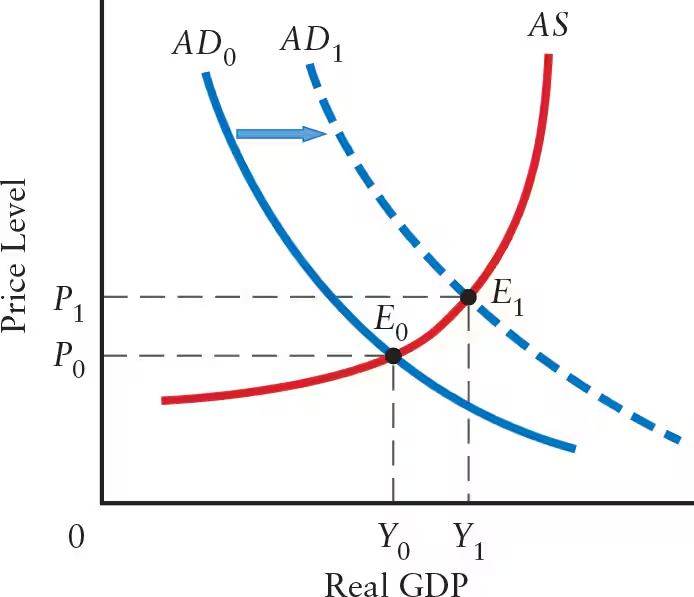
A rise in aggregate demand ______ the AD curve to the ______, from ______ to ______. Macroeconomic equilibrium moves from ______ to ______. The price level rises from ______ to ______. Real GDP rises from ______ to ______, reflecting a ______ along the AS curve.
A rise in aggregate demand shifts the AD curve to the right, from AD0 to AD1. Macroeconomic equilibrium moves from E0 to E1. The price level rises from P0 to P1. Real GDP rises from Y0 to Y1, reflecting a movement along the AS curve.
Aggregate demand (AD) shocks cause the price level and real GDP to change in the ______ direction.
Aggregate demand (AD) shocks cause the price level and real GDP to change in the same direction.
Positive AD Shock: increase in both price level and real GDP
Negative AD Shock: decrease in both price level and real GDP
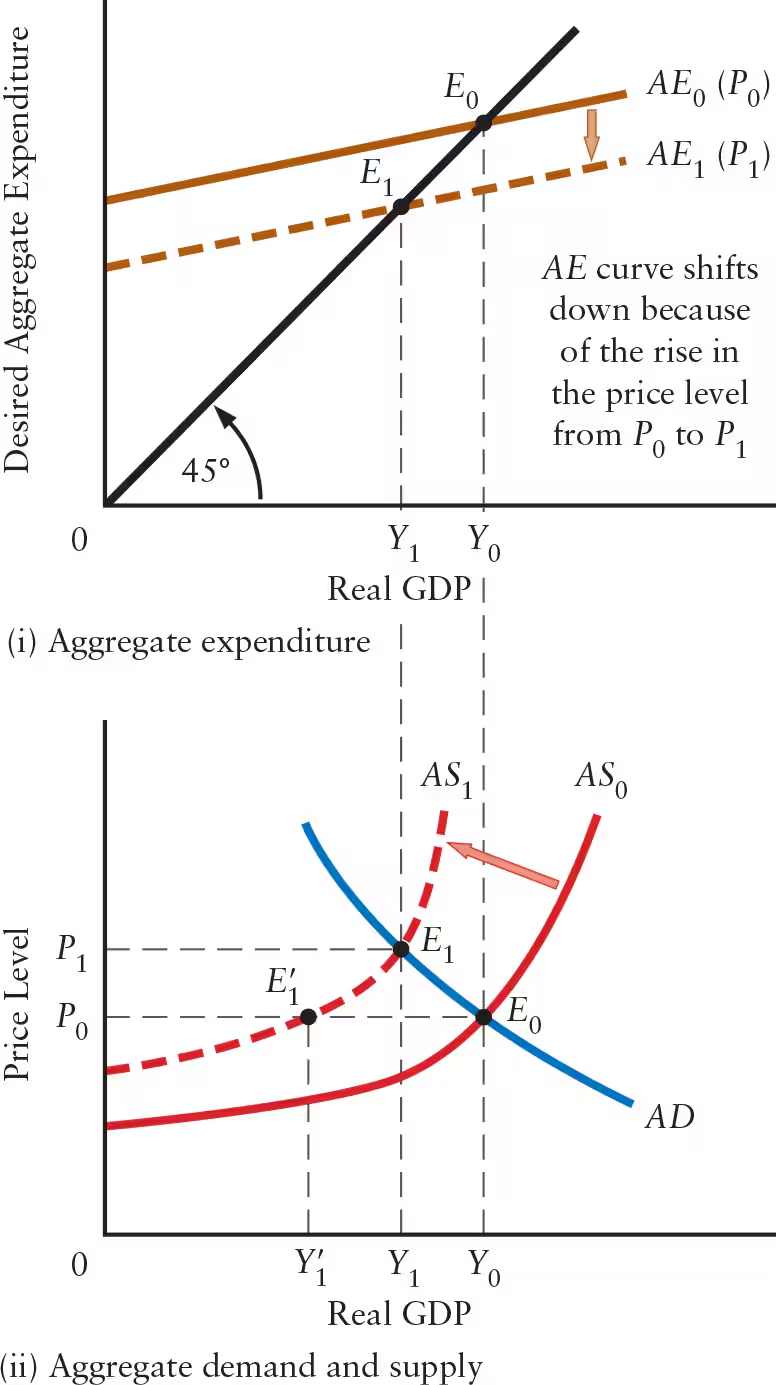
Explain why the multiplier is smaller when the AS curve is positively sloped (compared to when the price level is constant).
An increase in autonomous expenditure shifts the AE curve upward and the AD curve to the right (horizontal shift)
A rise in the price level (from P0 to P1) causes a decrease in net exports and desired consumption, leading to a downward shift in the AE curve and a movement upward and to the left along the AD curve
This counteracts the initial rise in real GDP, reducing the size of the multiplier

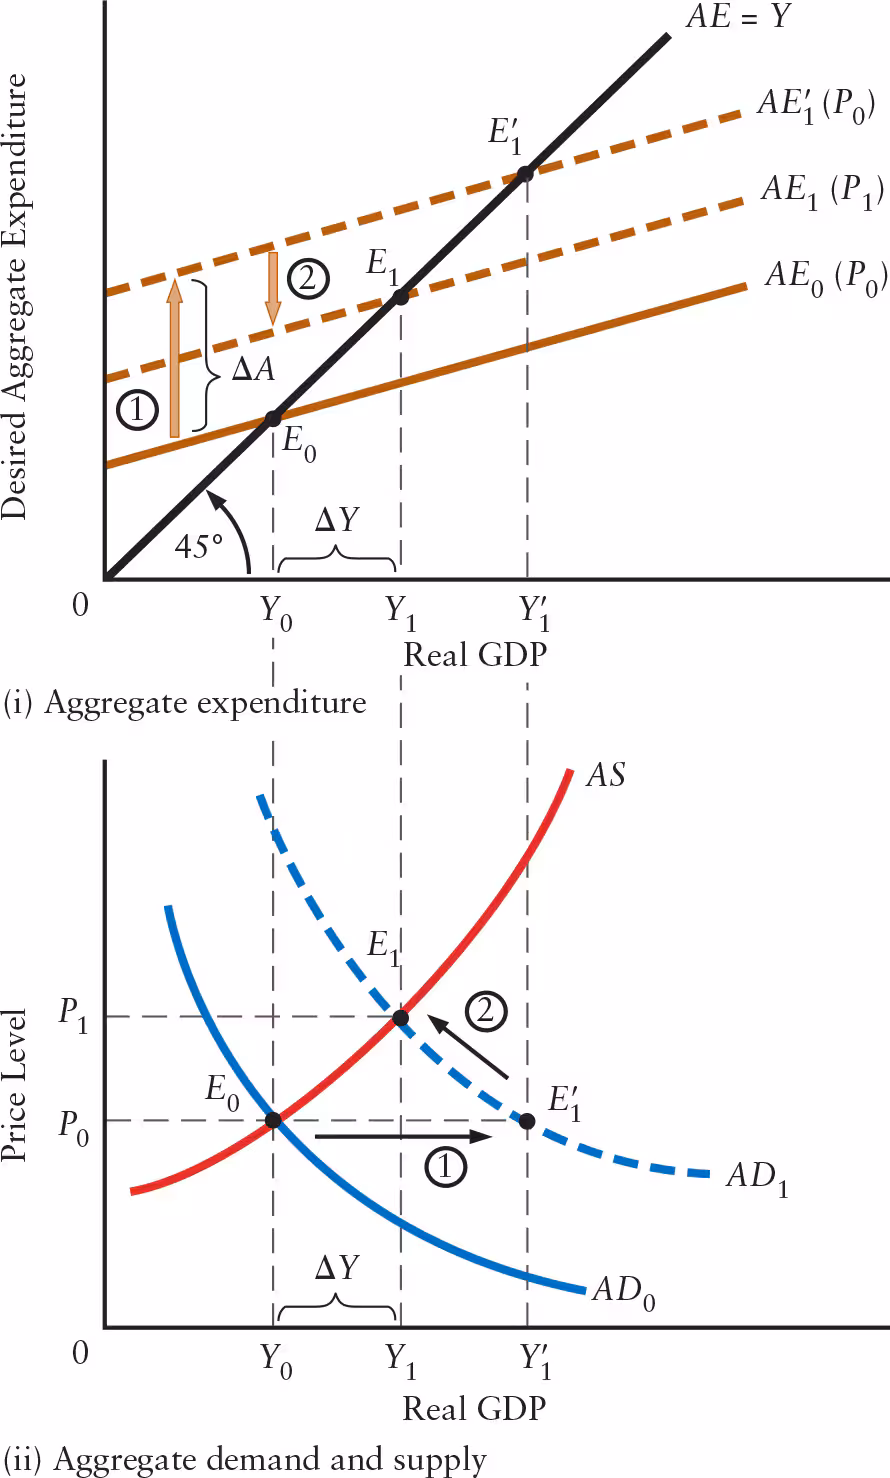
The multiplier, adjusted for the effect of the rise in price level, is equal to the ratio of ______.
The multiplier, adjusted for the effect of the rise in price level, is equal to the ratio of ΔY / ΔA.
Multiplier = Change in Equilibrium Real GDP / Change in Autonomous Desired Expenditure
If an aggregate demand shock leads to a change in price level, the ultimate change in real GDP will be ______ than what is predicted by the simple multiplier.
If an aggregate demand shock leads to a change in price level, the ultimate change in real GDP will be less than what is predicted by the simple multiplier.
True or False: A variable price level (non-constant price level) reduces the value of the multiplier.
True
The effect of increases in aggregate demand (AD) is divided between increases in ______ and ______, depending on the slope of the ______ curve.
The effect of increases in aggregate demand (AD) is divided between increases in real GDP and price level, depending on the slope of the aggregate supply (AS) curve.


Explain the effects of a flat AS curve (flat range or Keynesian range) on real GDP, price level, and the multiplier.
Flat AS Curve: flat range or Keynesian range
Real GDP: any aggregate demand shock leads to a change in real GDP
Price Level: no change in the price level
Firms with excess capacity can increase output without changing unit costs
Simple Multiplier: change in output is determined by the size of the simple multiplier

Explain the effects of a positively sloped AS curve (intermediate range) on real GDP, price level, and the multiplier.
Positively Sloped AS Curve: intermediate range
Real GDP: shift in AD curve leads to a change in real GDP
Price Level: shift in AD curve leads to a change in price level
Multiplier: multiplier is positive, but smaller than the simple multiplier

Explain the effects of a steep positively sloped AS curve (steep range) on real GDP, price level, and the multiplier.
Steep Positively Sloped AS Curve: steep range
Real GDP: change in aggregate demand (AD) leads to little or no change in real GDP
Production is close to full capacity
Price Level: any change in AD leads to a sharp change in price level
Multiplier: multiplier is nearly zero
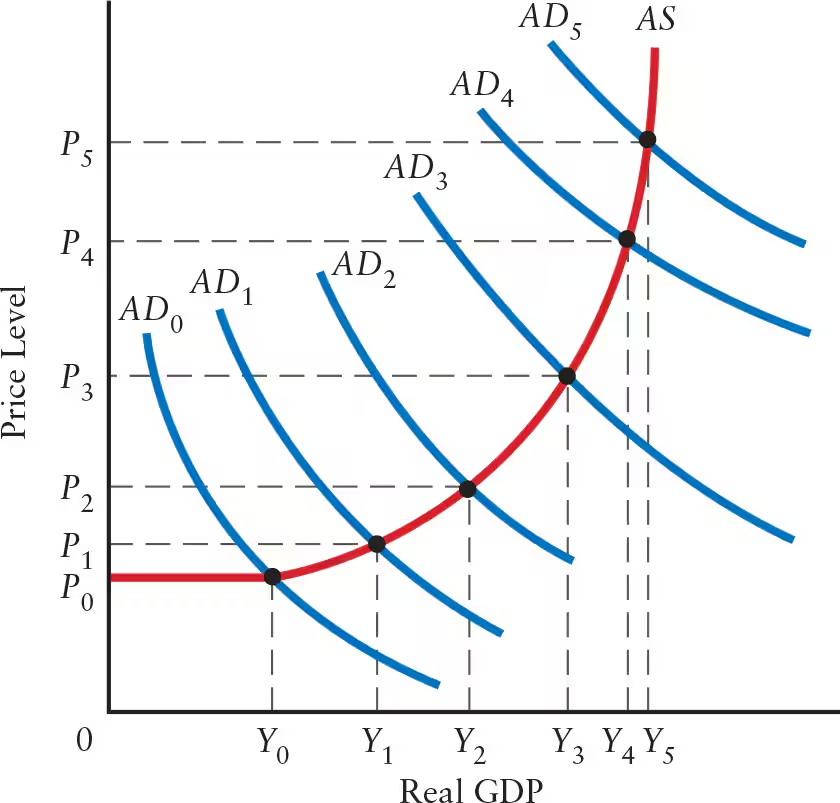
The steeper the AS curve, the ______ the price effect and the ______ the GDP effect.
The steeper the AS curve, the greater the price effect and the smaller the GDP effect.
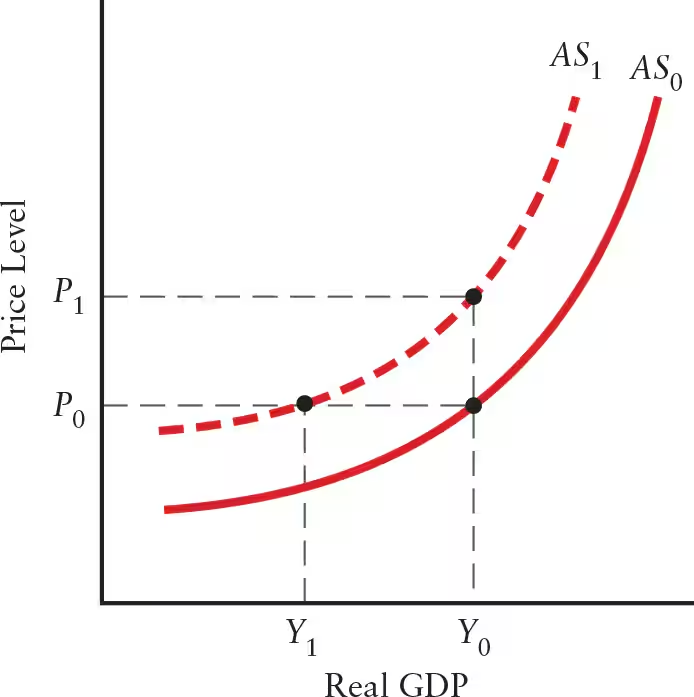
A rise in the world price of inputs (such as oil, copper, or iron) is an example of a ______ aggregate supply (AS) shock.
An increase in the world price of inputs (such as oil, copper, or iron) is an example of a negative aggregate supply (AS) shock.
A fall in the world price of inputs (such as oil, copper, or iron) is an example of a ______ aggregate supply (AS) shock.
A fall in the world price of inputs (such as oil, copper, or iron) is an example of a positive aggregate supply (AS) shock.
Aggregate supply (AS) shocks cause the price level and real GDP to change in ______ directions.
Aggregate supply (AS) shocks cause the price level and real GDP to change in opposite directions.
Positive AS Shocks: decrease in price level and increase in real GDP
Negative AS Shocks: increase in price level and decrease in real GDP

When the AS curve is flat, shifts in the AD curve primarily affect ______. When the AS curve is steep, shifts in the AD curve primarily affect ______.
When the AS curve is flat, shifts in the AD curve primarily affect real GDP. When the AS curve is steep, shifts in the AD curve primarily affect price level.