dcp ansc2500 prelim 1
 Call Kai
 Learn
Learn Practice Test
 Spaced Repetition
 Match
Match Flashcards
 Knowt Play
1/47

There's no tags or description
Looks like no tags are added yet.
Name | Mastery | Learn | Test | Matching | Spaced | Call with Kai | Chat |
|---|
No analytics yet
Send a link to your students to track their progress
48 Terms
Dairy industry
Dairy industry is the global production, processing, and distribution of milk and milk products (butter, yogurt, cheese)
US trends for dairy
the # of farms is decreasing, but milk prod. is up
Fluid milk consumption falling over past 5 decades until 2024
Less children, more alternatives, consumer preferences are to blame
Cheese/butter consumption per capita increasing
Cheese Up 13-21% from 2011-2021
butter up 18% from 2011-2021
Overall, dairy consumption rose from 1981-2021, but Americans only having half of recommended daily dairy content
Whey ingredients/lactose: mostly to China
Nonfat/skim milk, cheese: mostly to Mexico
Average time for fluid milk to reach grocery stores
48 hours
Interstate milk shipper code lets us track products
How much milk does it take to make other dairy products
~10 lbs of fluid milk for 1 lb of cheese
21:1 for butter (skimmed milk made into another product)
1:1 plain yogurt
4:1 greek yogurt
5 top dairy states
Cali
Wisconsin
Idaho
Texas
NY
New frontiers of dairy
South Dakota: 117% increase in dairy cow prod in last decade
Kansas: 23.7% prod increase, 44k new cows in 2025
What breeds
80% Holsteins, 12% jersey, 6% crossbred
Holstein prod avgs 2022, pros/cons
28,416 lbs milk, 1,162 lbs fat, 911 lbs protein, 4.11% fat, 3.22% protein
Pros:
Higher milk prod
More proftable
Laid back personality
Cons:
Lower components prod
Higher maintenance reqs (larger frame)
Jersey prod stat avgs, pros/cons
20,653 lbs milk, 1022 lbs fat, 778 protein, 4.91% fat 3.72% protein
Pros:
Lower maintenance
Higher components
Higher cheese yield
More heat tolerant
Cons:
Lower milk production
High incidence of milk fever
Global dairy statistics
global dairy consumption rising
Five most important animals:
Cows
Buffalo
Goats
Sheep
Camels
Water buffalo stats
Milk prod estimate 2000kg
2019 estimate from USDA: 49% of Indian milk is from water buffalo
beef prod also up, especially in Brazil
Goat (caprine) dairy stats
Dairy goat inventory from 334,754 to 537,799 (2007-2017); 60.7% increase
Global demand for goat milk powder in infant formula
Sheep (ovine) dairy stats
Rare: <200 sheep dairies in US
Limited in US by lack of US genetics and blockcades until 2017
Mostly Mediterranean countries:
Turkey
China
Greece
Camel dairy stats
Prod: 2.6 gallons avg, 5 gallons high
gestation length: 15 and 13, Dromedary and Bactrian respectively
To maintain milk prod, camels need visual + physical contact with calf
Domestication
First in ME, Europe, 10500 years ago
Started with ~50 aurochs
Second event: indian subcontinent, Bos indicus (characteristic hump)
More adapted to heat + parasites
Day at the farm for cows and humans
Eating ~5hr
Socializing ~2.5
Milking ~2.5
Walking/standing ~2
Laying down ~12
Humans
Provide feed
• Harvest milk
• Remove manure
• Utilize manure
• Provide bedding
• Manage health
• Manage reproduction
• Manage young stock
Life cycle- heifer calf to milking
Ideally, double birth weight by weaning (~50-75 days of age)]
Weaning to breeding - grow grow grow
Target: breed heifers at 55% of mature body weight
![<p>Ideally, double birth weight by weaning (~50-75 days of age)]</p><p>Weaning to breeding - grow grow grow</p><p>Target: breed heifers at 55% of mature body weight</p>](https://assets.knowt.com/user-attachments/4a48a966-696e-4d68-8fd1-c40a363977a9.png)
First calving: start of lactation
Calving = parturition = freshening
Target: first lactation animals should be 82-85% of mature body weight
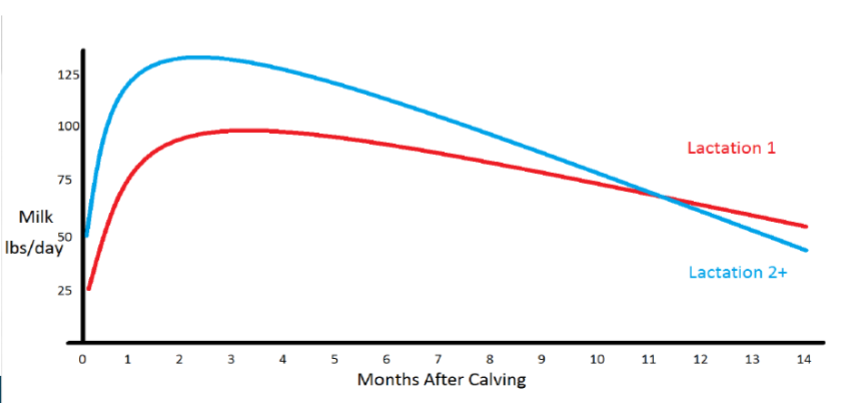
Lactation info
Begins on day of calving
3 stages
“Fresh” or early lactation (day 0-21)
“Peak” or “high” ~20-200 days in milk (DIM)
“late” or “low” ~200-300 DIM
KNOW HOW TO DRAW THIS CURVE
Dry off period
Persistence: days 60-280
Dry off target around 10 months
Last 45-60 days of gestation
Cows not milked, fed specialized diet
Transition period begins in last 3 weeks of gestation

Internal herd replacement
“Culling” is the term for the removal of an animal from the herd
“Replacements” a term for the young stock that will take the place of a culled animal
Every herd will have their own unique culling/replacement strategy (that changes) based on the goals of the herd
Internal herd growth? Shrink? Increased beef sales?
Without replacements, herd either shrinks or cattle must be purchased

Dairy culling
The average permanent removal rate in 2013 was 28.4% of cows were culled and 4.8% deaths in adult dairy cattle (NAHMS, 2014)
“Cull Rate” has many definitions
Most common used: Cull Rate = # animals that left the herd / average # of animals in herd
Culled dairy is 6% of beef in America
Fed dairy animals
Males and culled heifers ~16% of US beef
This was a 60% increase from 2011-2016
Why is nutrition important
35-50% of milk prod cost is in feed
Opportunities to improve efficiencies, decrease environmental costs of dairies
Correlation with disease and disorders
4 rumen stomach components
Rumen
Fermentation vat, has papillae for surface area
Reticulum
Regurgitation, traps foreign objects
Omasum
Water absorption
Absomasum
“true stomach”
Rumen qualities
Fermentation chamber
Bacteria, Archea, Protozoa, Fungi, Mycoplasma, bacteriophages
Anaerobic or facultative anaerobic
>1 quadrillion rumen bugs per cow
most important cow nutrient
WATER
30-50 gallons a day
4.5-5 lbs of water per lb of milk
Should be screened for nitrates, salinity, toxic minerals
Affected by temps
Other cow nutrients: energy
Body maintenance, milk production, growth, pregnancy
Carbs
Structural: forages, hay
Nonstructural: starch sugars
Fats
Rumen bacteria and energy source
Cellulolytic and Hemicellulolytic bacteria (SCB)
Digest cellulose and hemicellulose
Thrive at a pH of 6.0-7.0
Amylolytic bacteria (NSCB)
Digest starch and sugars
Thrive in pH 5.0-6.0
End product of this type of fermentation: VFA’s

VFAs (volatile fatty acids)
Acetate: Contributes to overall energy, liked with milk fat
Increases in forage diets
Propionate: converted to glucose in the liver
Increases in grain diets
Butyrate: linked with gut health and rumen papillae development
Other cow nutrients: protein
Supplies bacteria with nitrogen, which they use to make their own protein (MCP)
Supplies cattle w/ amino acids
Sources: forages (alfalfa), concentrates (soybean, canola meal), supplements (amino acids)
Other cow nutrients: minerals and vitamins
Macrominerals:
◦ Bone growth, muscle function, and metabolism. Ca, P, Mg, K, Na, S.
Microminerals:
◦ Immunity, reproduction, and enzyme function. Cu, Zn, Mn, Se, Co, I, Fe.
Vitamins:
◦ Vitamin A: vision, immunity, epithelial integrity.
◦ Vitamin D: calcium & phosphorus metabolism.
◦ Vitamin E: antioxidant protection and immune support.
Characteristics of good rumen function
High rates of fiber fermentation
Efficient production of MCP
Low methane production (lowering gas production)
Optimal ratios of VFA’s
Low lactate production
Different nutrient requirements across different categories of animals
Pre-weaned calves
Post-weaned calves/prebreeding heifers
Bred heifers
Dry cows (“far-off” and “close-up”)
Fresh cows
High cows
First calf heifers
Low cows
WHAT is desired for cows, WHAT does that drive
Maintenance —> body weight
Growth —> rate of gain, composition of gain
Pregnancy —> expected birth weight of calf, DCC (differential cell count)
Lactation —> milk yield, components (fat, protein, lact)
Nutrient reqs vs feeding a diet
TMR ingredients
Forage
Corn (forage and grain)
Byproducts
Soybean meal
Canola meal
Distillers grains
Almond hulls
Other food “waste”
Supplements
Minerals
Profitability calculations IOFC, variance in IOFC
Income over food cost
Milk income MINUS feed cost = IOFC
85% of variance comes from:
50%: saleable milk, fat, protein? (components)
25%: how much milk from amt of feed? (efficiency)
10%: how much does each lb of diet cost? (TMR dry matter cost)
Transition period
3 weeks before and after calving
Transition = periparturient
“Far-off dry cow” = dry off to abt 21d before calving
“Close-up dry cow” / “Prefresh” = 21d before calving, up until calving
Fresh cow = first 14-21 days in milk
Changes between before and after calving
Before:
Pregnant
no milk
Relatively low nutrient demand
Lower demands, changes to prepare for calving
After:
Supporting herself
Producing milk
Recovering from calving
Preparing for reproduction
Higher demands, multiple priorities to sustain health and support productivity

Demands in transition period
nutrients
Immune challenges
Feed intake
Reproductive priorities
Metabolic stress
Transition period goals
high milk production
Maintain/minimize losses in body condition score (BCS)
Low incidence of metabolic disorders
Minimize loss of immunocompetence/immune related disorders
Control/decrease days to first ovulation and maintain/enhance fertility
Low stillborn rate and healthy calves
Best dairies can do all these by focusing on continuous improvement in all areas of transition cow management
More narrow key focus areas for maanging metabolism of transition cows
Facilitate cow’s adaptations in energy and protein metabolism
Avoid “maladaptation to negative energy balance”
Manage calcium status/prevent hypocalcemia
Support immune function and avoid chronic inflammation
Minimize management-related stressors and potential negative interactions with metabolism
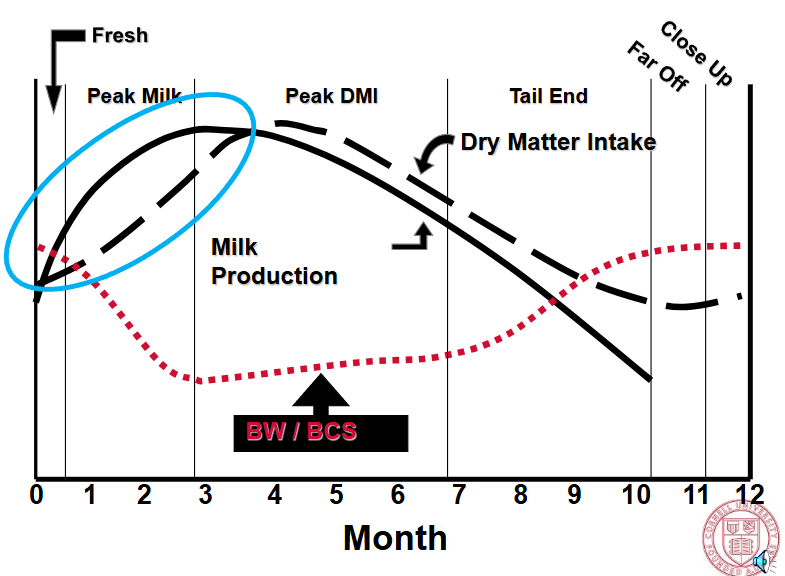
Facilitate cow’s adaptations in energy and protein metabolism - expanded
Some BCS loss is normal
Excessively high BCS indicates excessive adipose tissue, risk factor for transition disease
Manage calcium status/prevent hypocalcemia
Needs 2-4g of Ca in plasma pool
Plasma pool must turnover 10+ times for colostrum development
Adaptation requires coordination of several hormones and tissues
Prepartum dietary management is most effective way of preventing postpartum hypocalcemia
Manipulate dietary cation-anion difference (DCAD)
Minimize/avoid high potassium forages (legumes)
Cations – Potassium (K) and Sodium (Na) – want to control/minimize
Focus diet formulation on using low potassium forages/feeds
Anions – Chloride (Cl) and Sulfur (S) – supplement
OR
Actualize a low calcium/phosphorus diet through use of a binder in the diet to decrease absorption
Synthetic Zeolite A

Shift in mindset regarding transition cows
Shift from a disease opportunity to a production/reproduction opportunity
Key components of transition cow nutrient management
Nutritional management
Tight control of macrominerals in prerefresh
Controlling energy intakes in both far-off and close-up
Ensure cows consume diet as formulated
Feeding management is critical
Minimize sorting
Focus on ration fermentability during the fresh period
Nonnutritional management
Minimize stressors and potential impact on physiology and variation in DMI
Put cow and herd level monitoring systems in place to help identify need for management changes
Other micromineral feeding considerations
DCAD approach reminder vs zeolite approach
Mg, Ca - supplement
P - likely not supplement
Controlling energy intake in dry cows
Too little energy:
negative energy balance during dry period
Greater risk for postcalving disorders
Associated with lower milk yield and poorer reproductive perforamnce
Too much energy
Cows have greater decrease in DMI before calving
Sluggish increase in DMI postcalving