Hypothesis Testing: Confidence Intervals (Test 1)
1/50
There's no tags or description
Looks like no tags are added yet.
Name | Mastery | Learn | Test | Matching | Spaced | Call with Kai |
|---|
No analytics yet
Send a link to your students to track their progress
51 Terms
1) to measure variability in the data in an effort to assess the role of chance
2) to estimate effects after correcting for biases such as confounding
What are the 2 primary roles of the analysis of epidemiological data?
descriptive statistics
are generally concerned with organizing, tabulating, summarizing, depicting, or describing data; essentially reducing a large quantity of data to a manageable (and useable) form
inferential statistics
collecting data from a sample and are interested in drawing valid conclusions about a population based on information contained in a sample from that population which is the realm of what?
estimation and hypothesis testing
What are the 2 general categories of statistical inference?
statistics
descriptive measures computed from the data of a sample
parameters
measures computed from the data of a population (usually, but not always, symbolized by lower-case Greek letters)
the probability pattern (distribution) of the variables
Estimation and hypothesis testing are based on assumptions about what?
probability distribution
All the possible values of a variable and their relative frequency of occurrence
empirical distribution
actual data that you observe
statistical distribution
is a type of distribution defined by a theoretical probability distribution
expected
Statistical distribution describes the way in which random variables are ____________ to behave.
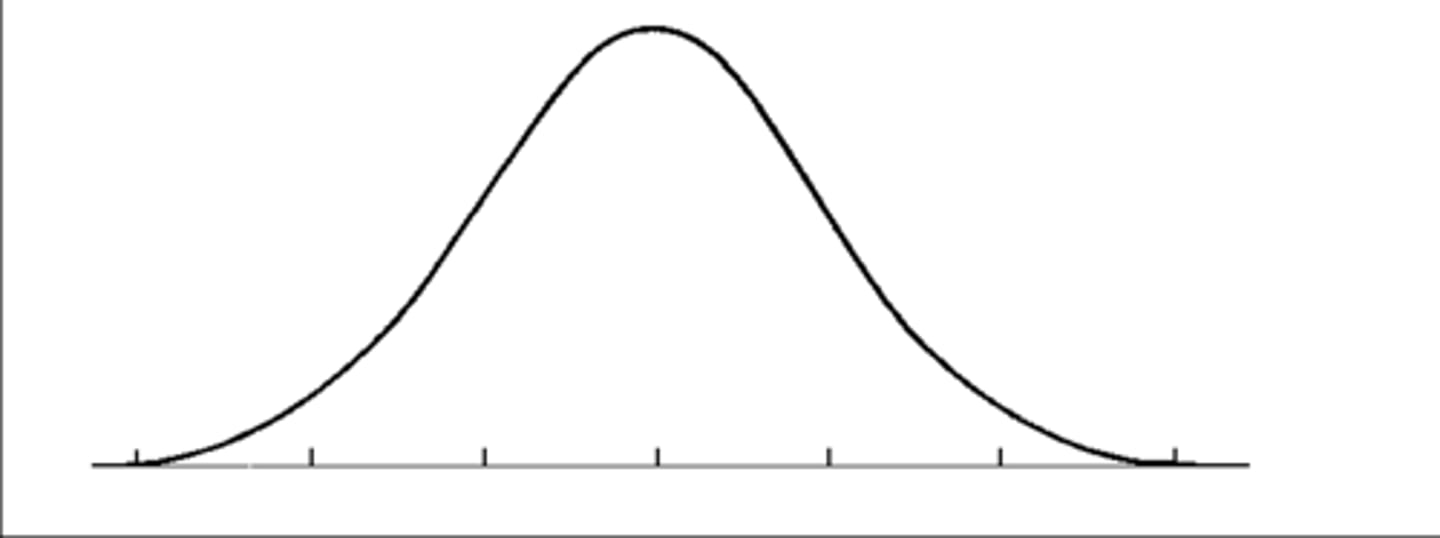
normal distribution
-for variables measured at the continuous level
-"bell curve" that is symmetrical around the mean
mean and standard deviation
What is the shape of a normal probability distribution defined by?
normal distribution examples
-height
-birth weight
-reading ability
-job satisfaction
-SAT scores
z-distribution (standard normal distribution)
special type of normal distribution where data are transformed so that the mean is 0 and the standard deviation is 1
t-distribution (Student's t-distribution)
very similar in shape and properties to the standard normal distribution (t distribution has wider tails); it is used when the sample size is small or when the population variance is unknown and has to be estimated from a sample
central limit theorem (CLT)
-fundamental to interval estimation and hypothesis testing
1.The mean of all sample means will equal the population mean.
2.The standard deviation of the sampled means is equal to the standard error of the mean.
3.As the sample size increases, the distribution of the sample means will approach a normal distribution regardless of the underlying distribution of the variable
point estimation
the process of finding a single value that is the best guess of an unknown population parameter
NO
Does point estimation provide information about random error?
interval estimation
is the process of associating with the point estimate a measure of statistical variation or random error
confidence interval (interval estimate)
consists of two numerical values defining a range of values that, with a specified degree of confidence, we feel covers the parameter being estimated
precision of a point estimate
Confidence intervals indicate what?
more
The smaller the random error, the _________ precise the estimate.
lower; higher
A wider confidence interval indicates __________ precision and a narrower confidence interval indicates ____________ precision.
statistical theory
is used to determine the distribution of the estimator (called a sampling distribution) and this information can be used to determine both the reliability coefficient and the standard error
size of the sample
What is the key component in standard error?
smaller
The larger the sample size, the __________ the standard of error
-confidence level
-sample size
What affects the confidence interval?
larger
A higher confidence level results in a ____________ reliability coefficient.
smaller
Larger sample sizes result in a ___________ standard error
95%
What % is the most common value in confidence levels for scientific disciplines?
hypothesis
-declarative sentence
-describes a relationship between 2 or more variables
-must be testable
null hypothesis
no relationship or no difference between groups or some variables
alternative hypothesis (research hypothesis)
opposite of the null hypothesis (there is a relationship or a difference)
null hypothesis
Do we test the null hypothesis or alternative hypothesis?
tails
Hypotheses have ________!
Two-tailed (2-sided or non-directional hypothesis)
Tests of ______________ are more common in biomedical literature.
-2 tailed
-1 tailed
What are the 2 types of hypotheses?
Type 1 error
rejecting the null hypothesis when it's actually true
Type 2 error
rejecting the null hypothesis when its actually false
power
__________ of the test is defined as the probability of correctly rejecting the null hypothesis when false ( 1- beta)
condtitional
Alpha, beta, and power are _________ probabilities.
alpha
level of significance or the significance level
before
Concepts related to power are often used in calculating necessary sample sizes _________ a study is conducted.
decreases
Alpha increases as beta _____________.
increases
Alpha decreases as beta ________________.
increase the sample size
How can you decrease both alpha and beta?
p value
is a measure that is often used to guide decision making when performing hypothesis testing
reject the null hypothesis
If the p value is less than or equal to alpha what do we do?
fail to reject the null hypothesis
If the p value is greater than alpha what do we do?
rejecting the null hypothesis
The smaller the p value, the "stronger" the evidence for what?