EIP Unit 4: Descriptive Statistics and Variability
1/49
There's no tags or description
Looks like no tags are added yet.
Name | Mastery | Learn | Test | Matching | Spaced | Call with Kai |
|---|
No analytics yet
Send a link to your students to track their progress
50 Terms
Descriptive Statistics
Summarizes and describes data characteristics collected by the researchers
Measure of Central Tendency
Identifies the central point around which some of the data tends to cluster
Mean
- represents the average of all the data points
- most commonly used in descriptive statistics
- typically calculated with ratio or interval level data
Median
represents the value that is in the middle of the data points
Mode
represents the value that occurs most frequently in the data set
ratio or interval level data
represents actual quantities of something with discrete increments between each value
Variability
the degree to which scores are distributed around the central value
Standard Deviation
a value that summarizes the average absolute distance of all the individual scores from the mean scores
How is a relative variability expressed as percentage?
coefficient of variation (CV)
Standard Error of Measurement (SEM)
degree of error associated with how much a measurement will vary from the original value each time it is repeated
Standard Error of the Mean (SEM)
provides an assessment of the variation of errors that occurs when repeated samples of a population are drawn
Positively Skewed Distribution
Tail on the right side of the distribution.
What side of the bell curve is the "skew" associated with?
the small tail side
What % falls between 1 SD of the mean?
68%
What % falls between 2 SD of the mean?
95%
Effect Size
descriptive statistics used to provide information about the magnitude of study findings
Which is used to describe nominal level data: mean, median, or mode?
Mode
What measures characterize variablitiy?
range, standard deviation and/or interpercentile range
What does a bigger standard deviation (SD) indicate?
greater variability in the data set
what is the limitation of using range for variability?
it does not provide information about each score
How is the coefficient of variation (CV) calculated?
- dividing the standard deviation (SD) by its mean
- units of measurement cancel out allowing for comparison between or among different types of measures
- typically used to evaluate data that have been collected one time
SEM for a manual goniometer was noted previously to be +/- 4°. Consider the patient who is working to recover knee flexion after an operative procedure. Physical therapists commonly measure the affected joint before and after providing interventions. If the increase in range of motion is between 1° and 4°, then it is likely that _________________ is at work.
standard error of measurement
what does "normally distributed" mean?
- data that create a bell curve
- a predictable % of the scores can be located between 1,2, or 3 SD away from the mean score
bell curve
foundation for a group of tests referred to as parametric statistics
What % fall between 3 SD of mean?
99.7%
- Height
- Weight
- Diagnosis(es)
- Number and/or type of comorbidities
- Health or functional status
- Mental or cognitive status
- Type of assistive device required for mobility
- Number and/or type of medications
- Number and/or type of diagnostic tests
Subject characteristics: clinical information
- Age
- Sex
- race/ethnicity
- Education level
- Socioeconomic status
- Employment status
- Marital status
- Presence and/or type of insurance
Subject characteristics: demographics
differences between or among groups
effect size between 0 and 1
- 0.20
- 0.50
- 0.80
effect size: 0.20
small effect
effect size: 0.50
moderate effect
effect size: 0.80
large effect
differences in relationship between or among variables
effect size between -1 and 1
(0.1 to 0.3 OR -0.1 to -0.3)
(0.3 to 0.5 OR -0.3 to -0.5)
(0.5 or greater OR -0.5 or greater)
effect size 0.1 to 0.3 OR -0.1 to -0.3
small effect
Based on the range of ages in the subject pool, you would expect a plot of these data to create a curve that is:
normally distributed (bell shaped)
3 multiple choice options
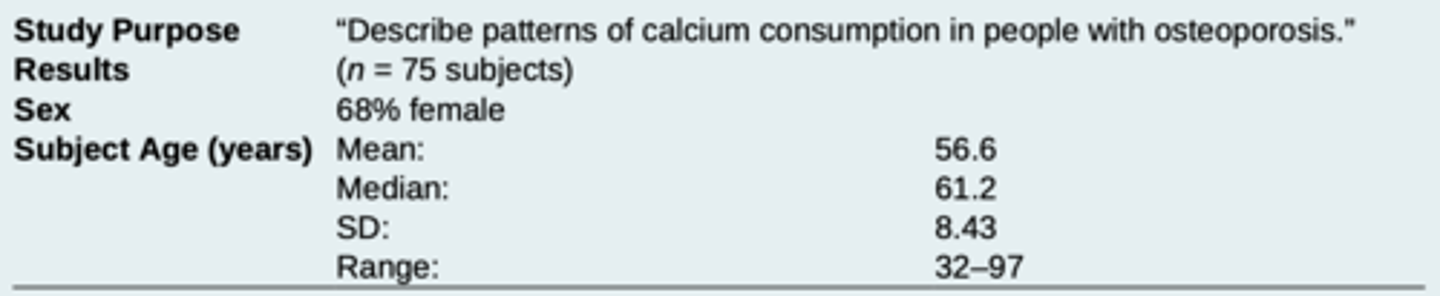
The variable "sex" is quantified using which descriptive statistic?
percentile
3 multiple choice options

A sampling distribution data indicates a mean of 63. The SD of the error terms in this sampling distribution is referred to as the:
standard error of the mean
3 multiple choice options

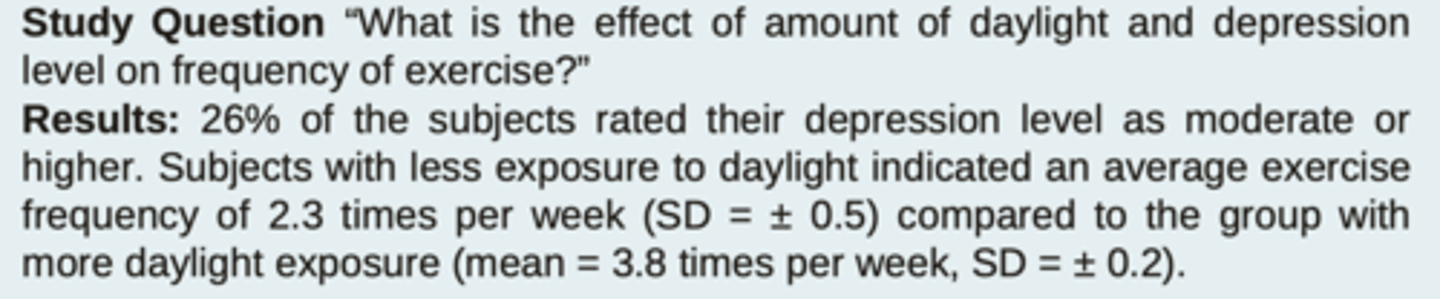
what is the absolute effect size in this study?
1.5
3 multiple choice options

What does the SD of "+/-5" represent?
variability of data points around the mean
3 multiple choice options

The subjects rated their depression using the following scale: 0 = none, 1 = mild, 2 = moderate, 3 = severe. The most frequent response selected was 1 (mild). Which of the following does this result represent?
the mode
3 multiple choice options
z-score
- statistical measure that quantifies the distance between a data point and the mean of a dataset
- expressed in terms of SD
A measure of central tendency is conducted on for a study that investigates pain related to region of the body. Subjects are to choose the region of the body where pain is most prevalent with categories of "head" "Upper trunk" "Lower trunk" "Arms and Hands" and "Legs and feet." What type of central tendency is most appropriate?
Mode
3 multiple choice options
When analyzing scores of a dataset, the frequency of the number 20 was most prevalent. What type of descriptive statistic is indicated?
Mode
3 multiple choice options
What is Type II Error?
Failure to reject a null hypothesis that is actually false (false negative)
3 multiple choice options
Which of the following statistics is a measure of central tendency?
Mean
3 multiple choice options
The results of an ordinal data set are: 5, 5, 10, 15, 10, 5, 20. What is the median?
10
3 multiple choice options
The results of an ordinal data set are: 5, 5, 10, 15, 10, 5, 20. What is the mode?
5
3 multiple choice options
Why are samples important to use within research design?
With enough subjects, results are more generalizable to a population
3 multiple choice options
Where does 95% of the population fall in a normal distribution?
2 SDs above and below the mean
3 multiple choice options
Results of a research study indicate a 0.8 effect size. How would this value be interpreted?
large effect size
3 multiple choice options
A researcher scores students on their ability to pass an exam. Approximately 60% of the scores were >95, 20% of scores were between 70-95, and the remaining 20% were below 70. What kind of distribution would you expect based on these results?
negative Skew
3 multiple choice options