Swing Trading
 Call Kai
 Learn
Learn Practice Test
 Spaced Repetition
 Match
Match Flashcards
 Knowt Play
1/60

There's no tags or description
Looks like no tags are added yet.
Name | Mastery | Learn | Test | Matching | Spaced | Call with Kai | Chat |
|---|
No analytics yet
Send a link to your students to track their progress
61 Terms
get as much swing of the trend as possible
what is the goal of swing trade
trend! long when it's up and short when it's down
We always trade with the
support and resistance ranges
You can also trade in
on pull back (buy the dip) after the trend appears to resume. Your minimum target should be the previous higher high.
In an uptrend aim to buy
on a rally (sell the tip) after the trend appears to have resumed. Your minimum target should be the previous lower low
In a down trend aim to sell
just beyond the recent higher low or lower high
Place your stop
minimum 2 to 1 reward risk ratio
Always have
don't want to be glued to their screen each day
for those who
the week of or week in advance
scan for opportunities when?
2-6 days and sometimes longer
Swing positions last for
daily, 240, then 60 for entries
Which time frames should you use?
checking in on it daily for a few times a day
Manage your position by
Stay with the trend or trade reversals at key areas
two ways to swing trade
your longer term trend
Trade i n harmony with
only on the short term chart when swing trading
Never trade
near the beginning of the trend, not the end
enter the trade
risk to reward ratio and make sure the offs are in your favor at least 2 reward : 1 ratio
determine your
1. Market trend identification
2. Stock selection
3. zone definition
4. Volume and Index Analysis
5. Entry Trigger
6 Exit Trigger
6 Steps in swing trading
use 240 or daily and apply dow theory/elliot wave to determine major trend direction
Market trend identification
8 EMA, 20 SMA, 50 SMA
Which indicators for swing trading
Uptrend
if 8 EMA > 20 SMA
Downtrend
If 8 EMA < 20 SMA
first support or resistance area
50 SMA acts as your
Finviz.com
Where can you go to find stocks?
Look for market leaders and established brands, companies that you believe will be around
criteria for stocks?
on your higher time frames first and color the lines in pairs to tell them apart
First Draw your buy & sell zones
buy and sell zones on the smaller timeframe next, you can also style your lines to tell between weekly and monthly
Second draw your
then there's heavy supply or demand. if price stalls and reverses on high volume, look for an entry signal in the trend direction.
If volume goes up by 50% or more than the average
index, and the other major indices. At least 3 out of 4 should agree on the direction
Check you stock against its
Dow 30 established large cap, s&P 500 companies by market cap, nasdaq 3K companies , NYSE 2k stock small to large
Indices
confirm direction
moving averages
act as trigger
MACD
Early warnings if trade is going to run out of steam
awesome oscilator
it tells us important information for confirming price action
When macd line crosses signal line
equally important, show shift in power
MACD line crossing zero line is
bullish
On higher timeframe when macd line is above signal line trend is
bearish
On higher timeframe when macd line is below signal line trend is
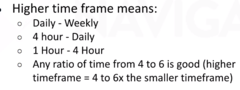
4-6 times higher timeframe
what does higher timeframe mean?
5, 34 and 8
the settings for macd
5 period sma and 34 period sma
AO is the difference between a
trading on the right side of the market and momentum
AO keeps us ...
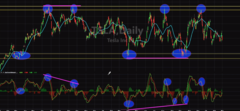
1) Price moves to test buy/sellzone, trend line, fib level etc.
2) Price & MACD show divergence
3) MACD histogram show strong momentum
4) Price reverses to reject the level
Entry Trigger : Momentum reversal

momentum reversal divergence
this is an example of
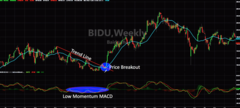
1) Trend lines, support and resistance, buy / sell zones etc.
2) MACD shows low momentum
3)Price rejects the zone or breaks the line
Entry Tigger: High Probability Break outs
High probability breakout
this is an example of
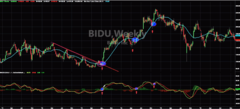
1) Using the 20 SMA, wait for price to test that level
2) Watch for MACD line to cross above the signal line
Entry Trigger: MACD as SMA pullback confirmation
MACD as a MA pullback confirmation
This is an example of
We look to be long
When AO crosses above the zero line
we look to be short
When ao cross below the zero line
MACD line above/below zerio line
Watch also for crosses of
the macd line crossing
Look carefully for oscillator divergences that are confirmed by
divergences
These are examples of
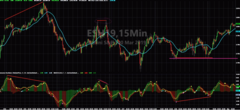
1) price rejection at key levels
2) oscilators crossing zero lines in direction of rejection
3) price vs oscillator divergence
4) macd line crossing signal line/zero line
more the better
You need at least 2 of these things to take a swing trade
1) you see counter trend divergence on AMACD
2) Oscillator crosses zero line counter trend
3) double top or bottom patterns form
4) dow theory (failure to make a HH & break of HL, failure to make LL & break of LH)
Take profits when part 1
5) trendline break
6) buy/sell zone target reached
7) elliot wave count completed at Fibonacci retracement/extension
Take profits when part 1
1) Are we in an uptrend or downtrend
2) What wave are we in?
3) Wave 1,3,5
4) Wave 2,4?
5) Wave ABC?
Swing trading checklist part 1
6) Start with larger timeframe, monthly, weekly and determine trend
7) move to daily chart and do the same
8) Use 60 min chart to find entry, enter when this short term trend match daily confirmed by technical analysis and indicators
9) Look at how long the trend has already run, be careful if joining an older trend that might be running out of steam
Swing trading checklist part 2
1) entry price (limit order)
2) profit target (where you will get out with profit)
3) stop loss (where you will get our with loss)
4) add on price (where you will add to the trade)
Ever trade should plan these 4 things, never place trade without knowing these
very short, avoid this
you profit window for counter trend directions are
1) 2:1 reward to risk
2) Losing trade is only a loss if you learn nothing, analyze all trades carefully and do more of what worked
3) This is a game of personal psychology, commit to mastering your own mind
Trade exit plan 3 items
variety of industries
what stocks to choose