Combined set: topic 3
1/112
Earn XP
Description and Tags
Name | Mastery | Learn | Test | Matching | Spaced | Call with Kai |
|---|
No analytics yet
Send a link to your students to track their progress
113 Terms
Market - defintion
A voluntary meeting of buyers and sellers
What makes a market competitive?
A large number of buyers and sellers
Ruling price - definition
Price of goods which is set by the collective supply and demand in a market, rather than from individual decisions.
Demand - definition
The amount of goods/services that a customer is willing and able to buy
What is effective demand?
When a customer wants and can afford a good.
If they can’t afford it but desire it, not effective.
Law of demand - definition
There’s an inverse relationship between price + quantity demanded of a good.
(as long as ceteris paribus)
As price goes up…
Demand goes down ( and vice versa)
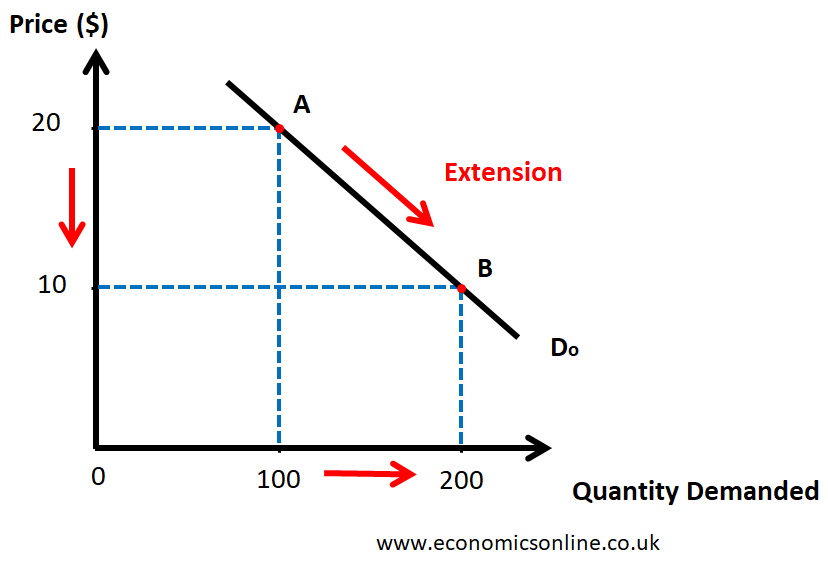
What do movements along the line show in a demand curve?
Changes in price of a good/service, which causes the demand for that good to change.
What’s the independent and dependent variable of the demand curve?
Independent - Price
Dependent - Quantity demanded
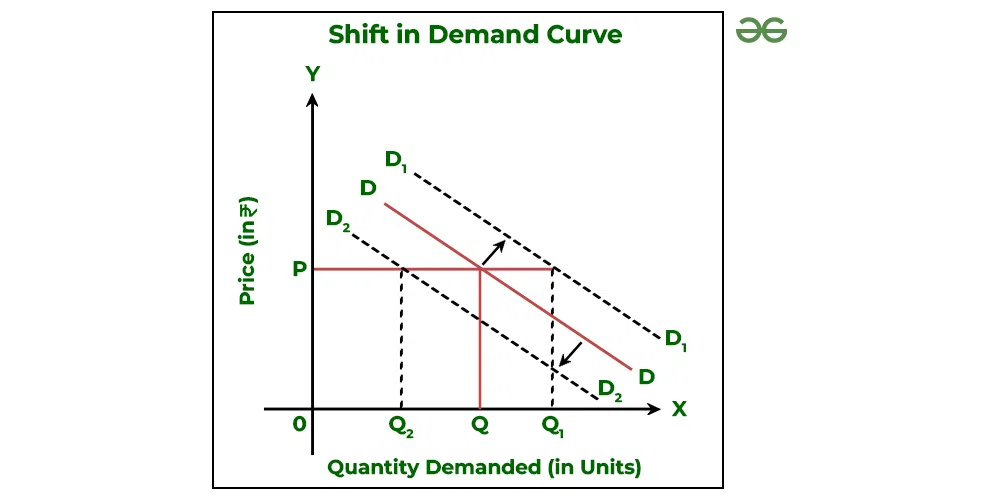
What does a demand curve shifting mean?
When demand changes not due to price change, but other factors.
How do demand curves shift?
Inwards = lower demand at the same price.
Outwards = higher demand at the same price.
Normal goods - definition
One where if prices rise, demand will fall and vice versa.
Inferior goods - definition
One where demand decreases as incomes increase, as they are affordable but aren’t of high quality
What are the conditions of demand? (7)
(factors other than price that change demand, causing the line to shift)
P- Population
I- Income
R- Related goods
A- Advertising
T- Tastes and fashions
E- Expectations
S- Seasons
Population - explained
The larger the population, the higher the demand
Age demographics change demand too.
Income - explanation
If consumers have more disposable income, they can afford more goods, so demand increases (Positive goods)
Inverse relationship with inferior goods, as incomes increase, demand will fall.
Related goods: two types
Substitute and complimentary.
Substitute goods - definition and explanation
A good that can replace another good, like pepsi and coke.
If coke prices increase, demand for pepsi will increase as it becomes the more affordable option - positive relationship
Complimentary goods - def and explan
A good that goes with another good, like strawberries and cream.
If strawberry prices increase, demand for cream will fall as less will be buying strawberries, so fewer buying cream. - Inverse relationship
Advertising - definition
This will increase customer loyalty to the good, which increases demand.
Tastes and fashions - definition
Curve will shift if consumer’s tastes change, making a product in higher or lower demand.
Expectations - definition
This is the expectation of future price changes.
If people think prices will increase in the future, demand for the good now will increase.
Seasons - explanation
Demand changes according to the season.
What are veblen goods?
A special type of good identitfied by the economist veblen.
The ‘snob effect’ - people pay more for certain products as their price increase, due to the increased status from buying higher priced goods.
What are giffen goods?
Inferior goods which defy the general rule for these types of goods - demand for them increase as incomes increase.
Mainly staple products like bread potatoes and rice, which have no substitutes and are still desired even with higher incomes.
What does the theory of elasticity look at?
The sensitivity of one variable in relation to another
What’s the price elasticity coefficient?
The measure of the response of demand in response to the change of price
Q: What is the equation to calculate the Price Elasticity of Demand (PED)?
A: PED = (% Change in Quantity Demanded) / (% Change in Price)
What do different PED values indicate?
If PED < -1: Elastic
If PED is between -1 and 0: Inelastic
If PED = -1: Unitary elastic
If PED = 0: Perfectly inelastic
If PED = ∞: Perfectly elastic
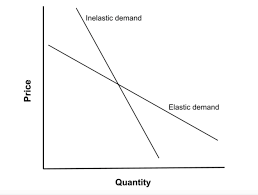
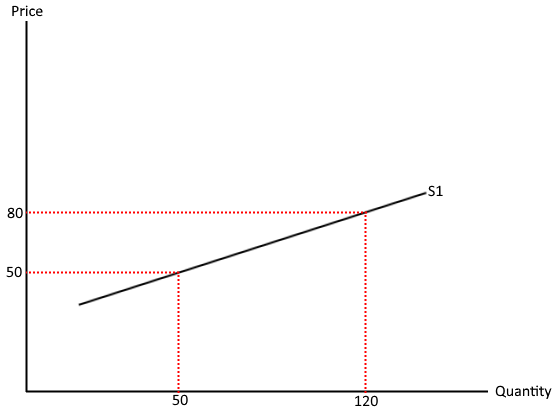
Price elastic good - definition
Change in price leads to an even bigger change in demand.
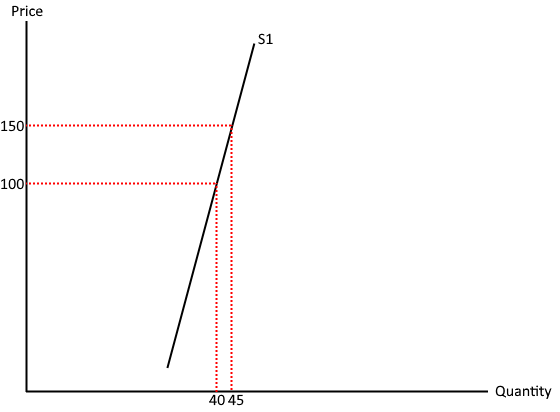
Price inelastic good - definition
One that is relatively unresponsive to change in priceU
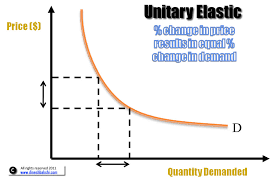
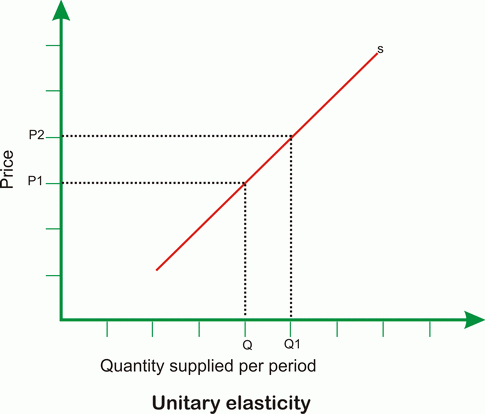
Unitary elastic good defintion
One where the change in demand is equal to the change in price
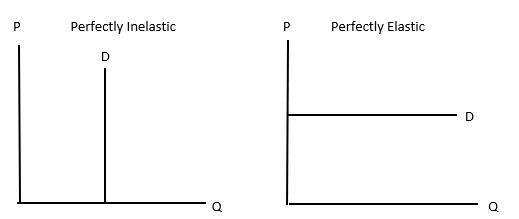
Perfectly inelastic good - definition
One where its demand doesn’t change when price changes
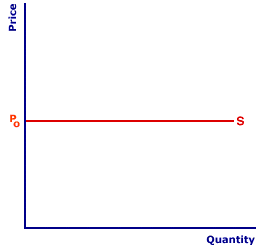
Perfectly elastic good - definition
One where its demand falls to zero when price changes
How should you change prices to maximise revenue with inelastic vs elastic goods?
Inelastic: Should increase the price, as % demand won’t decrease as much as % price will increase
Elastic: Should decrease the price, as %demand will increase more than % price will decrease.
Inelastic vs elastic graph
Unitary elasticity graph
Perfectly elastic vs inelastic demand graphs
Factors influencing PED (6)
Necessity
Substitutes
Addictiveness/ habitual consumption
Proportion of income spent on the good
Durability of the good
Peak and off-peak demand
How does the necessity of a good influence PED?
Necessities: Will have a relatively inelastic demand, as even if prices increases, people will still need them.
Luxuries: elastic, if prices increase demand will fall significantly.
Substitutes: How does it influence PED?
If goods have several substitutes then demand is more price elastic, as many other options if prices increase.
Long term: consumers have more time to respond and find a substitute so more elastic
Short term: more inelastic
Addictiveness: : How does it influence PED?
Not sensitive to a change in price, as people are addicted to them no matter what.
Proportion of income spent on good:: How does it influence PED?
If its low value, like an increase from £1.50 to £2, more inelastic than a high value good increasing from £15000 to £20000.
Durability of good: How does it influence PED?
If a good lasts a long time, demand is more elastic as consumers wait to buy another one
Peak/off peak demand: How does it influence PED?
During peak times for train tickets, e.g. demand is more inelastic as people have to buy them even if prices go up.
Total revenue equation
Average price x quantity sold
What is income elasticity of demand?
How sensitive quantity demanded is to changes in consumer income
What is the income elasticity of demand equation?
YED = % Δ in quantity demanded/ % Δ in income
Y = income
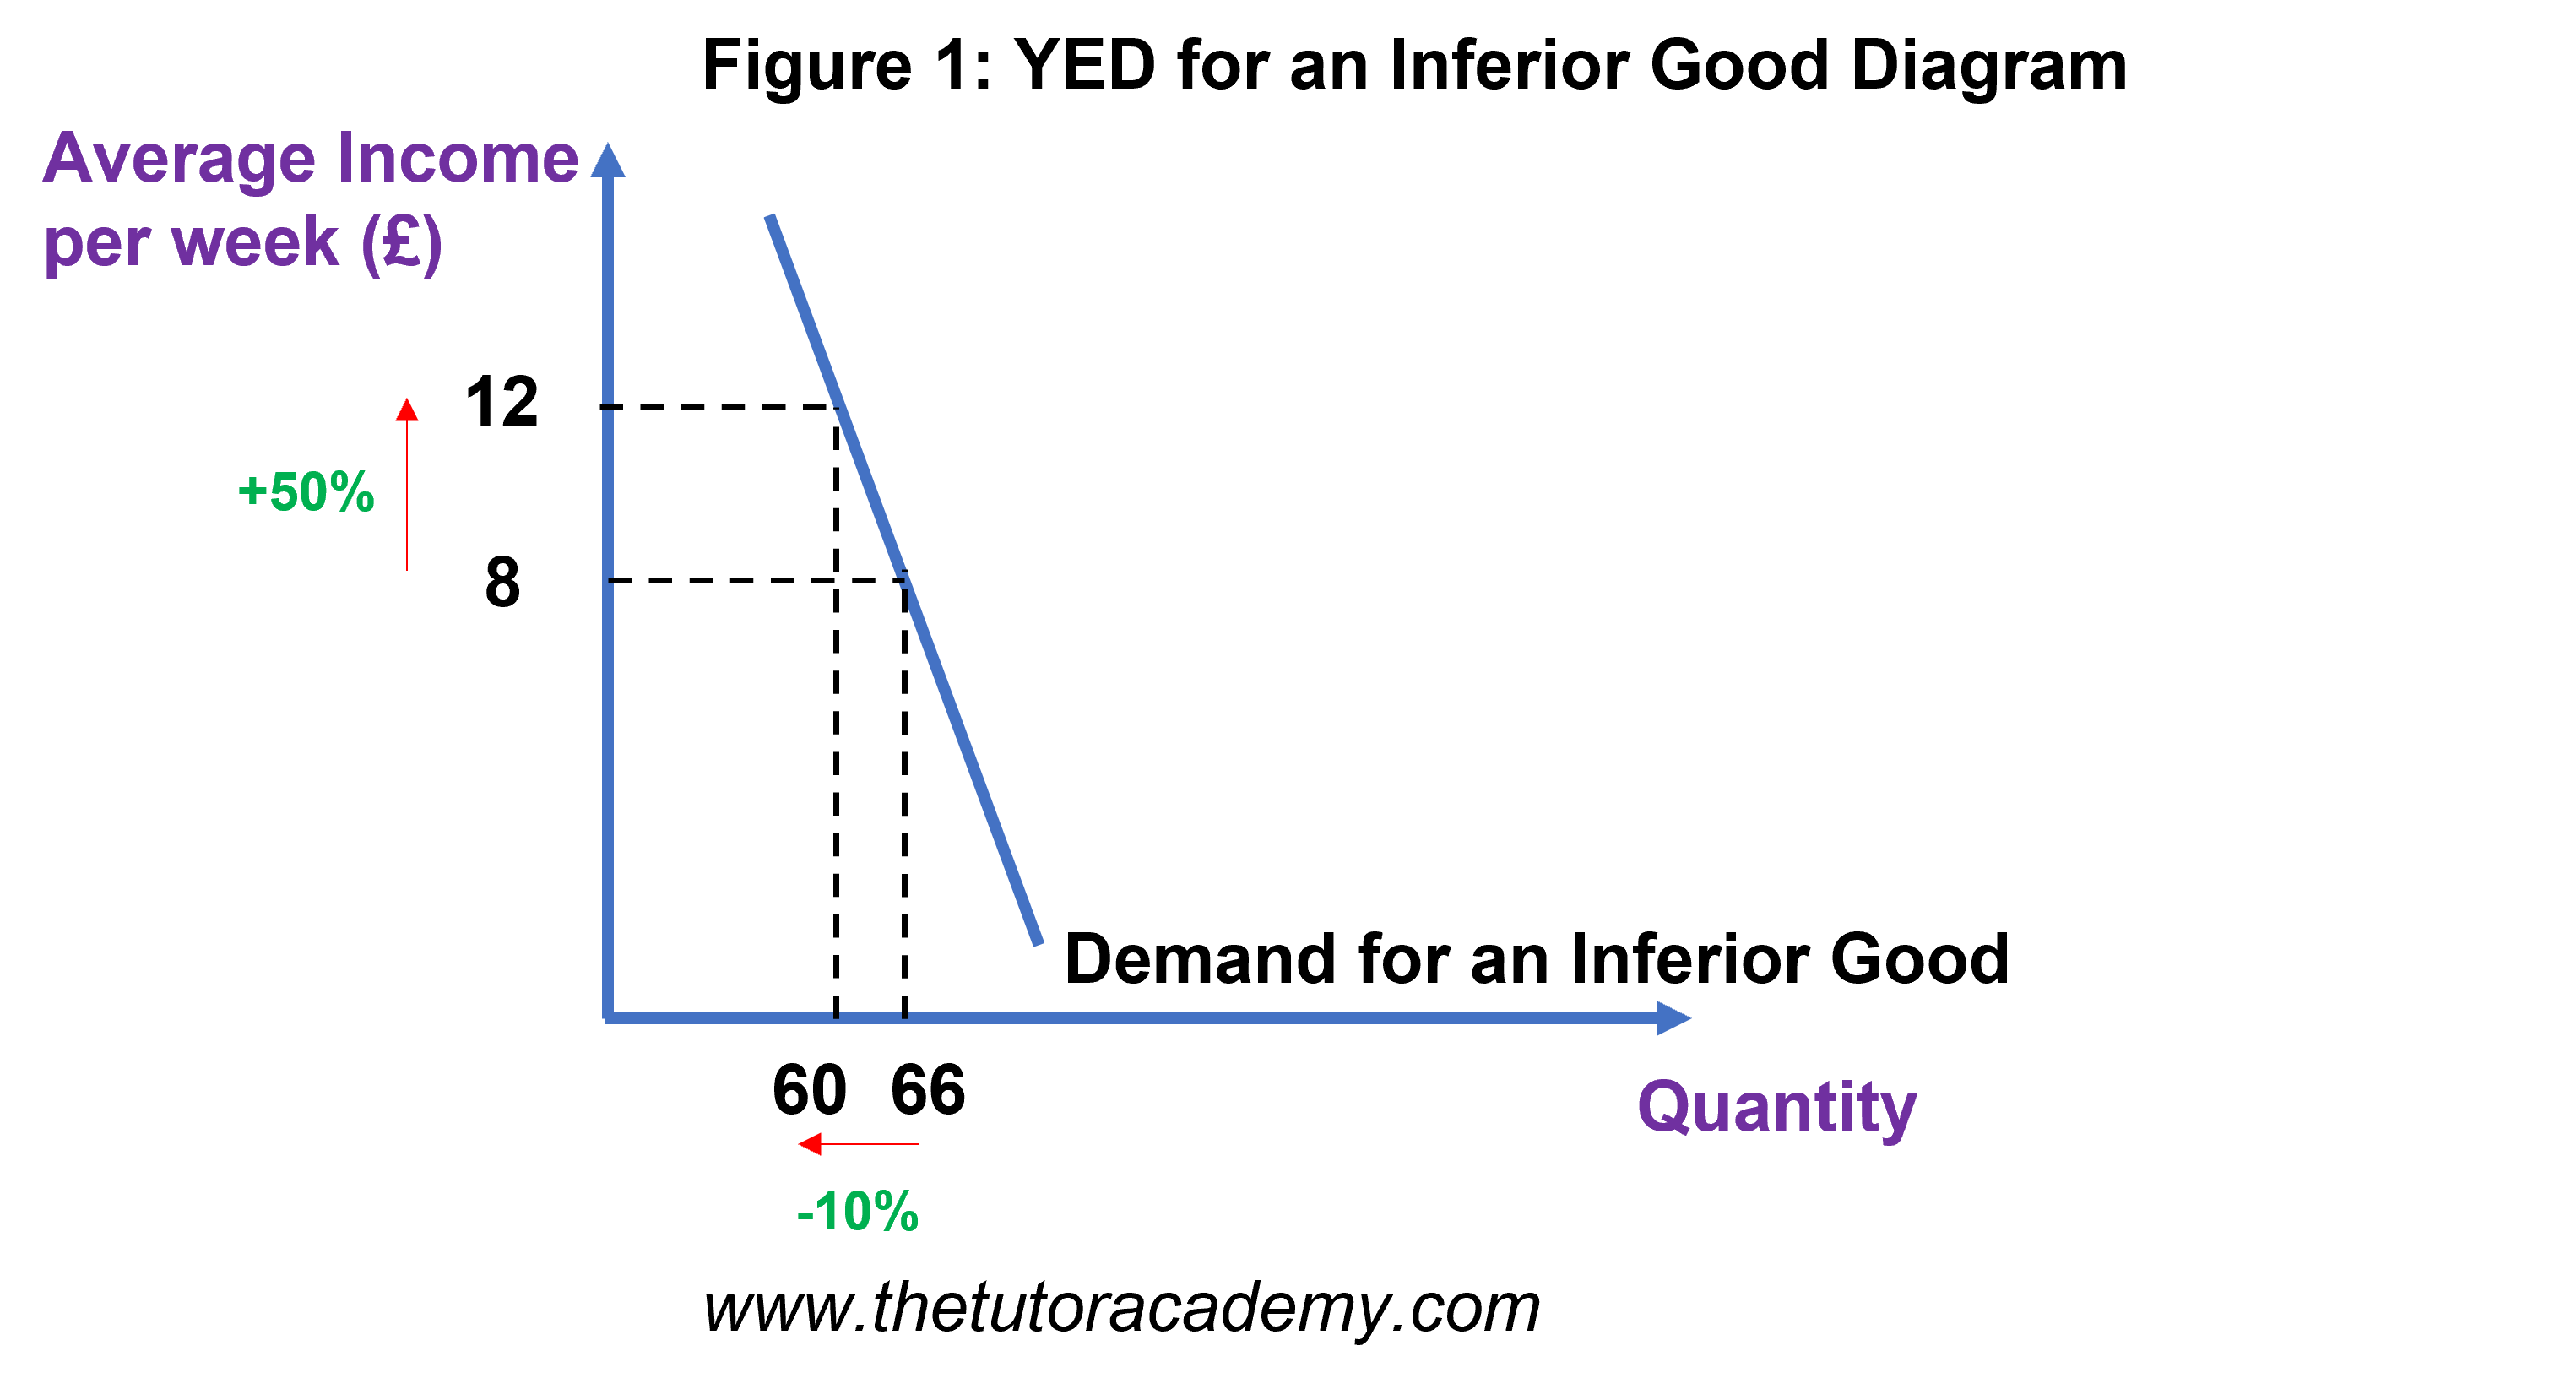
What are the YED values of inferior goods and why?
Negative values - as income increases, demand decreases, inverse relationship
Low quality goods like own brand items.
Between 0 and -1 - inelastic
Less than -1 - elastic
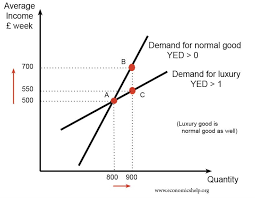
What’s the YED value for normal goods
Between 0 and 1 - Demand increases with income, but at a decreasing rate
Inelastic, but positive relationship - necessities
Whats the YED value for luxury goods?
>1 - demand increases significantly with income.
Elastic and positive relationship
What does the YED graph look like for normal (necessity) goods (0-1) and luxuries (1+)
What does the YED graph look like for inferior goods?
This graph: inelastic inferior
Elastic would be a less steep line
What is Cross price elasticity of demand?
The responsiveness of the quantity demanded of one good to a change in the price of another related good.
What does XED analyse the relationship between?
Complementary and substitute goods
XED formula
%change in QD of good A/ %change in price of good B
Meaning of different XED values
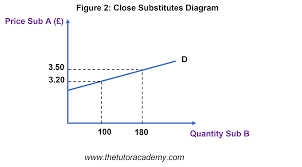
Positive: Substitute
0-1 (inelastic) : weak substitute, >1 (elastic) is strong substitute
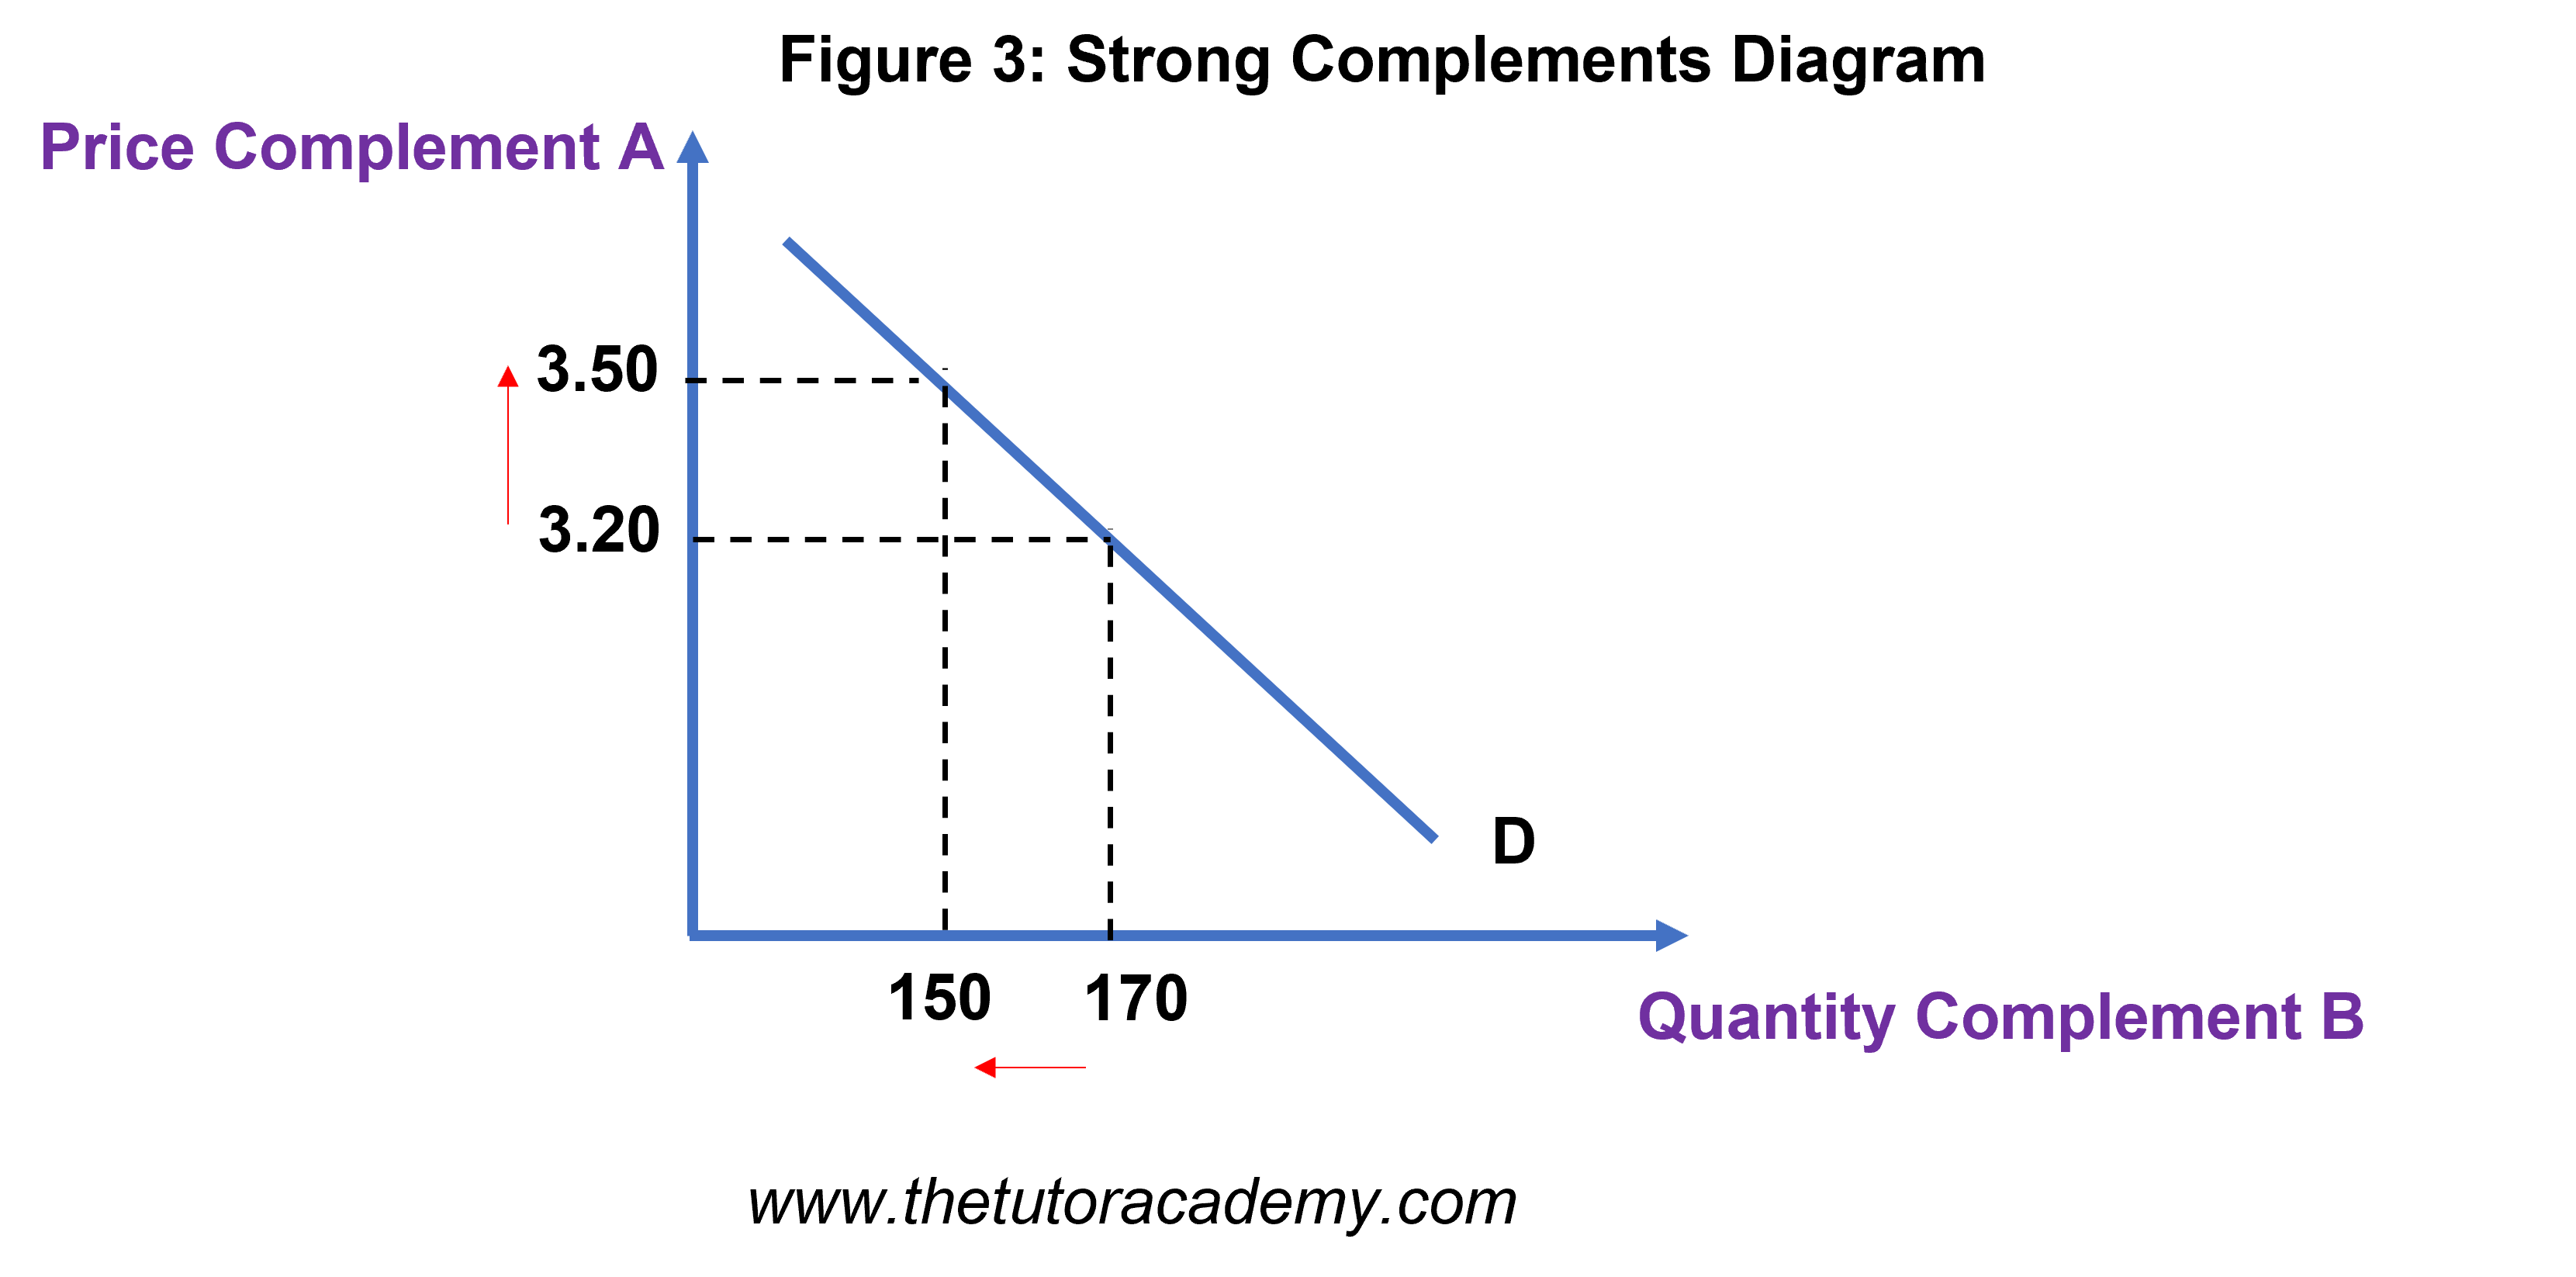
Negative complement
0- -1 (inelastic) : weak complement, < -1 (elastic) is strong complement
Why is XED for substitutes positive
Increase in the price of once product will lead to more demand for its substitute as people seek alternatives.
What does a strong substitute mean?
Goods are closely related, so consumers are more likely to switch between products.
What does an XED graph look like for a substitute?
If it was a less closely related substitute, line would be steeper, as Good A has a lesser effect on good B
Why is the XED for complementary goods always negative?
Example: if prices of smartphones increase, they will have a lower demand, so cases will also see a drop in demand.
What do XED graphs for complements look like?
Negative gradient
A weak complement would have a less steep line, as the goods have a lesser relationship with each other.
What does an XED of 0 mean?
The goods are unrelated, there’s no relationship between the two goods
The closer to 0, the weaker the relationship between two goods.
Supply - definition
Quantity of a good or service that a supplier is willing and able to produce at a given price during a given time period
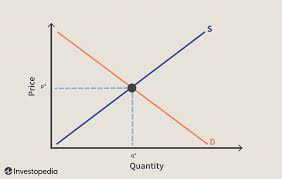
What does a supply curve look like

Why is a supply curve upwardly sloping?
Price and quantity supplied have a positive relationship.
Why do price and QS have a positive relationship?
If price increases, it’s more profitable for firms to produce the good, so supply increases
High prices also attract more new firms as it is profitable
With larger outputs, firms’ costs increase so prices must rise
What do movements along the curve show?
An increase/ decrease in price, which cause an increase / decrease in quantity demanded
Extension/contraction
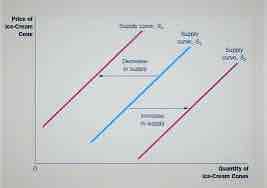
What do shifts in a supply curve show?
A change in quantity supplied at the same price, caused by other factors
Leftward shift = Inward (less QS)
Rightward shift = outward (more QS)
What are factors that shift the supply curve (7)
Changes to costs of production
Government policy
Technology
Change in no. of firms in the industry
Weather events
Future price expectations
Goods in joint or competitive supply
Changes to costs of production: How do they affect supply?
If prices to produce increase, firms will respond by decreasing supply
Inverse relationship
Government policies: Two types
Subsidies
Taxes
Subsidies: How do they affect supply?
Impacts cost of production, more subsidies = cheaper to produce = more supply
Positive relationship
Taxes: How do they affect supply?
Opposite to subsidies, higher taxes = higher cost of production = lower supply
Inverse relationship
Technology: How does it affect supply?
New technology increases productivity and efficiency, which decreases production costs, so supply increases
Aging technology has the opposite effect, more inefficient
Changes in the number of firms in the industry: How do they affect supply?
More firms in an industry = higher supply, as more producers
Direct relationship
Weather events: How do they affect supply?
Extreme weather can cause a supply shock usually in agricultural markets, which will decrease supply
Conversely, good conditions will increase supply of crops
Future price expectations: How do they affect supply?
If firms expects the price of a good/service to increase in the future, they will increase supply and vice versa.
Direct relationship
What are goods in joint supply and how does this affect supply?
Ones involving a process which yields multiple outputs, like beef and leather
If supply of beef increases, maybe due to price, supply of leather will also increase.
Positive relationship
What are goods in competitive supply and how does this affect supply?
When alternative products can be made with the same resources, e.g. a farmer can grow wheat or potatoes
When supply of one good (potatoes) increases, the supply of the other good (wheat) will decrease.
Inverse relationship
What is price elasticity of supply (PES)
Measures the responsiveness of supply to a change in price
How to calculate PES
% change in quantity supplied/ %change in price
What is true for all goods’ PES value?
Will be positive, as supply and price have a positive relationship
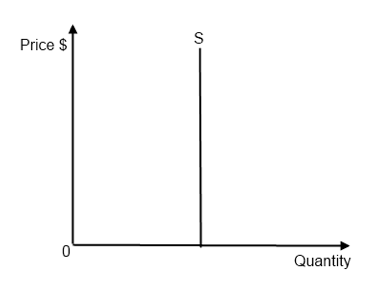
What does a PES of 0 show?
Perfectly inelastic, supply will never change no matter the price
What does a PES between 0-1 mean?
Relatively inelastic - % change in quantity supplied is less than % change in price
What does a PES of 1 show?
Unitary elasticity - price and quantity supplied increase by the same %, directly proportional
What does a pes > 1 mean?
Relatively inelastic - QS will increase by more than price increases (% wise)
What does a PES of infinity mean?
Perfectly elastic - %change in QS will fall to 0 for any % change in price
What are the 5 factors that influence PES?
Mobility of the factors of production
The rate at which costs of production increase
Ability to store goods
Spare capacity
Time period
Mobility of the factors of production - how does this affect PES?
If producers can quickly switch their resources between products, then PES will be more elastic as quantity supplied can change easily
Rate at which costs of production increase how does this affect PES?
If the rate of marginal (one unit extra) cost increase is low, PES will be more elastic, as cheap to supply more
Ability to store goods: how does this affect PES?
If goods can be easily stored then PES will be elastic as supply can quickly be increased
Spare capacity: how does this affect PES?
If there’s capacity to produce more than current levels, then PES is elastic as supply can quickly be increased
Time Period: how does this affect PES?
In the short run, PES is often inelastic, as hard to increase supply quickly
In long run, PES is usually elastic, as time to change factors of production`
So what is the essence of the determinants of PES?
How easy it is for a firm to change how much of a good they produce in response to a change in price.
What is the market system
The interaction of supply and demand through negotiations between buyers and sellers, who meet an agreed upon price that works for both parties
Equilibrium price - definition
When demand = supply
Also known as market-clearing price
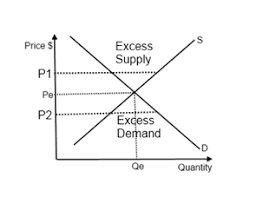
Disequilibrium - definition
Any price above or below the equilibrium price creates this, occuring when there’s excess supply or demand
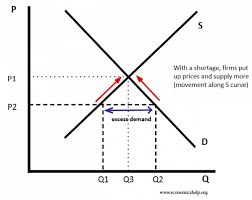
Excess demand and supply - definitions and graph
Excess demand: when demand> supply - caused by low prices
Excess supply: when supply> demand - caused by high prices
How do markets respond to excess demand?
There’s a shortage in the market, more is demanded than suppliers can produce.
This pushes prices up and causes firms to supply more (expands), since prices increase, demand will contract causing the price to return to the equilibrium price