Topic 7-Genetics, populations, evolution and ecosystems
1/54
Earn XP
Description and Tags
Name | Mastery | Learn | Test | Matching | Spaced |
|---|
No study sessions yet.
55 Terms
What is meant by the term genotype?
Genetic constitution of an organism
What is meant by the term phenotype?
The expression of this genetic constitution (genotype) and its interaction with the environment
What are alleles and how do they arise?
Variations of a particular gene (same locus) → arise by mutation (changes in DNA base sequence)
How many alleles of a gene can be found in diploid organisms?
● 2 as diploid organisms have 2 sets of chromosomes (chromosomes are found in homologous pairs)
○ But there may be many (more than 2) alleles of a single gene in a population
Describe the different types of alleles
Dominant allele —> Always expressed (shown in the phenotype)
Recessive allele —> Only expressed when 2 copies present (homozygous recessive) / NOT expressed when dominant allele present (heterozygous)
Codominant alleles—>Both alleles expressed / contribute to phenotype (if inherited together)
What is meant by the terms homozygous and heterozygous?
Homozygous- Alleles at a specific locus (on each homologous chromosome) are the same
Heterozygous- Alleles at a specific locus (on each homologous chromosome) are different
What do monohybrid and dihybrid crosses show?
● Monohybrid cross - inheritance of one phenotypic characteristic coded for by a single gene
● Dihybrid cross - inheritance of two phenotypic characteristics coded for by two different genes
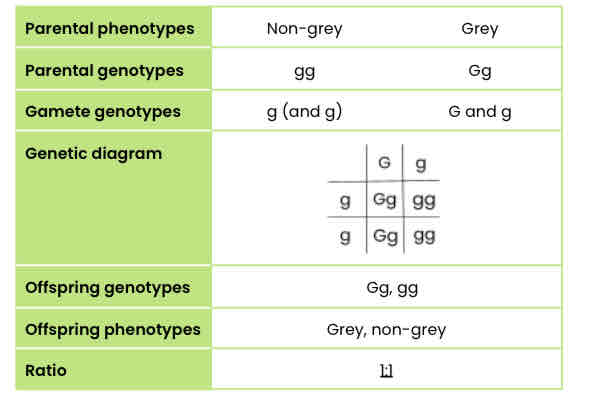
Worked example: monohybrid cross (basic)
The dominant allele for the grey gene (G) in horses results in a coat colour turning progressively grey.
The recessive allele (g) results in the normal coat colour being maintained (non-grey phenotype).
A non-grey female is crossed with a heterozygous male.
Draw a genetic diagram to show the expected ratio of phenotypes in the offspring.
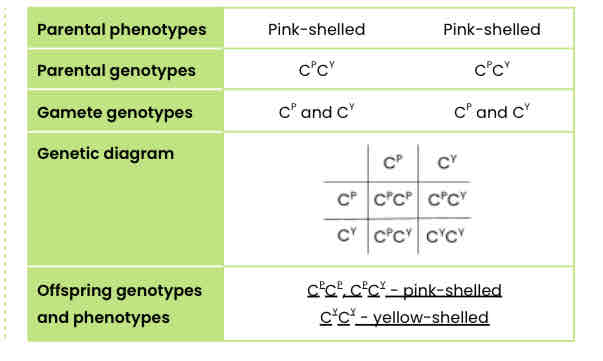
Worked example: monohybrid cross with multiple alleles
In one snail species, shell colour is controlled by a gene with 3 alleles. The shell may be brown, pink or yellow. The allele for brown (CB) is dominant to the other two alleles. The allele for pink (CP) is dominant to the allele for yellow (CY).
A cross between two pink-shelled snails produced only pink-shelled and yellow-shelled snails.
Use a genetic diagram to explain why.
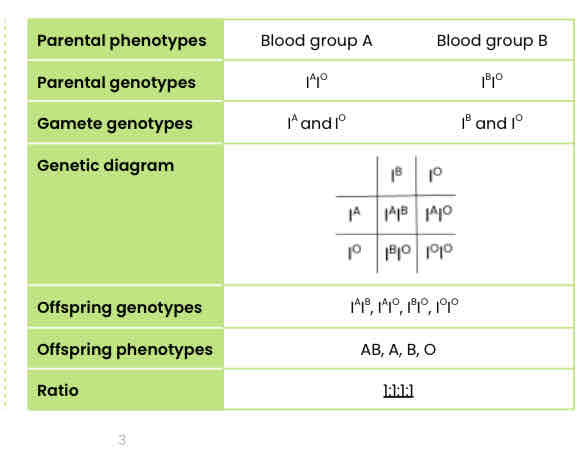
Worked example: monohybrid cross with codominance and multiple alleles
The inheritance of the ABO blood groups in humans is controlled by three alleles of a single gene, IA, IB and IO. The alleles IA and IB are codominant, and the allele IO is recessive to IA and recessive to IB.
Two heterozygous parents plan to have a child. One has blood group A and the other has blood group B.
Use a genetic diagram to show all the possible genotypes and the ratio of phenotypes expected in their offspring.
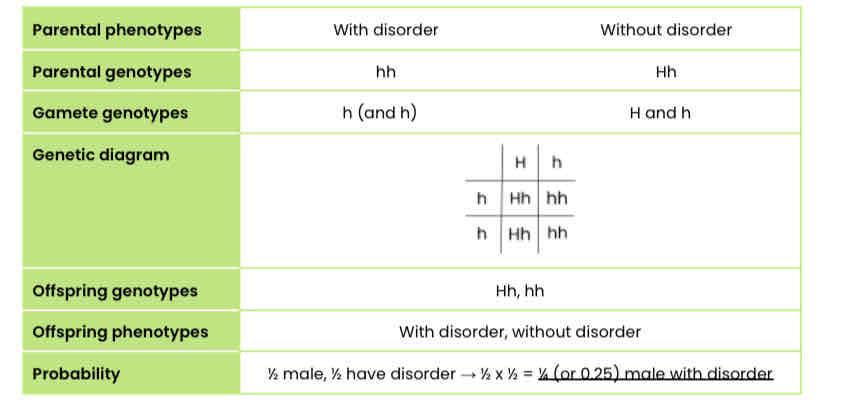
Worked example: monohybrid cross using a pedigree diagram
The figure shows the inheritance of a genetic disorder in a family.
Person 7 and person 8 plan to have another child. Determine the probability that the child will be a male who has the disorder. Use the symbol H for the dominant allele and h for the recessive allele.
In this example, we first have to use the pedigree diagram to work out whether the disorder was caused by a dominant or recessive allele. Since two parents without the disorder had a child with the disorder, it is caused by a recessive allele.
We also need to use the diagram to work out the genotypes of 7 and 8 (parents). Since 7 has the disorder, he must be homozygous recessive. 8 doesn’t have the disorder so must have at least one dominant allele. Since 7 and 8 have a child with the disorder, 8 must be heterozygous to have passed on the recessive allele.
The allele for colour blindness is carried on the ‘X’ chromosome.Colour blindness is more common in males than in females.
Why?
● Females (XX) have 2 alleles → only express recessive allele if homozygous recessive / can be carriers
● Males (XY) have 1 allele (inherited from mother) → recessive allele always expressed
What is a sex-linked gene?
gene with a locus on a sex-chromosome (normally X)
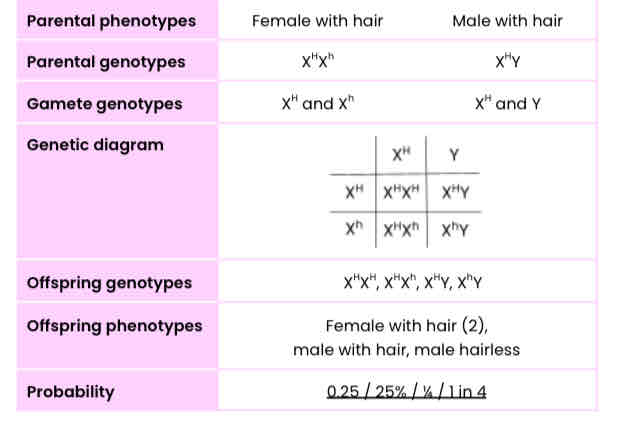
A single gene that’s carried on the X chromosome controls the presence of hair on the skin of cattle. Its dominant allele causes hair to be present and its recessive allele causes hairlessness.
A male and a female with hair have two hairless female offspring.
What is the probability that their next calf born is hairless?
What does the Hardy – Weinberg Theorem predict?
Predicts that frequencies of alleles will stay the same from one generation to the next.
What does the HWT assume?
• It assumes:
• a large population
• no immigration or emigration
• no random mutations which affect the phenotype
• no natural selection
• If the allele frequencies do change from one generation to the next, we know that this must be caused by one of the above. It’s a common way of showing that evolution must be happening.
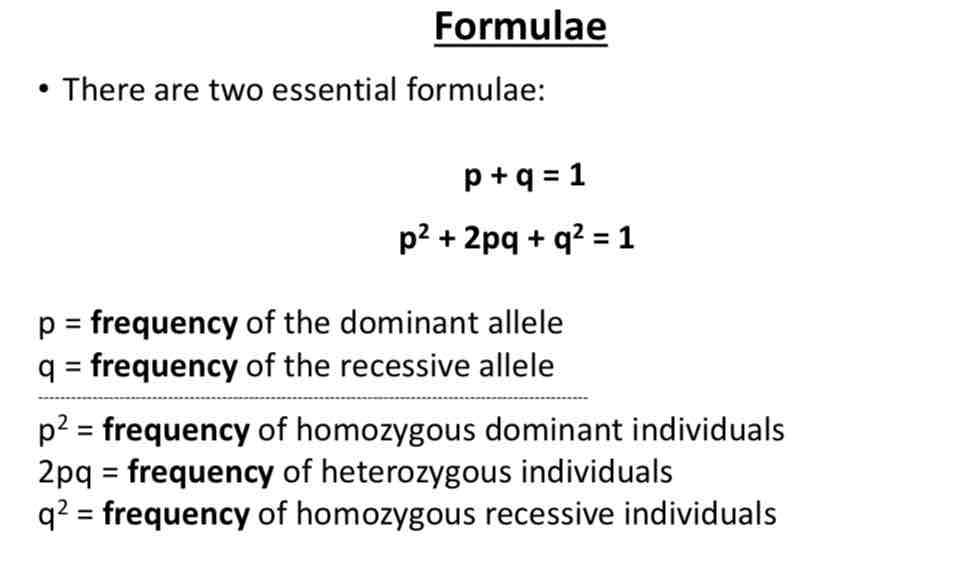
What are the 2 HWT formulae?
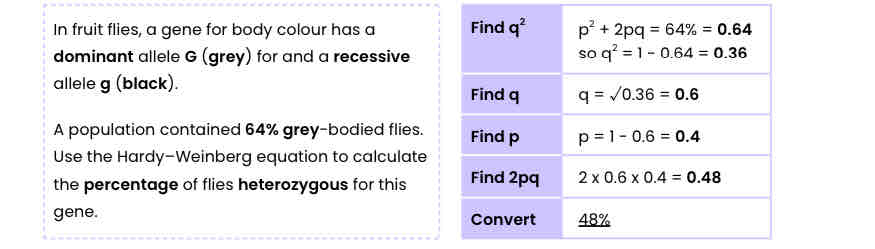
In fruit flies, a gene for body colour has a dominant allele G (grey) for and a recessive allele g (black).
A population contained 64% grey-bodied flies. Use the Hardy–Weinberg equation to calculate the percentage of flies heterozygous for this gene.
Worked example: using the Hardy-Weinberg equation (basic)
The gene for the Rhesus blood group has two alleles. The allele for Rhesus positive, R, is dominant to that for Rhesus negative, r.
16% of the population of Europe is Rhesus negative. Use the Hardy-Weinberg equation to calculate the percentage of this population that you would expect to be heterozygous for the Rhesus gene.
Find q2- q2 = 16% = 0.16
Find q-q = √0.16 = 0.4
Find p-p = 1 - 0.4 = 0.6
Find 2pq-2 x 0.4 x 0.6 = 0.48
Convert-48%
What’s an Autosome?
Any chromosome which is NOT the sex chromosomes
phrase ‘autosomal’ tells you immediately it is NOTHING
to do with X or Y chromosomes
Explain how autosomal linkage affects inheritance of alleles
● Two genes located on same autosome (non-sex chromosome)
● alleles on same chromosome inherited together
○ Stay together during independent segregation of homologous chromosomes
● crossing over between homologous chromosomes can create new combinations of alleles
○ If the genes are closer together on an autosome, they are less likely to be split by crossing over
In fruit flies, the genes for body colour and for wing development are not on the sex chromosomes. The allele for grey body colour, G, is dominant to the allele for black body colour, g. The allele for long wings, L, is dominant to the allele for short wings, l.
A cross was carried out between flies with grey bodies & long wings (heterozygous for both genes) and flies with black bodies & short wings.
The result of this cross was 225 offspring with a grey body & long wings and 220 with a black body & short wings. Explain these results.
● The two genes are linked / autosomal linkage
● No crossing over occurs / genes are close together
● So only GL and gl gametes produced / no Gl and gL gametes produced / no Ggll and ggLl offspring produced

In tomato plants, the genes for height and for the type of leaf are on the same homologous pair of chromosomes. The allele T, for a tall plant, is dominant to the allele t, for a dwarf plant. The allele M, for normal leaves, is dominant to the allele m, for mottled leaves
Crosses were carried out between plants heterozygous for both genes. The position of the two alleles for both genes was the same in each parent plant as shown in the diagram.
Explain the results in the table. Give the expected ratio of phenotypes if the genes for height and type of leaf were on different homologous pairs of chromosomes.
● Genes are linked (so mainly TM and tm gametes are produced)
● Crossing over has occurred
● So few Tm and tM gametes produced / fewer tall, mottled and dwarf, normal offspring produced
● If not linked (use punnett square) - 9:3:3:1 (tall, normal : tall, mottled : dwarf normal : dwarf, mottled)
What is epistasis?
Interaction of non-linked genes where one masks expression of other.
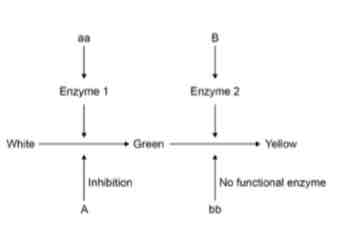
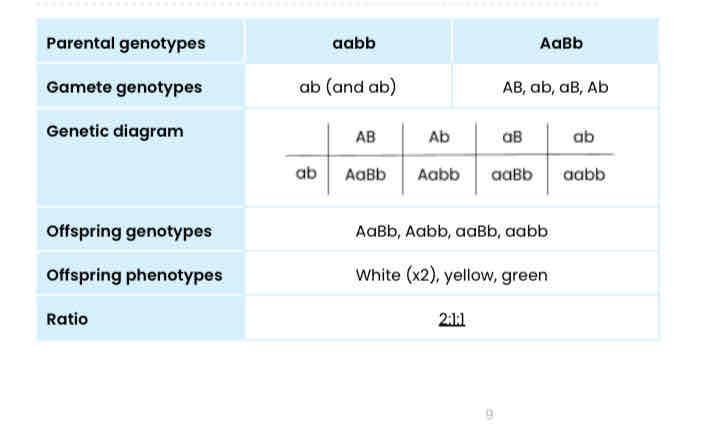
The inheritance of fruit colour in summer squash plants is controlled by two genes that are not linked, A and B. Each gene has two alleles. The diagram shows the interaction of these two genes.
Complete the genetic diagram to show all the possible genotypes and the ratio of phenotypes expected in the offspring of this cross.
Explain why individuals within a population of a species may show a wide range of variation in phenotype
● Genetic factors
○ Mutations = primary source of genetic variation
○ Crossing over between homologous chromosomes during meiosis
○ Independent segregation of homologous chromosomes during meiosis
○ Random fertilisation of gametes during sexual reproduction
● Environmental factors (depends on context - eg. food availability, light intensity)
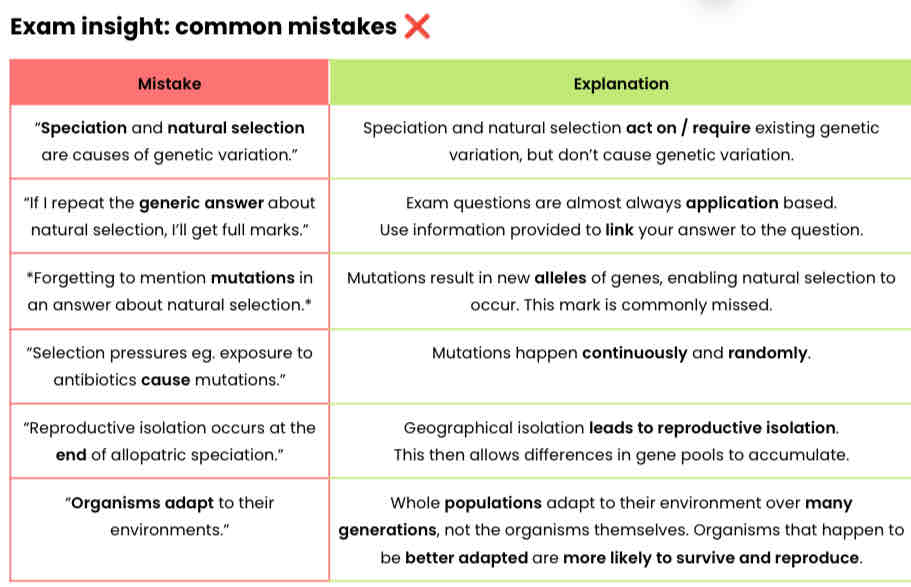
What is evolution?
● Change in allele frequency over time / many generations in a population
● Occurring through the process of natural selection
Describe factors that may drive natural selection
● Predation, disease and competition for the means of survival
● These result in differential survival and reproduction, ie. natural selection
Explain the principles of natural selection in the evolution of populations
1. Mutations- Random gene mutations can result in [named] new alleles of a gene
2. Advantage- Due to [named] selection pressure, the new allele might benefit its possessor [explain why] → organism has a selective advantage
3. Reproductive success- Possessors are more likely to survive and have increased reproductive success
4. Inheritance-Advantageous allele is inherited by members of the next generation (offspring)
5. Allele frequency-Over many generations, [named] allele increases in frequency in the gene pool
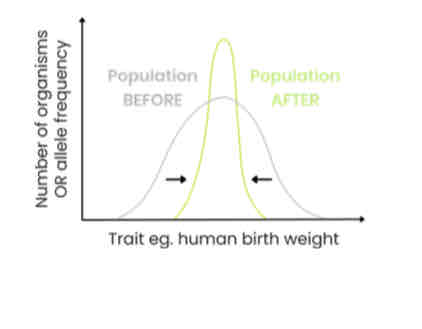
Explain the effects of stabilising selection
● Organisms with alleles coding for average / modal variations of a trait have a selective advantage (eg. babies with an average weight)
● So frequency of alleles coding for average variations of a trait increase and those coding for extreme variations of a trait decrease
● So range / standard deviation is reduced
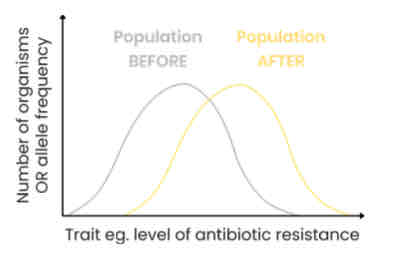
Explain the effects of directional selection
● Organisms with alleles coding for one extreme variation of a trait have a selective advantage (eg. bacteria with high resistance to an antibiotic)
● So frequency of alleles coding for this extreme variation of the trait increase and those coding for the other extreme variation of the trait decrease
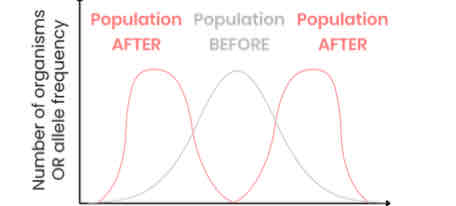
Explain the effects of disruptive selection
● Organisms with alleles coding for either extreme variation of a trait have a selective advantage
● So frequency of alleles coding for both extreme variations of the trait increase and those coding for the average variation of the trait decrease
● This can lead to speciation
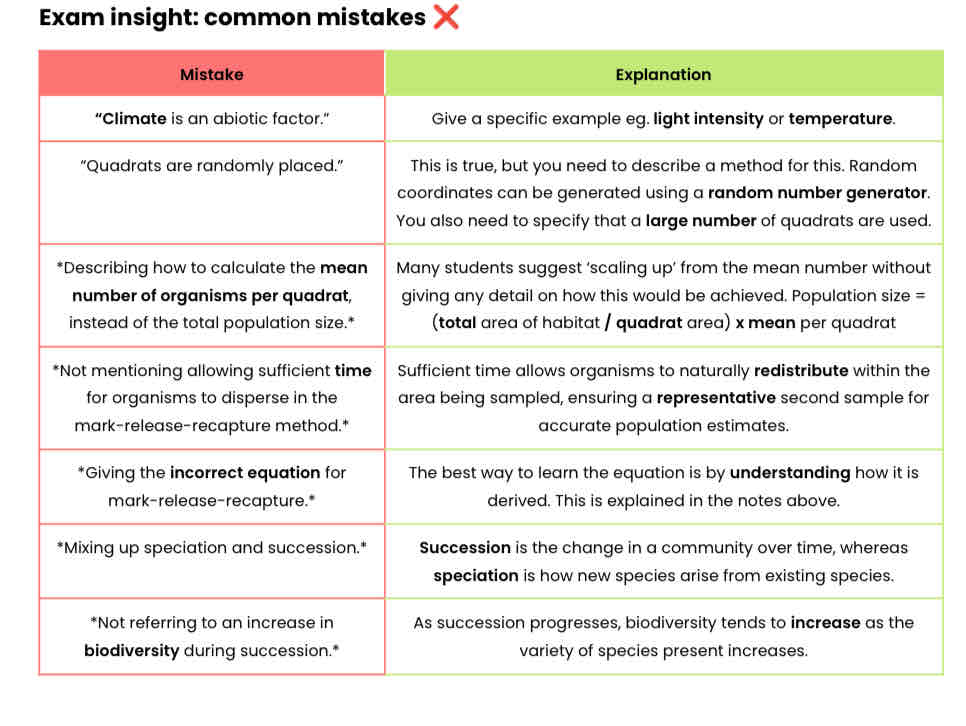
Describe speciation (how new species arise from existing species)
1. Reproductive separation of two populations (of the same species)
2. This can result in accumulation of differences in their gene pools
3. New species arise when these genetic differences lead to an inability of members of the populations to interbreed and produce fertile offspring
Describe allopatric speciation
1. Population is split due to geographical isolation (eg. new river formed)
2. leads to reproductive isolation, separating gene pools by preventing interbreeding
3. Random mutations cause genetic variation within each population
4. Different selection pressures
5. different advantageous alleles are passed on in each population
6. allele frequencies within each gene pool change over many generations
7. Eventually different populations cannot interbreed to produce fertile offspring
Describe sympatric speciation
1. Population is not geographically isolated
2. Mutations lead to reproductive isolation, separating gene pools by preventing interbreeding
● Gamete incompatibility
● Different breeding seasons (eg. different flowering times)
● Different courtship behaviour preventing mating
● Body shape size changes preventing mating
3. Different selection pressures act on each population
4. different advantageous alleles are passed on in each population
5. allele frequencies within each gene pool change over many generations
6. Eventually different populations cannot interbreed to produce fertile offspring
Explain genetic drift and its importance in small populations
● Genetic drift =allele frequencies in a population change over generations due to chance
● some alleles are passed onto offspring more
●strongest effects in small populations as gene pool is small
● reduces genetic diversity
What is a community?
All the populations of different species living in the same place (habitat) at the same time.

What is an ecosystem?
A community and the non-living (abiotic) components of its environment.
What is a niche?
● The specific role of a species within its habitat, eg. what it eats, where and when it feeds
● Governed by its adaptation to both abiotic (non-living) and biotic (living) conditions
Explain the advantage of species occupying different niches
● Less competition for food / resources
● If two species tried to occupy the same niche, one would outcompete the other
What is carrying capacity?
maximum population size of a species an ecosystem can support.
List the factors that influence carrying capacity
Abiotic factors
Eg. light intensity, temperature, soil pH & mineral content, humidity
Interactions between organisms
a. Interspecific competition - between organisms of different species
b. Intraspecific competition - between organisms of the same species
c. Predation (predators kill and eat other animals, called prey)
Explain how abiotic factors may affect population size / carrying capacity
● If conditions favourable, organisms more likely to survive & reproduce → increasing carrying capacity
● Eg. increasing light intensity increases rate of photosynthesis in plants
○ This increases carrying capacity of a variety of plant species
○ So increases the number and variety of habitats, niches and food sources for animals
Explain how interspecific competition may affect population size
● Reduces [named resource] available to both species, limiting their chances of survival & reproduction
○ So reduces population size of both species
● If one species is better adapted, it will outcompete the other
○ So population size of less well adapted species declines, potentially leading to extinction
Explain how intraspecific competition may affect population size
1. As population size increases, resource availability per organism decreases, so competition increases
● So chances of survival & reproduction decrease → population size decreases
2. As population size decreases, resource availability per organism increases, so competition decreases
● So chances of survival & reproduction increase → population size increases
Explain the changes which occur in populations of predators & prey
1. Prey population increases so predators have more food
● So more predators survive & reproduce
2. Predator population increases so more prey killed & eaten
● So less prey survive & reproduce
3. Prey population decreases so predators have less food
● So less predators survive & reproduce
4. Predator population decreases so less prey killed & eaten
● So more prey survive & reproduce (cycle repeats)
Describe how the size of a population of slow-moving or non-motile organisms can be estimated
1. Divide area into a grid / squares eg. place 2 tape measures at right angles
2. Generate a pair of coordinates using a random number generator (eg. on a calculator)
3. Place a quadrat here and count number / frequency of [named species]
4. Repeat a large number of times (10 or more) and calculate a mean per quadrat
5. Population size = (total area of habitat / quadrat area) x mean per quadrat
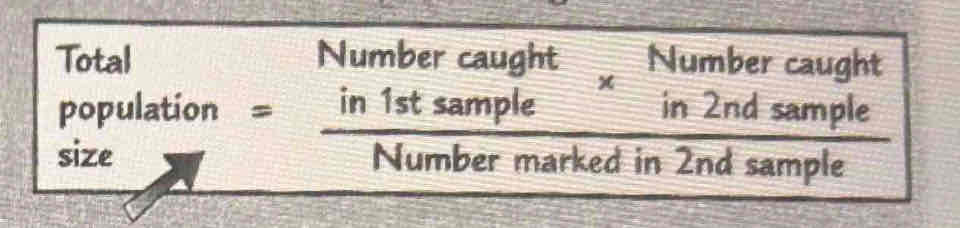
Mark release recapture formula for total population size
What assumptions does the mark-release-recapture method make?
1. Sufficient time for marked individuals to mix / distribute evenly within the population
2. Marking not removed and doesn’t affect chances of survival / predation
3. Limited / no immigration / emigration
4. No / few births / deaths / breeding / change in population size (or birth & death rate are equal)
Suggest why the mark-release-recapture method can produce unreliable results in very large areas
● Unlikely that organisms will distribute randomly / evenly
● Less chance of recapturing organisms (that were marked initially)
Describe and explain how primary succession occurs
Succession = change in a community over time due to change in abiotic factors / species
1. Colonisation by pioneer species
2. Pioneer species change abiotic conditions
● Eg. they die and decompose, forming soil which retains water (humus / organic matter)
3. So environment becomes less hostile
AND less suitable for previous species, so better adapted species outcompete previous species
4. As succession goes on, biodiversity increases
5. Climax community reached - final stable community (no further succession)
Describe features of a climax community
● Same species present over a long time
● Abiotic factors constant over time
● Populations stable
Explain how conservation of habitats involves management of succession
● Further succession can be prevented to stop a climax community forming
○ By removing or preventing growth of species associated with later stages eg. by allowing grazing
● This preserves an ecosystem at a certain point / in its current stage of succession (plagioclimax)
● So early species are not outcompeted by later species and habitats / niches are not lost
Describe the conflict between human needs and conservation as well as the importance of managing this
● Human demand for natural resources (eg. timber) is leading to habitat destruction / biodiversity loss
● Conservation is needed to protect habitats / niches / species / biodiversity
● Management of this conflict maintains the sustainability of natural resources
○ Meeting current needs without compromising the ability of future generations to meet theirs