Descriptive Statistics
1/23
There's no tags or description
Looks like no tags are added yet.
Name | Mastery | Learn | Test | Matching | Spaced |
|---|
No study sessions yet.
24 Terms
descriptive statistics
Data can be described as graphical and numerical
graphical methods: categorical variable
bar graph
pie chart
count & percentage
graphical methods: numeric variable
histogram, box plot, dot plot, stem and leaf plot
average: mean or median
variability: standard deviation (if mean is reported), IQR or range (if median is reported)
five number summary
minimum, Q1, median, Q3, maximum
µ vs x bar
µ is the population mean (must have a census); this is a parameter
x bar is the sample mean; this is a statistic
mean vs median: outliers
median is resistant to outliers
mean is sensitive to outliers
mean, median, and mode
mean is the balance point of the distribution
median is the equal-areas point, area under the curve to the left of the median and the area under the curve the right of the median are equal
mode is the peak point of the distribution, where the curve is highest
when are they applicable: mean, median, and mode
mean: ratio or interval scale data
median: ratio or interval scale data, also on the ordinal scale
mode: summarizes categorical variables with the relative frequency
variance and standard deviation
provide a summary of the dispersion of individual observations around the mean
population variance
σ² (population parameter): sigma squared
usually unknown and must be estimated by the sample variance (s²); sample statistic
population standard deviation
σ: sigma
usually unknown and must be estimated by sample standard deviation (s)
σ: is a population parameter
s: is a sample statistic
when the deviation =0…
the observation is equal to sample mean
deviation = difference
how much does it differ from the sample mean
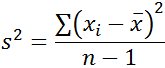
calculating sample variance(s²)
the population variance (sigma squared) is estimated by the sample variance (s²)
xi - xbar: subtracting the mean from the observation; value may be negative; gives you the deviation from the mean
(xi - xbar)^2: square the deviation, so all values are positive
sum all squared deviations
s^2 = (1/n-1)(sum of all squared deviations)
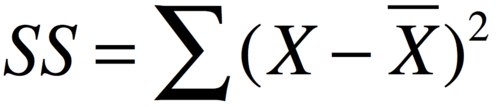
corrected sum of squares
degrees of freedom
n-1
1 degree of freedom was lost when µ (population mean) was replaced by x. In other words, the term (n − 1) is used in the denominator instead of n to adjust for the fact that the mean of the sample is used as an estimate of the mean of the underlying population.
disadvantages to variance
• The units of the variance are in the units of the original data squared. If the measurements are in pounds, their variance will be in terms of pounds squared, even though such squared units have no physical interpretation.
• The variance measures variability around the mean. Since the mean is affected by outliers, the variance will also be affected by outliers.
standard deviation
The standard deviation is the positive square root of the variance; thus, it is measured in the units of the original data. Being the positive square root of the variance, the standard deviation is always a nonnegative number.
The population standard deviation is denoted by σ ("sigma").
Since the entire population is rarely known, it must be estimated using the sample standard deviation, denoted by s.
sample standard deviation
take the square root of sample variance
More about sample standard deviation
preferred measure of dispersion when the mean is used as the measure of center
measures the average deviation from the mean. It measures variation by indicating how far, on average, the observations are from the mean.
influenced by outliers
standard error
describes the variability of a statistic from sample to sample
measures the variability of the mean of the sample as an estimate of the true value of the mean for the population from which the sample was drawn.
standard error of the mean
tells us how variable the mean changes from sample to sample

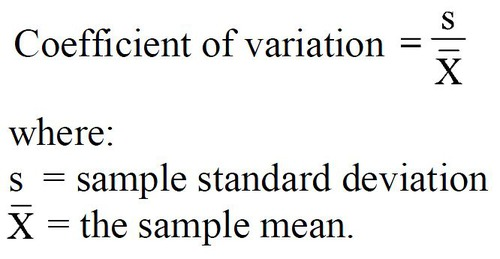
coefficient of variation
A measure of relative variability computed by dividing the standard deviation by the mean and multiplying by 100.
skewness
a measure of symmetry, or more precisely, the lack of symmetry
skewness is the average of cubed deviations about the mean
excess kurtosis
helpful in assessing normality
indicates the heaviness of the tails relative to the middle of a distribution
kurtosis is the average of the fourth power of the deviations about the mean, it is always nonnega