MATH 147 - Chapter 2
 Call Kai
 Learn
Learn Practice Test
 Spaced Repetition
 Match
Match Flashcards
 Knowt Play
1/23

There's no tags or description
Looks like no tags are added yet.
Name | Mastery | Learn | Test | Matching | Spaced | Call with Kai | Chat |
|---|
No analytics yet
Send a link to your students to track their progress
24 Terms
What is a quantitative variable?
used to describe the qualities or characteristics of someone or something (like favorite color, gender, country of birth, area code)
What is a categorical (qualitative) variable?
tells you the amount or degree of something (like ounces, dollars, height, degrees Fahrenheit)
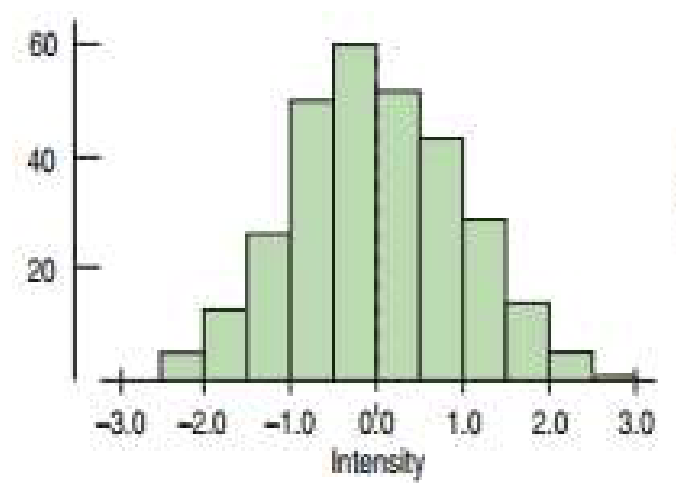
Is this histogram skewed left, skewed right, or is it symmetrical. Explain why
symmetrical because distribution is the same on the left and the right of its center
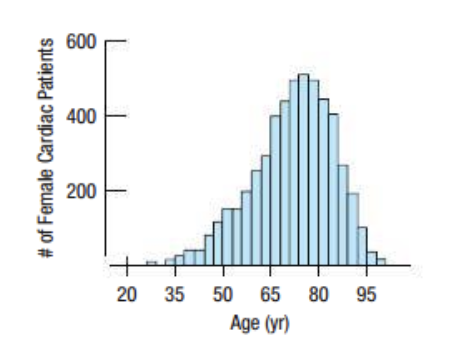
Is this histogram skewed left, skewed right, or is it symmetrical
skewed left because the longer tail is on the left side of the mode
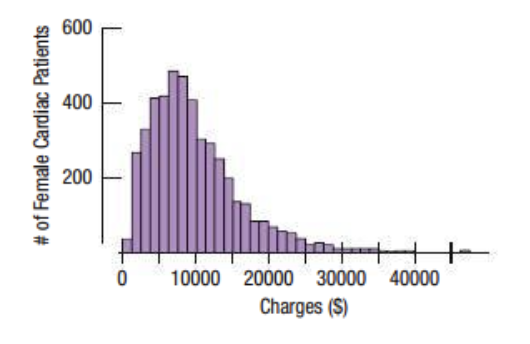
Is this histogram skewed left, skewed right, or is it symmetrical
skewed right because the longer tail is on the left side of the mode

Is this histogram skewed left, skewed right, or is it symmetrical. Explain why
symmetrical because distribution is the same on the left and the right of its center
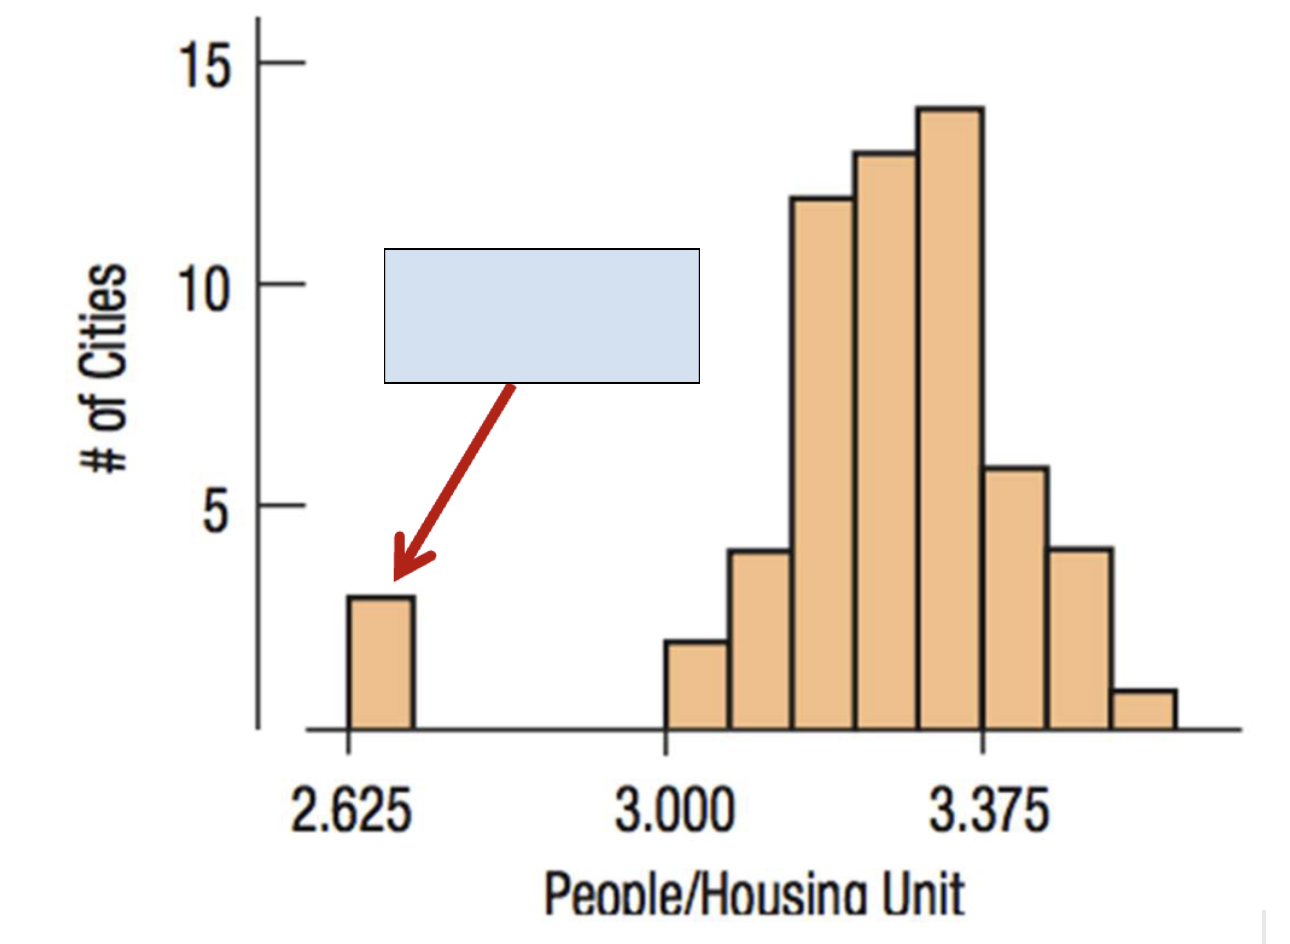
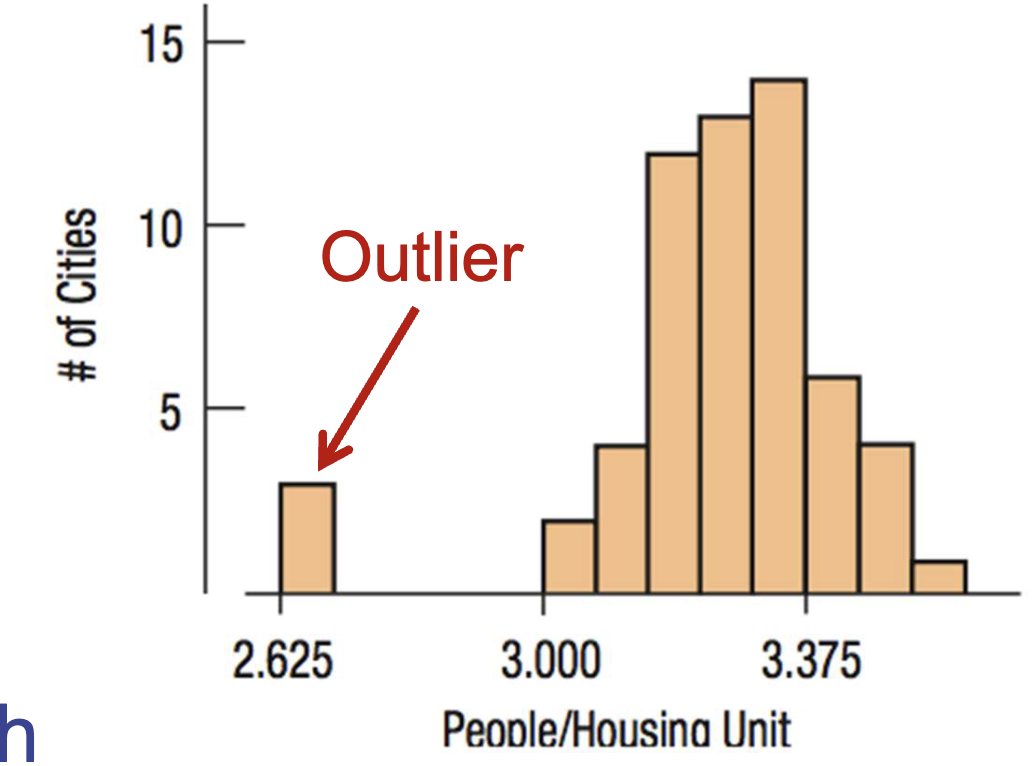
What is the arrow pointing to on the histogram
An outlier
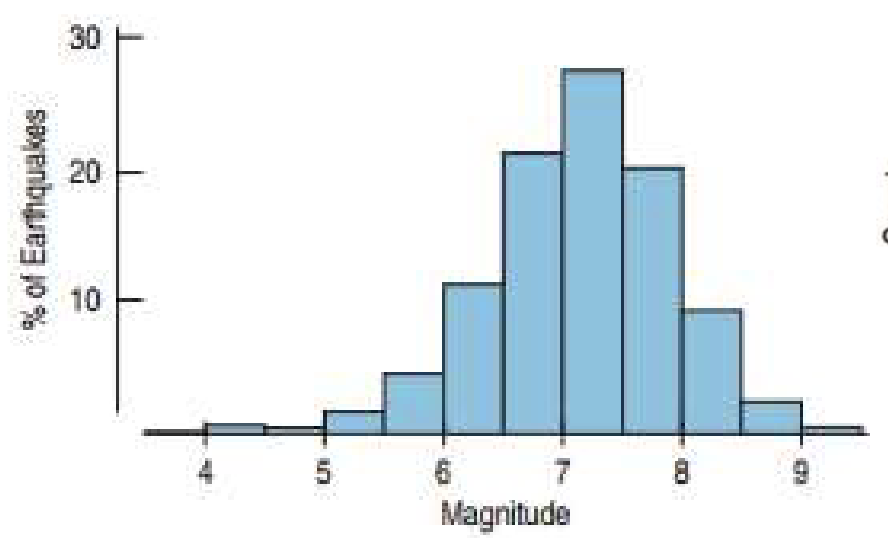
Determine if this is a unimodal, bimodal, or multimodal. Explain why
Unimodal because it has one mode (hump)
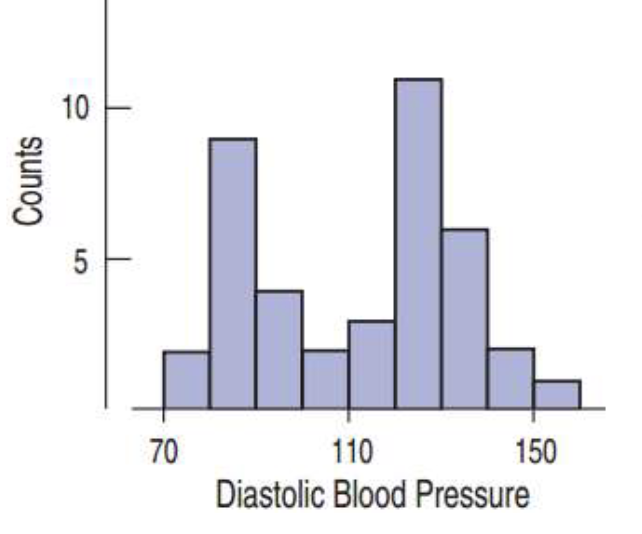
Determine if this is a unimodal, bimodal, or multimodal. Explain why
Bimodal because it has two modes (humps)
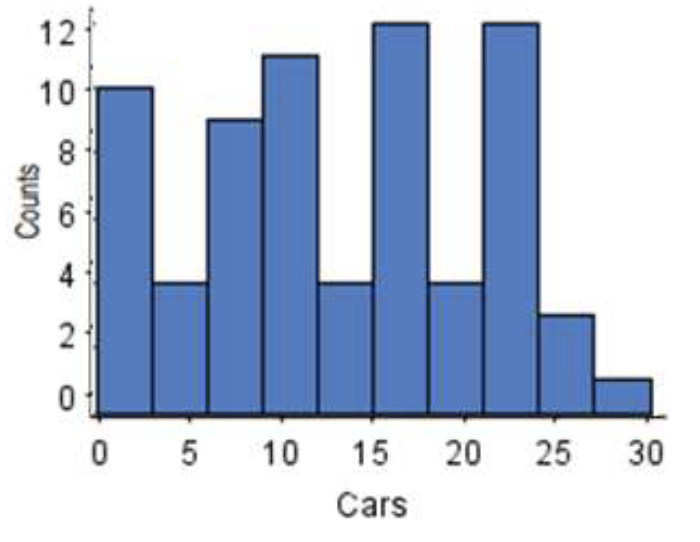
Determine if this is a unimodal, bimodal, or multimodal. Explain why
Multimodal because it has 3 or more modes (humps)
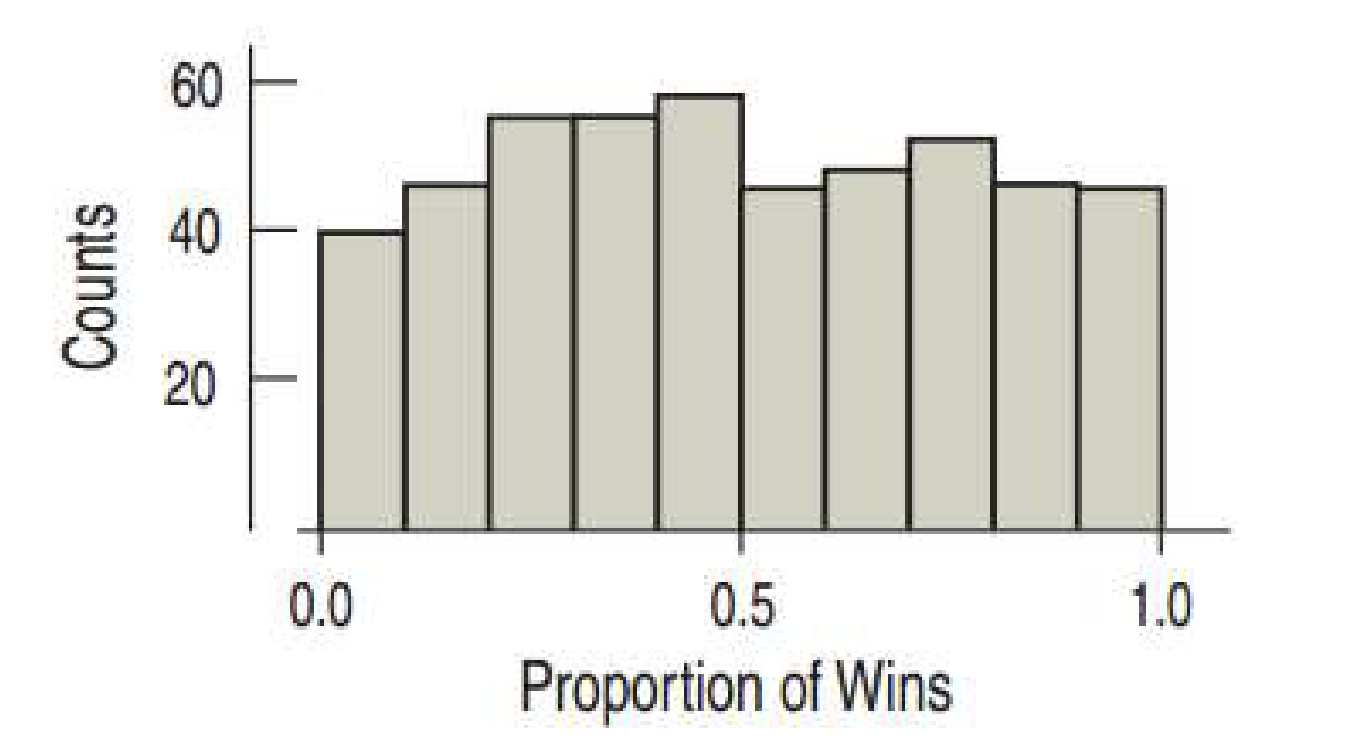
The histogram for a uniform distribution will be nearly flat (has no modes/humps)
*
How to summarize the center of a distribution
by finding the mean and median
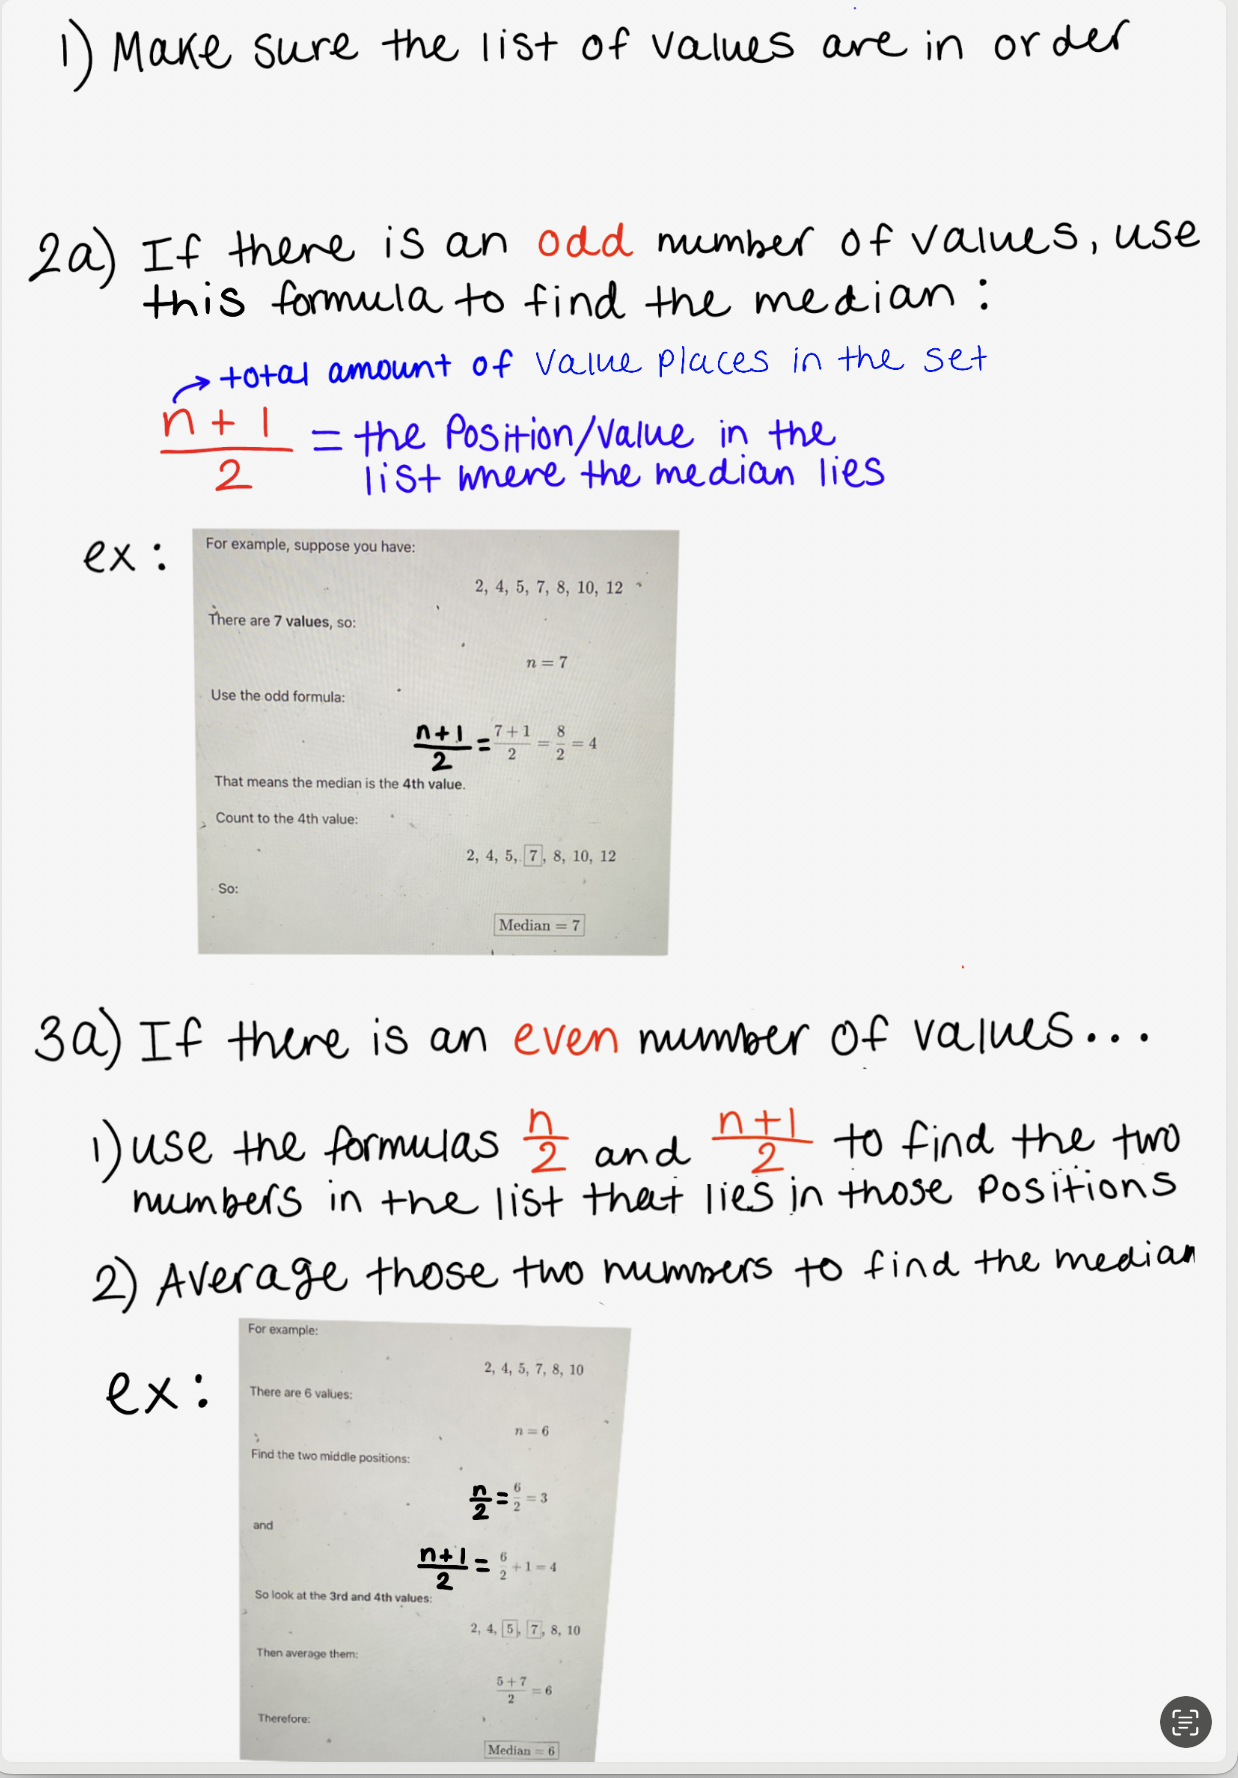
How to find the median?
*note: you can use the cross out method to find the center number in the list to check your answer
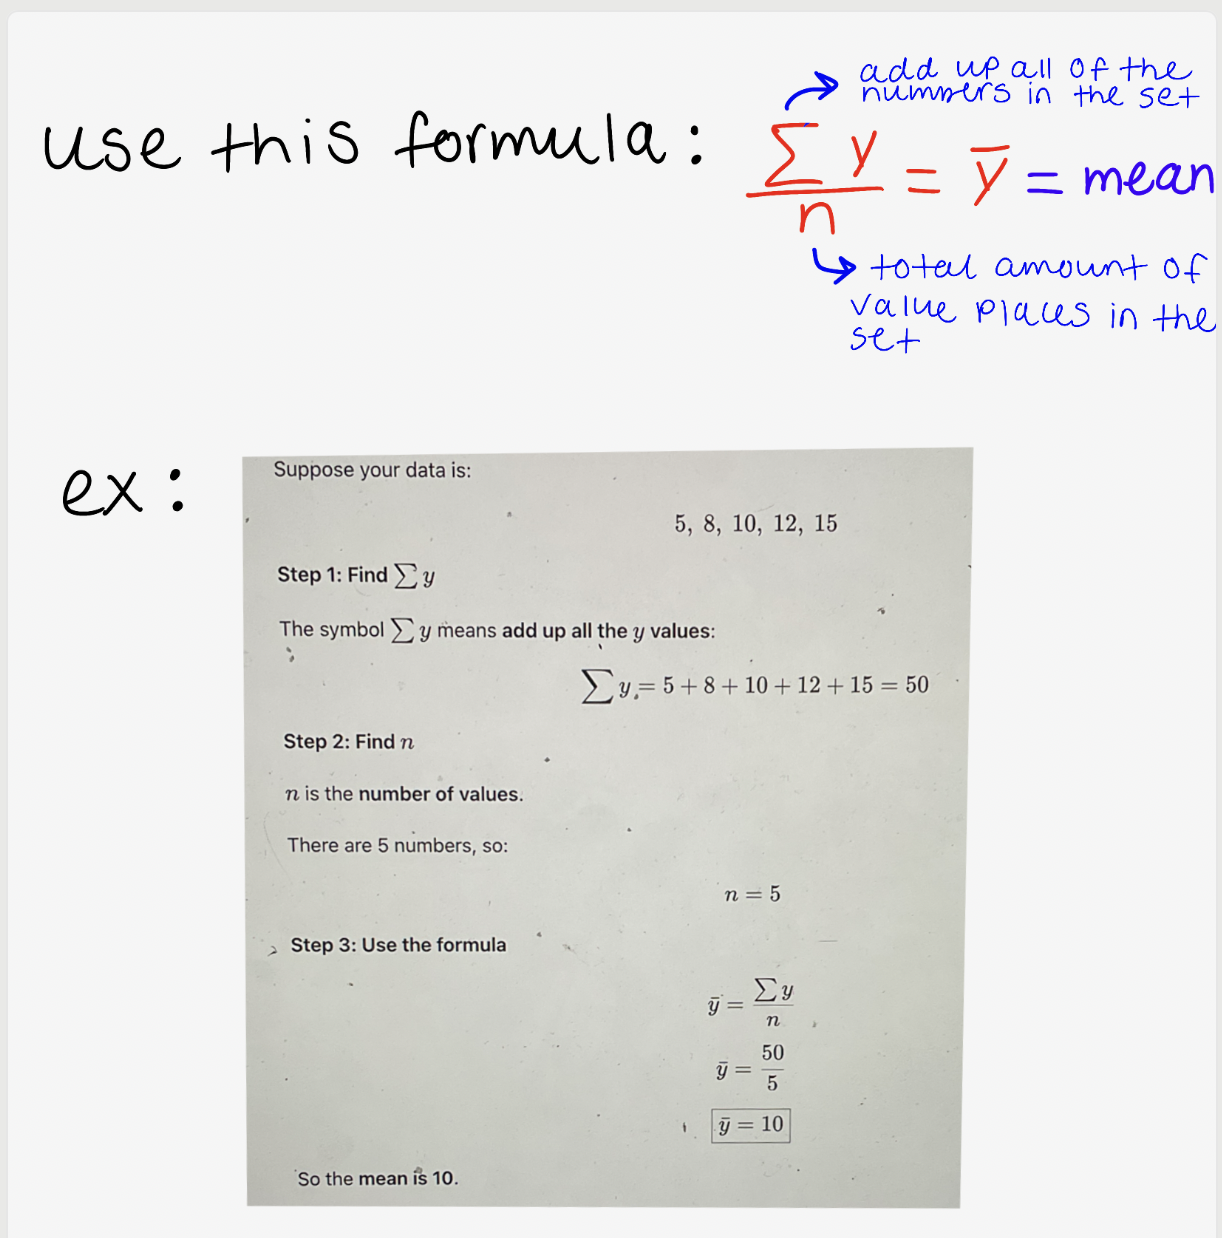
How to find the mean?
When to use the mean or median?
Use the median for skewed data (either left or right) or when outliers are present
Use the mean for data that is symmetrical (not skewed) or without extreme outliers
How to find the range
subtract the maximum value minus the minimum value
How to summarize the spread of a distribution
by finding the standard deviation and interquartile range
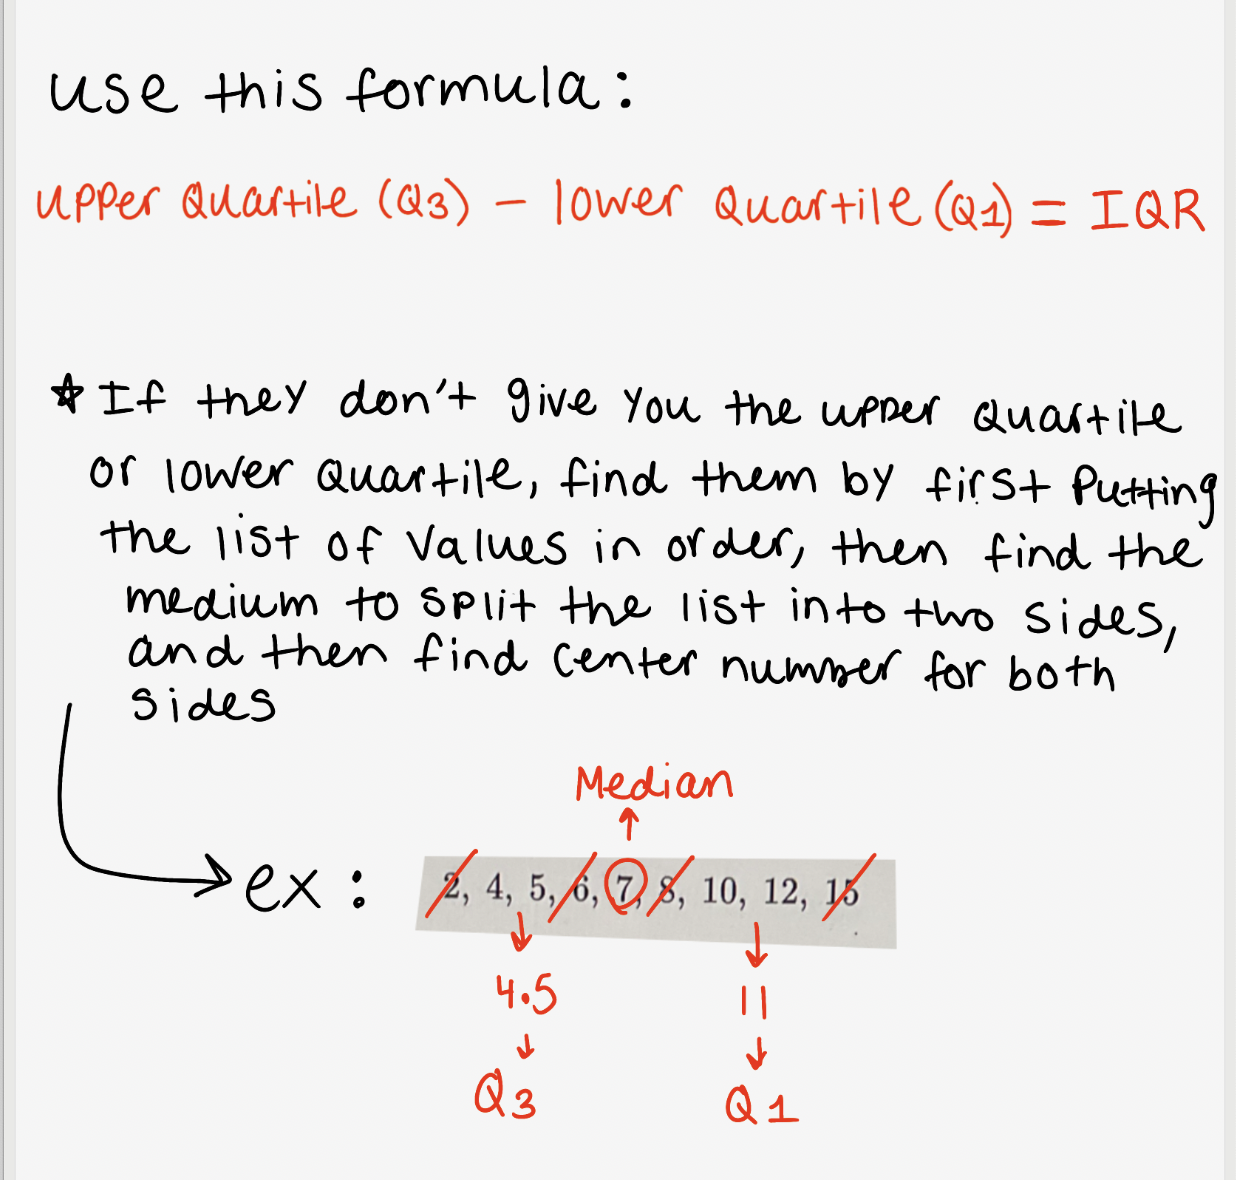
How to find the interquartile range (IQR)
How to find the standard deviation

How to find the variance
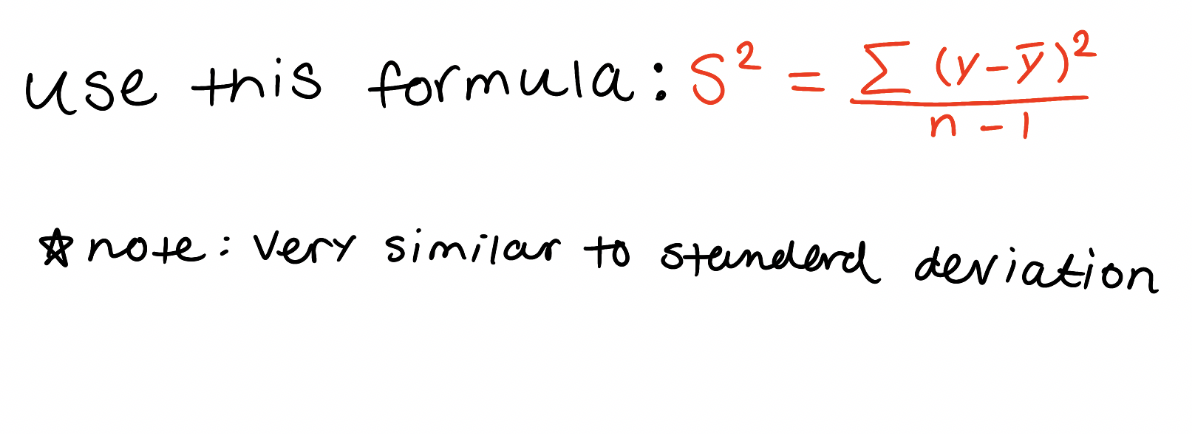
What is the variance
how far the data is spread out from the mean
How to determine if the standard deviation is large or small
If data values are far from the mean (more spread out), then the standard deviation will be large
If data values are close to the mean (less spread out), then the standard deviation will be small.
When to use the interquartile range or standard deviation
Use the interquartile range for skewed data (either left or right) or when outliers are present
Use the standard deviation for data that is symmetrical (not skewed) or without extreme outliers
Always pair the median with the IQR and the mean with the standard deviation.
*