Neuro Sadness
1/20
There's no tags or description
Looks like no tags are added yet.
Name | Mastery | Learn | Test | Matching | Spaced | Call with Kai |
|---|
No study sessions yet.
21 Terms
Natural-kind View
Emotions are distinct, biologically hardwired categories with unique brain patterns. (ex. fear and anger come from different neural systems)
Core Affect
A neurophysiological state that underlies simply feeling good or bad, drowsy or energized.
Emotion Paradox
We experience and label distinct emotions, but neuroscience doesn’t consistently find separate brain patterns for them.
Conceptual Act Model (Barrett)
Emotions are not hardwired; they emerge in the moment when we interpret core affect (valence + arousal) using context, experience, and learned categories. (Think her ex of color)
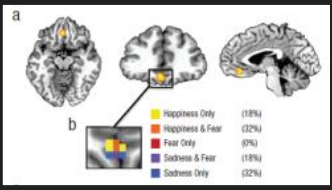
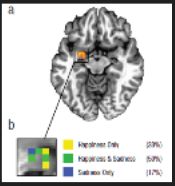
What did these fMRI studies show about fear, happiness, and sadness?
Brain activity reflected valence and arousal ratings, not distinct emotion categories, supporting the idea that emotions arise from core affect.
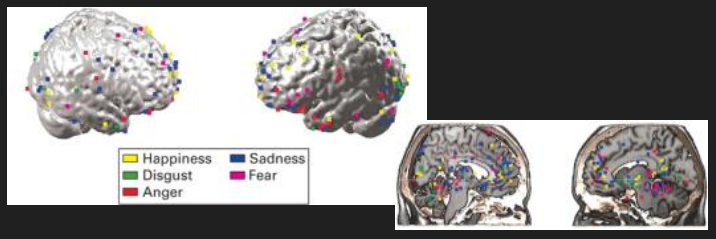
What did these meta-analyses of brain imaging studies reveal about emotion and the brain?
A single emotion activates many different brain regions. The same brain region can be active for multiple emotions, suggesting emotions aren’t tied to specific circuits.
Pain Analogy (Farb)
First pain = sensory experience of pain Second pain = emotional experience of pain. Mindfulness reduces emotional appraisal; reappraisal changes emotional response.
Farb Goal
Compare brain responses and emotional reactivity to sadness between people who completed mindfulness training and those who didn’t.
Farb Methods
Compared brain responses to sad and neutral film clips in two groups, one fMRI scanned after mindfulness training and the control group scanned before training to test how mindfulness affects emotional reactivity.
Manipulation Check (measured their mood after clips)
Sad films induced greater dysphoric mood than neutral films in MT and controls.
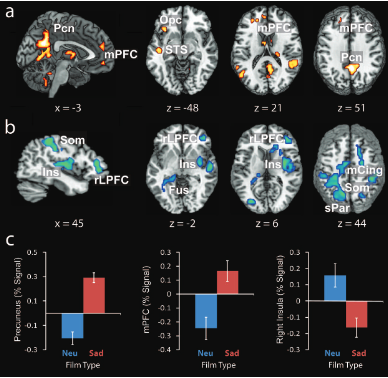
Results of Figure 1
Compared brain activity during sad vs neutral clips and shows which brain areas are more or less active during sadness compared to neutral processing for the control group.
A = areas with more BOLD signal for sad compared to neutral (activation)
B = areas with less BOLD signal for sad compared to neutral (deactivation)
C = compares neutral and sad in terms of activation (1/2 = more active, 3 = less active for sad)
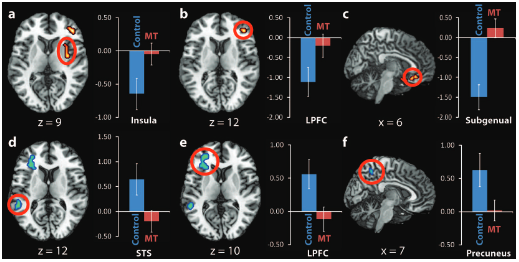
Results of Figure 2
Compares brain activity during sad vs neutral clips to show how the mindfulness groups responses differed from controls, revealing reduced activation and deactivation patterns after mindfulness training.
A-C = areas deactivated with sadness in controls, but not in MT
D-F = areas activated with sadness in controls, but not in MT
Farb Conclusions
MT group demonstrated less neural reactivity to sadness provocation and reported fewer symptoms of depression.
MT may decrease reactivity to negative emotion by balancing sensory and affective networks.
George Goal
Measure changes in rCBF associated with transient sadness and happiness.
How does PET scan work?
Inject a “tracer”, then the PET scan tracks which tissues take up the tracer. H2 15O (basically radioactive water) is used to track regional cerebral blood flow (rCBF). PET provides a quantitative measure of cerebral metabolism.
George Method
Participants had to think of sad, happy, and neutral memories (two of each). They were then shown affect-appropriate faces while recalling each of their memories during the PET scan. Visual analog scale and PANAS (ratings of feelings and emotions) were completed before and after each memory task.
Manipulation Check
Mood induction worked. Significant change in mood on the visual analog scale and the PANAS following memory recall.
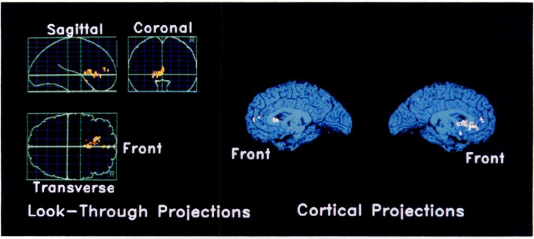
Sad task minus neutral task results
Significantly more activity in mPFC, left lateral PFC, ACC, fornix (memory structure), insula, thalamus, cerebellum, putamen, and caudate. Significantly less activity in visual cortex.
Pixels indicate areas significantly MORE active for sad compared to neutral.
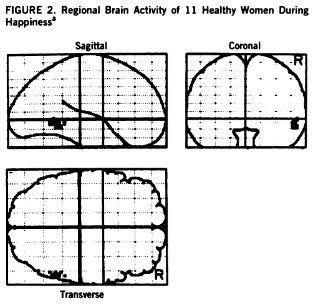
Happy task minus neutral task results
No significant increases in activity. Significantly less activity in midtemporal cortex, right PFC, and right superior temporal gyrus.
Pixels indicate areas that are significantly LESS active during happy compared to neutral.
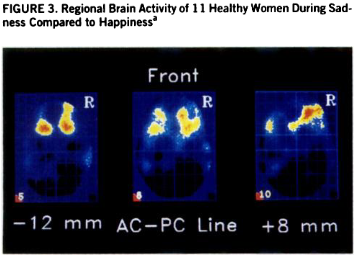
Sad task versus happy task results
Significantly more activity in right ACC, PFC, thalamus, and basal ganglia. Significantly less activity in visual cortex.
Areas with MORE activity during sadness than happiness task.
George Conclusions
Sadness associated with activity in paralimbic and limbic structures. Happiness associated with less activity in parietal-temporal areas. The two states are not simply the opposite of one another.