AP Stats First Terms
 Call Kai
 Learn
Learn Practice Test
 Spaced Repetition
 Match
Match Flashcards
 Knowt Play
1/31

There's no tags or description
Looks like no tags are added yet.
Name | Mastery | Learn | Test | Matching | Spaced | Call with Kai | Chat |
|---|
No analytics yet
Send a link to your students to track their progress
32 Terms
population
The entire collection of individuals or objects about which information is desired
parameter
a numerical summary of a population, such as a mean or standard deviation.
sample survey
a study that collects data from a subset of a population to estimate characteristics of the whole population; subset of population
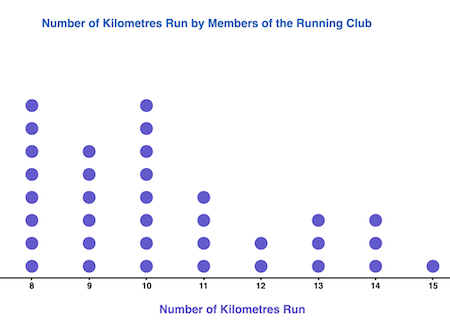
dot plots
a type of graphical display that uses dots to represent the frequency of data points in a dataset, allowing for easy visualization of distribution and trends.
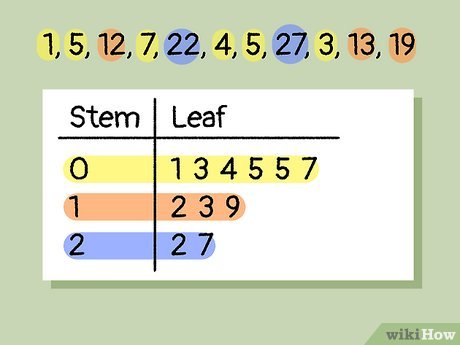
stem plots
a method for displaying quantitative data that uses stems (the leading digits) and leaves (the trailing digits) to organize and visualize the data distribution.
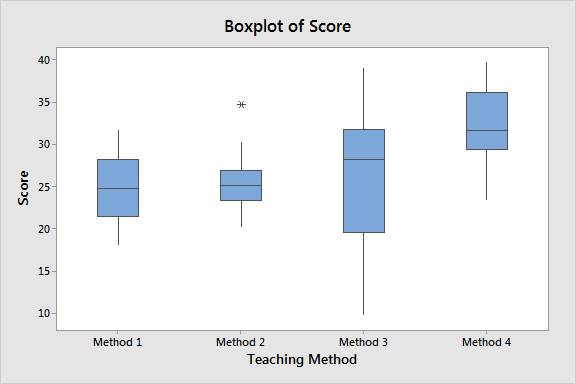
box plots
displays quantitative data in quartiles with a box (Q1, Q2/Mean, Q3) and smallest and largest with whiskers
placebo
a harmless substance given to patients in a clinical study to research the effects of belief
inference
process of using data from a sample survey to conclude for a larger group of people
statistic
characteristic of a sample; used to create parameters
sample
a set of observations drawn from a population.
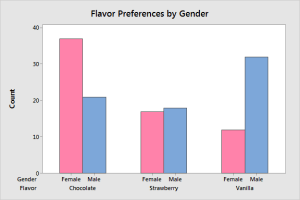
bar chart
graphical representation of data using rectangular bars where its length is proportional to its value
components of experimental design
manipulation, control, and random assignment
census
a study that obtains data from every member of a population
probability
the likelihood for something to occur
controlled experiment
a baseline group that receives no treatment or a neutral treatment
selection bias
Undercoverage occurs when some members of the population are inadequately represented
Voluntary response bias occurs when sample members are self-selected volunteers
Nonresponse bias occurs when individuals chosen for the sample are unwilling or unable to participate in the survey
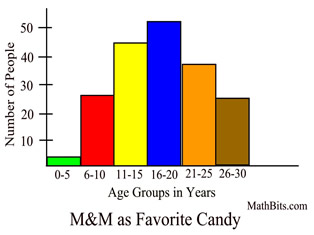
histograms
representations of data distribution, where data is grouped into bins or intervals, and the frequency of data points within each bin is represented by the height of bars
explanatory vs. response variables
IV vs DV - explanatory causes outcomes which are the response
treatments
combination of explanatory variables (# of V1 and # of V2)
sample space
set of elements that represents all possible outcomes of a statistical experiment
observational study
attempt to understand relationships. However, unlike experiments, the researcher is not able to control subjects and/or treatments (variables) each group receives
response bias
bias that results from problems in the measurement process
Leading questions. The wording of the question may be loaded in some way to unduly favor one response over another
Social desirability. Most people like to present themselves in a favorable light, so they will be reluctant to admit to unsavory attitudes or illegal activities
measures of center
single values used to describe the middle or typical point of a data set
mean, mode, median
random sampling methods
the selection of a sample unit is based on chance and every element of the population has a known, non-zero probability of being selected; randomly selected sample unit to remove bias
blocking
used in a randomized block experiment to sort experimental units into homogeneous groups, called blocks. The goal of blocking is to create blocks such that dependent variable scores are more similar within blocks than across blocks; sorting results to stay organized
blinding
not telling subjects in a placebo experiment that they are taking a placebo to gain an equal effect on placebo vs no placebo
types of data/variables
quantitative - numerical data (discrete = whole numbers [objects], continuous = any number [property]
qualitative - categorical data (nominal [color, gender], ordinal = group with logical order [quality, rank]
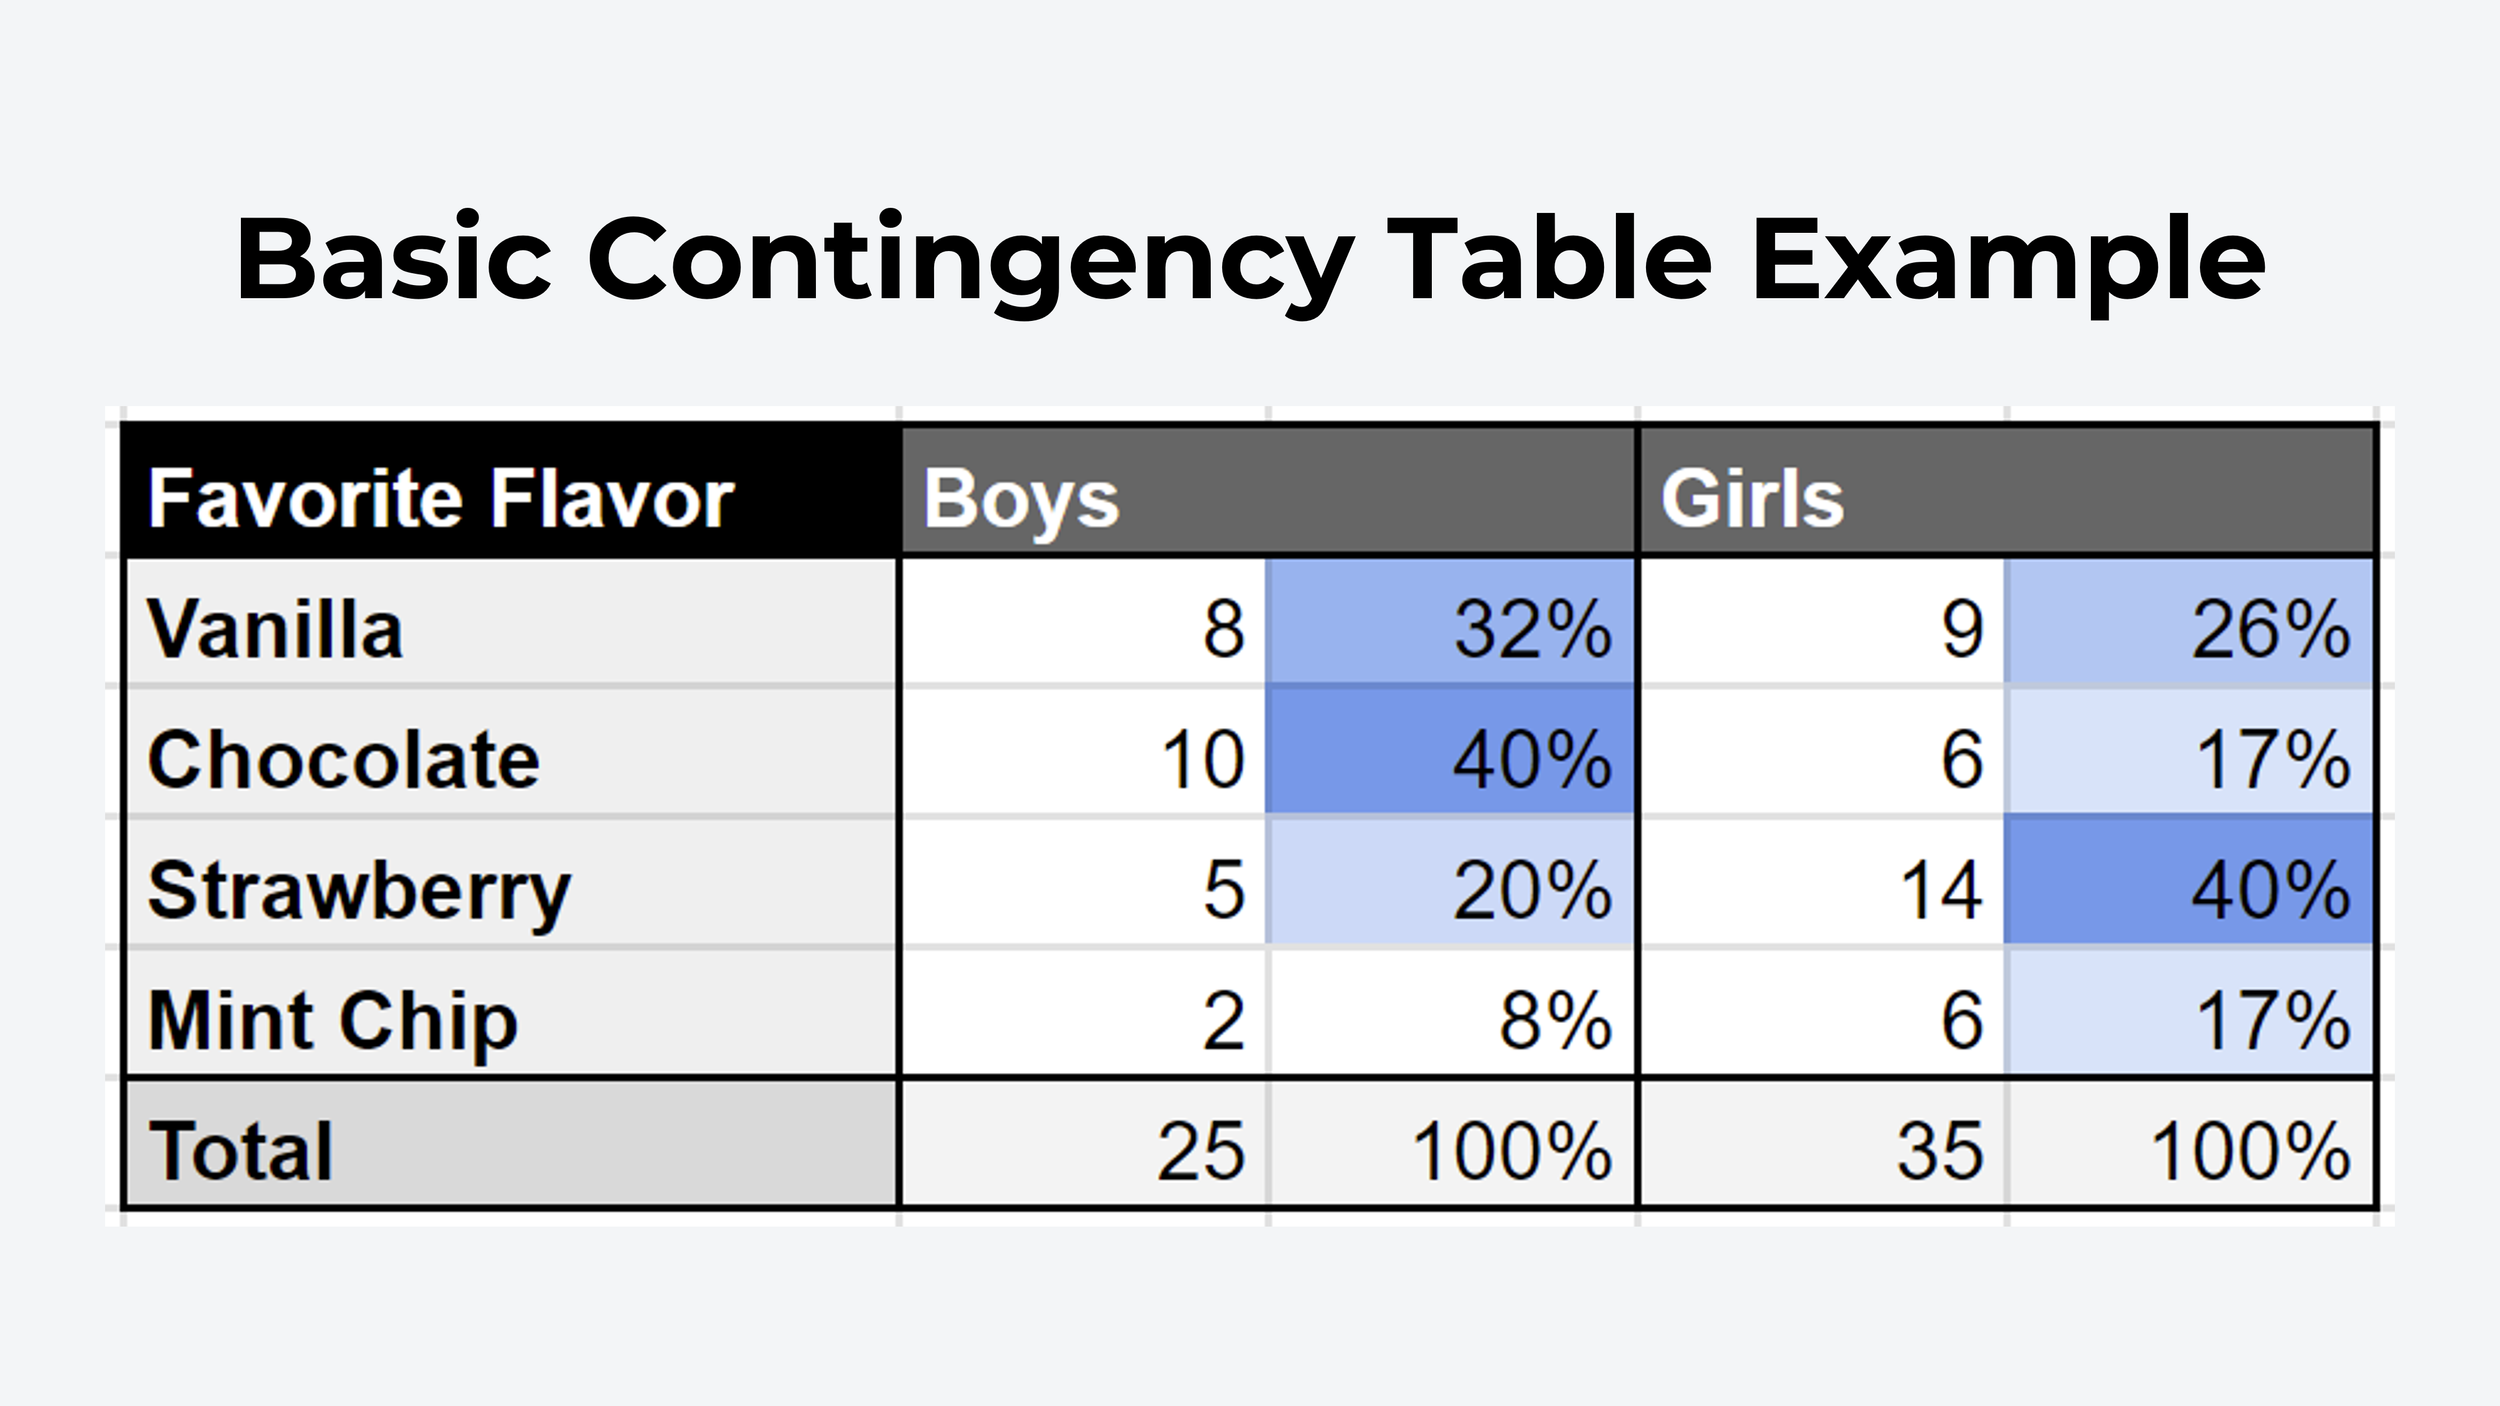
2-way tables/contingency table
useful tool for examining relationships between categorical variables usually demonstrating frequencies
measures of spread (variability)
describe how far apart or close together data points are in a data set
standard deviation, range, variance, interquartile range (IQR)
measures of position
statistical tools that show where a specific data value fits inside a whole data set. can help spot outliers
quartiles, deciles, percentiles, z-scores
sample mean
the average value of a small group of data taken from a larger set/sample
population mean
the true average value of the data set