habitat loss, fragmentation, and degradation (ch 9)
1/30
There's no tags or description
Looks like no tags are added yet.
Name | Mastery | Learn | Test | Matching | Spaced |
|---|
No study sessions yet.
31 Terms
what are drivers of habitat loss
agricultural expansion, extractive industries, urbanization
how much has agriculture expanded
1700-1950: agricultural land increased from 2.6 to 12 million km2 (450% in 250 years)
Current: 19M km2 cropland, 34M km2 pastures, >40% of Earth’s land surface
what is the Land Sharing versus Land Sparing (LSLS) debate
intense debate between scientists about the best framework for conservation. instead of either-or we should aim for both-and
land sparing
concept that best way to save biodiversity is to set aside large areas of land as national parks and other protected areas that are separated from potentially damaging human activities like agriculture.
land sharing
concept that best way to conserve biodiversity is to integrate patches of natural habitat into landscapes that are characterized by small-scale farms with low-intensity land-use practices such as selective logging, organic farming, and low-intensity grazing.
what are the impacts of extractive industries
those that remove raw materials from nature; they include oil and gas extraction, mining and quarrying, fishing and aquaculture, hunting, and forestry.
Area can be large → e.g., oil, gas, & mineral extraction account for 7% of deforestation in subtropics
Impacts on local biodiversity are severe; often complete loss.
describe impacts of urbanization
Approximately 3% of Earth’s surface has already been converted to urban habitat
Globally, more than 5.87 million km2 of land has the potential to be converted to urban habitat by 2030
Built environments have a range of impacts on biodiversity
“urban environments characterized by intense land use, the impacts on species richness were consistently negative”
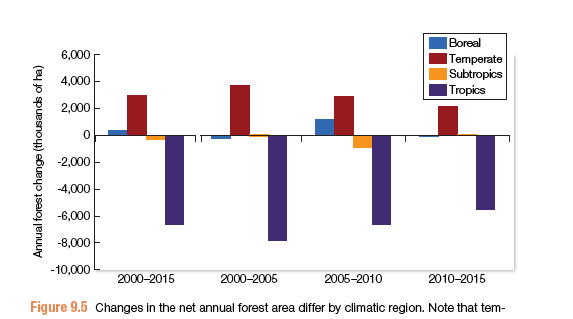
forest biome habitat loss
Over the last 5000 years, the global area of forested habitat has declined by roughly 50%
by end of 20th century, deforestation stabled in Europe and North America but increased in tropical regions.
The destruction of tropical rain forests has come to be synonymous with habitat and biodiversity loss.
palm oil habitat loss
One of the greatest cash crops that is contributing to tropical deforestation today is oil palm.
Palm oil is currently the most widely used vegetable oil in the world; it is used in more than half of all packaged goods sold in the supermarket.
High consumer demand for products containing palm oil has led to a rapid proliferation of oil palm plantations, particularly in Southeast Asia, Latin America, and Africa, where more than 270,000 km2 of native forests have been bulldozed or torched to make room for plantations.

habitat loss of coral reefs
super fucking sad
25% of world’s coral reefs already damaged beyond repair, 90% projected to be lost by 2030
Philippines (90% dead or dying), China (decline of 80% over past 30 years), Australia (33% dead)
Many biologists say its too late to save hard corals
Likely to be complex responses
Northern GBR, near-instant coral death
More southerly, lost algae, then died
Lots of fast-growing complex corals were replaced by slow–growing species that support fewer species
habitat loss: wetlands
wetlands are often filled in or drained to create agricultural or urban habitat, or they are altered by channelization of watercourses and dams
The global average loss of natural wetland area has been 53.5%, with more loss of inland wetlands (average 60.8%) than coastal wetlands (average 46.4%).
streams, rivers, and lakes habitat loss
>1 million dams globally; 48% of river habitats altered by flow regulation.
10-20K freshwater species threatened by human alteration of hydrology.
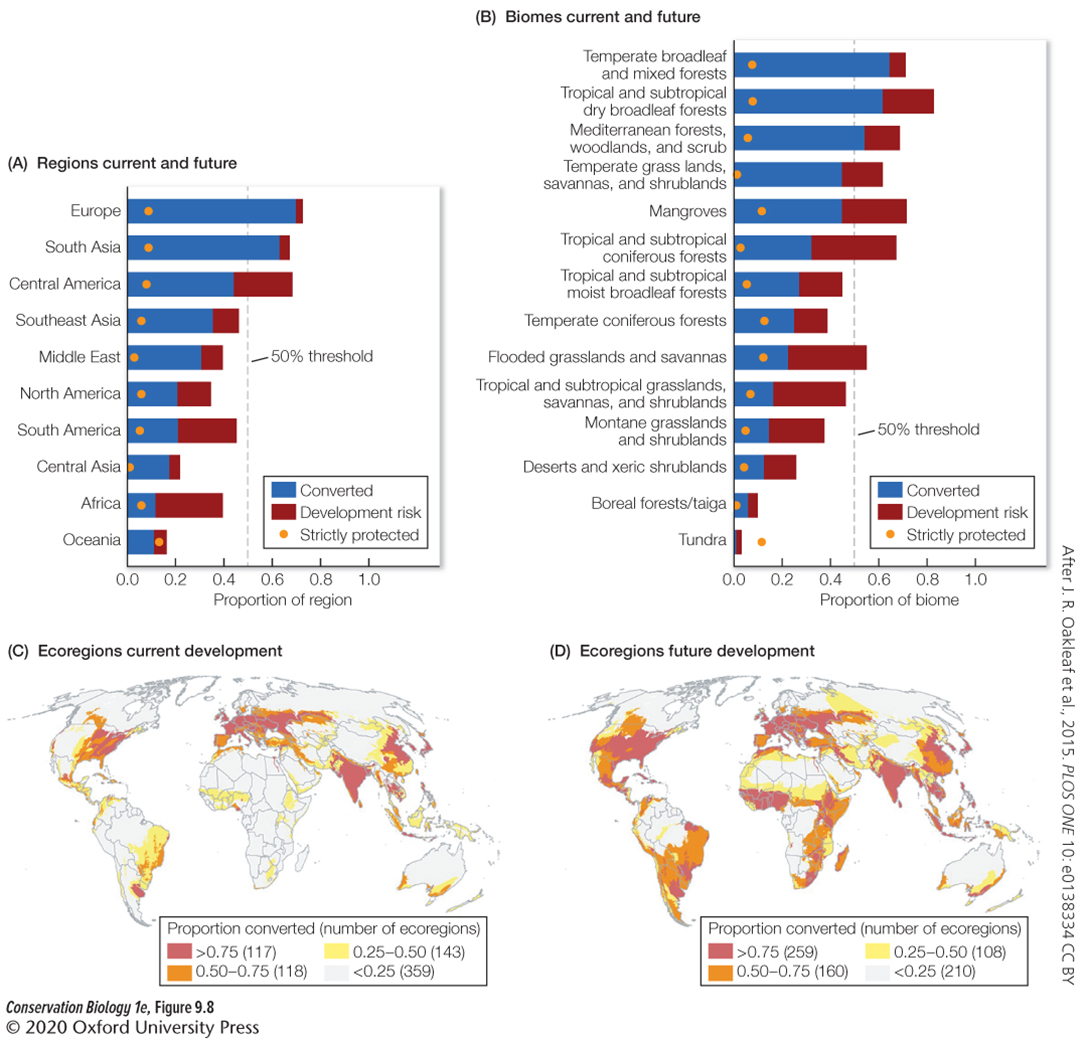
describe future threats of habitat loss in biomes (hint: other side shows graphs with regional development)
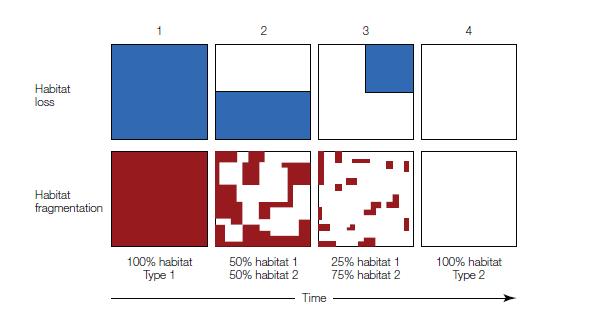
what is habitat fragmentation
the process by which a larger expanse of habitat is subdivided into smaller pieces, or patches, within a landscape.
fragmentation:
(1) alters the size of habitat patches,
(2) changes the number of habitat patches,
(3) increases the distance between and isolation among, habitat patches, and
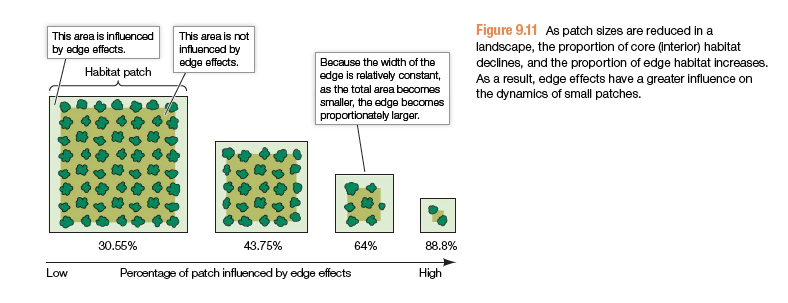
(4) changes the area-to-perimeter ratio of habitat patches, in turn increasing the amount of edge habitat
changes in the configuration of habitat patches (patch size, number, isolation, and
edge effects) can have either a positive or a negative influence on biodiversity
consequence of fragmentation: patch size and patch number
the mean size of a patch remaining in a landscape tends to decrease linearly as the original habitat is lost
species losses accelerate rapidly as patch sizes get increasingly small.
late stages of fragmentation that generate increasingly small patches have a disproportionately negative effect on biodiversity.
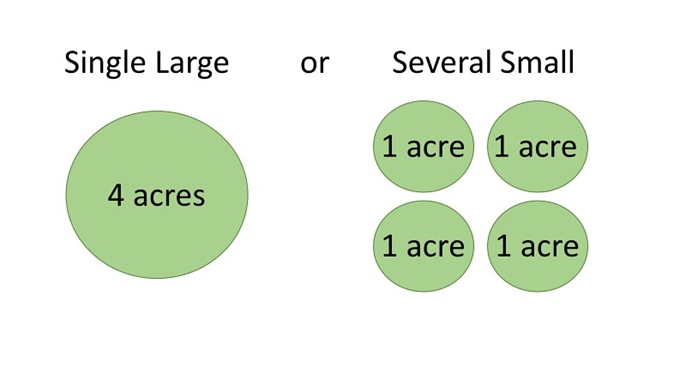
what is the SLOSS debate
Single Large or Several Small (SLOSS) debate
1975: Jared Diamond → Theory of Island Biogeography to propose general rules for design of protected areas.
One rule was that a single large reserve was always preferable to having several smaller reserves of equal area.
Idea became popular, was incorporated into many conservation biology textbooks, and was used to guide real world conservation planning.
Challenged by Dan Simberloff, → key assumption that smaller reserves must contain nested subsets of species found in the larger reserve. If, however, smaller reserves each have their own unique species, it would be possible for several small reserves to have more species than a single large reserve.
Debate continues to this day, and has set the stage for fragmentation research to become an important area of study in conservation biology.
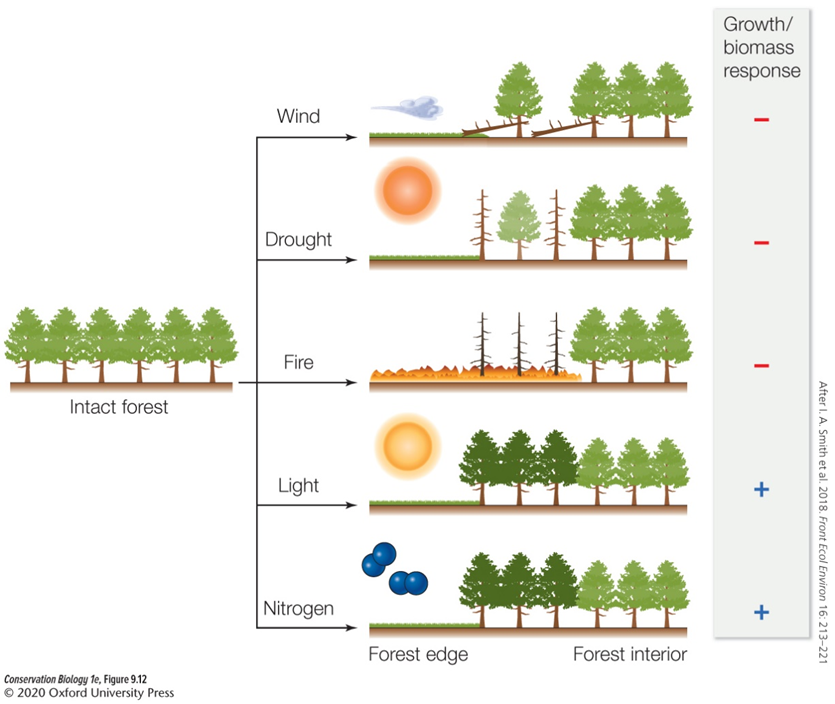
consequences of fragmentation: edge effects
Edge habitat becomes more prominent in fragmented habitats because the area of a patch declines as the square of patch size, whereas the perimeter of a patch declines linearly with patch size
altered rate of herbivory
altered rate of disturbance
changes in light, fire, drought, nitrogen
parasitism and disease can be more prominent
how have time scales been included in fragmentation
Time delays to habitat loss are well known but haven’t been incorporated into the habitat loss vs. fragmentation debate
Current habitat area was a better predictor of occupancy than historical area
BUT past estimates of fragmentation were better predictors of occupancy than current fragmentation.
OVERALL: there is a significant delay in the impact of habitat fragmentation in occupancy
consequences of fragmentation: patch isolation
Isolation is a function of both the distance between habitat patches and the matrix that separates those habitat patches
As the distance between patches grows, dispersal between them becomes increasingly difficult. As the matrix that separates habitat patches becomes increasingly hostile to dispersal, the successful emigration out of patches, and immigration into patches, becomes less likely.
impede the movement of individuals between the different habitats in a landscape that are required to complete their life cycles.
can restrict immigration and emigration to and from patches in ways that reduce population size and increase the risk of extinction in the landscape
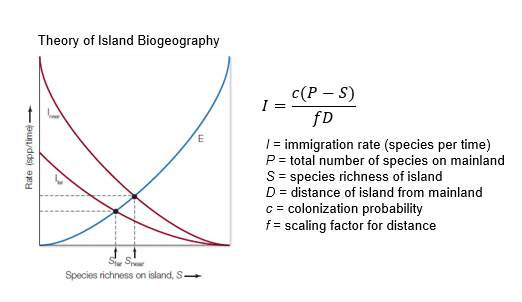
theory of island biogeography
theory of island biogeography
Island biogeography theory tries to explain species richness at equilibrium for islands (or habitat patches) using key predictors, including distance to the source of colonists and island area
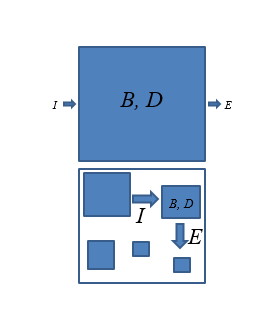
what are the four most important paraments in population dynamics
the BIDE factors: birth, immigration, death, and emigration

erosion and sedimentation
Over geologic time scales, rates of continental erosion are balanced by sediment accumulation.
Deforestation, overgrazing, and unsustainable agricultural practices have elevated current rates of soil erosion to 6-cm per hundred years, which is 11-38x faster than that in geologic record.
Half of all topsoil in world has been eroded in the last 150 years.
Each year, an estimated 20.7 Gt of terrestrial sediments are eroded into the world’s rivers. Of this, ~3.6 Gt is retained behind dams in reservoirs, 1.6 Gt remains as bed load in the rivers, 2.9 Gt remains in suspension, and 12.6 Gt flows to the oceans where it deposited as sediment at the mouths of rivers in deldtas, bays, and estuaries.
desertification
poor soil management practices lead to soil degradation that causes relatively dry areas of land to become increasingly arid and lose their water bodies, vegetation, and wildlife
more than a billion people are under threat from further desertification
Many areas of the world that currently support grasslands and shrublands are in danger of becoming deserts.
how has desertification affected the Aral Sea
Once the 4th largest lake, the Aral Sea lost 74% of its area and 90% of its volume after the Soviet Union diverted water from its source rivers (the Amu Darya and Syr Darya) for cotton cultivation in the 1950s (much of which crashed bc of salt).
Loss of fishing (in 1957, it supplied 13% of all Soviet fish, whoops!), agriculture, groundwater, and stable climate prompted economic collapse and a mass migration of people.
North Aral Sea now the focus of an $86M “restoration” effort financed by World Bank.
Repairs to existing dikes to prevent spillage, dam construction to retain water.
11-ft increase in water levels after seven months. Some fish stocks have returned.
landscape mosaics
patchy, spatially heterogeneous landscapes where some habitats have been lost and converted to human use, others have been heavily degraded, and those that remain are small, fragmented, and disconnected from one another.
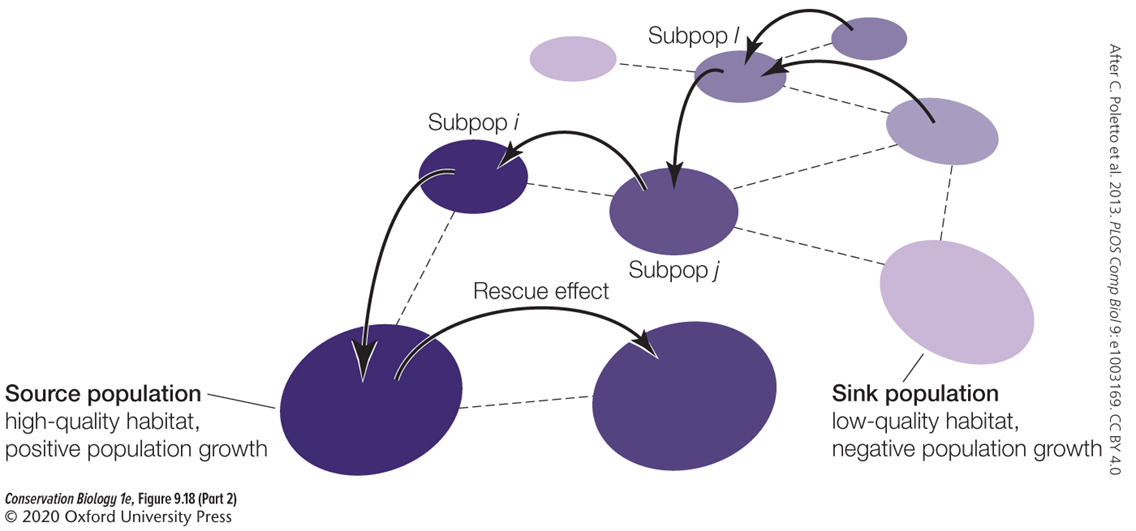
meta-population
Describes a species that persists across a landscape mosaic where populations in individual patches ‘come-and-go’; yet, the species persists across the landscape because dispersal among patches generates ‘mass’ and ‘rescue’ effects.
meta-population model
Mathematical model that predicts the probability of species persistence across a landscape mosaic.
when are meta-population models used
Population viability analyses (PVAs)
Risk assessments
Reserve design
Gap analysis / habitat prioritization
Endangered Species Act (ESA) listings and management plans
IUCN Red List assessments
what is the classic meta-population model formula

f = fraction of patches occupied by species in a landscape (0 = none, 1 = all)
pi = probability that an unoccupied patch in the landscape will become occupied via immigration
pe = probability that an occupied patch will be made vacant due to local extinction
If pi > pe, f ̅ positive, species persists
If pi < pe, f ̅ negative, species goes extinct
what is the patch occupancy at equilibrium formula

f = fraction of patches occupied by species in a landscape (0 = none, 1 = all)
pi = probability that an unoccupied patch in the landscape will become occupied via immigration
pe = probability that an occupied patch will be made vacant due to local extinction
If pi > pe, f ̅ positive, species persists
If pi < pe, f ̅ negative, species goes extinct
mainland meta-population model
