Sampling Distribution, Central Limit Theorem, & Standard Error of the Mean
1/11
Earn XP
Description and Tags
Lecture 5
Name | Mastery | Learn | Test | Matching | Spaced | Call with Kai |
|---|
No study sessions yet.
12 Terms
Z-scores helpful vs when they’re limited
As a tool for understanding where a score falls within a normal distribution, z-scores are helpful
When, however, is the utility of z-scored limited?
They don’t work with non-normal distributions
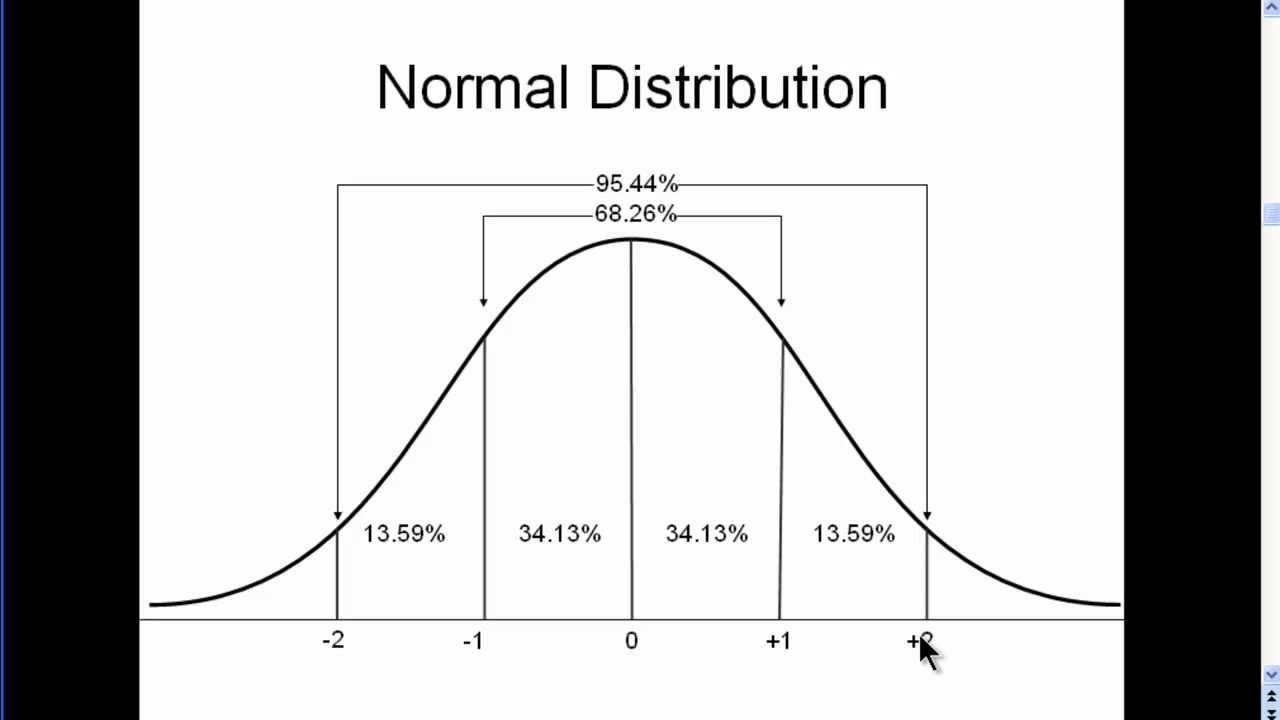
Normal distribution
Bell-shaped curve where most data points cluster around the mean, and the frequency of values tapers off symmetrically toward the tails
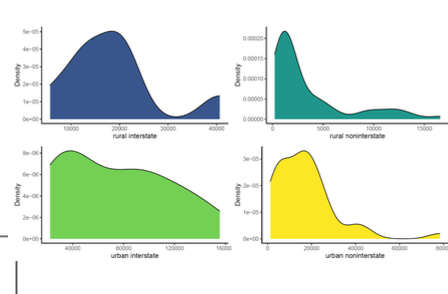
Non normal Distribution
Data that doesn’t follow the symmetrical, bell-shaped curve of a normal (or Gaussian) distribution
Inferential Statistics
Use patterns of data within a sample to make probabilistic about patterns of data within the entire population
i.e they use data from a few dozen people (or more) to make conclusions about millions!
CENTRAL LIMIT THEOREM (secret sauce of inferential stats)
For a given variable, even when the distribution of raw data is non-normal, the sampling distribution of several sample means will always approach normality
In other words, you’ll ALWAYS end up with a normal distribution if you make a histogram of a crap-ton of sample means for a variable
CENTRAL LIMIT THEOREM DETAILS
More sample means → closer to a normal distribution of means
higher N per sample mean → closer to a normal distribution of sample means
higher N per sample mean → a narrower distribution of sample means
Why/how is CLT the “secret sauce” of inferential stats?
Because we know the distribution of sample means is always normal… once we have one sample mean, we can make confident, probabilistic predictions about the population mean
Standard Error of the Mean
(SE) = the standard deviation of sample means
Per CLT, there is always a normal distribution, so the z-score rules always apply!
SE is rarely truly knowable or known.. but…
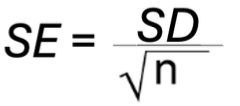
To estimate (“calculate”) SE:
SE = SD/square root nx
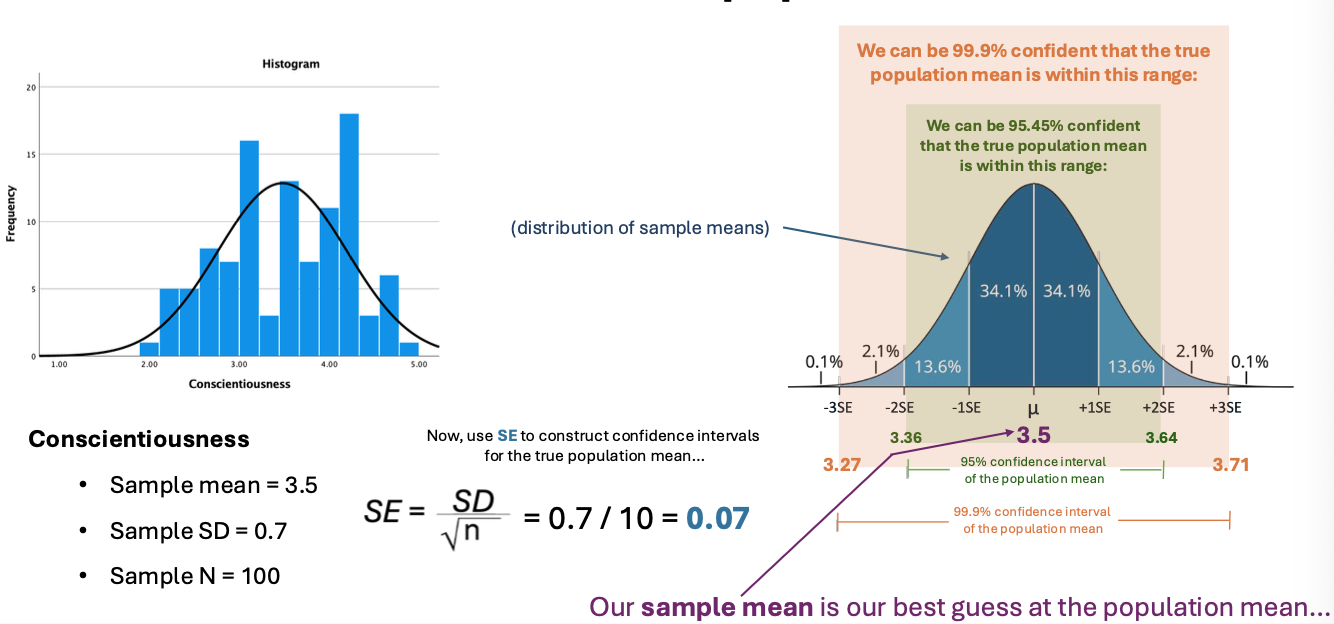
Using CLT, SE, and the sample mean to make an inference about the population mean
What is the Central Limit Theorem? What are the “extra details”?
Central limit theorem states that for a given variable, even when the distribution of raw data is non-normal, the distribution of several sample means will always approach normality
Detailes:
More sample means → closer to a normal distribution of means
higher N per sample means → closer to a normal distribution of sample means
higher N per sample means → a narrower distribution of sample mean s
What is Standard Error of the Mean (SE)?
Standard deviation of all possible sample means that could be drawn from a population
it estimates the range within which a population mean is likely to fall
SE equals SD over the square root of n
How are CLT and SE used to make an inference about the population mean from the known sample mean, SD, and N?
CLT: sampling distribution of mean is (ˉx) is ~normal if n is large, centered at μ (population mean)
SE: Se = S/square root of n; measures variability of sample mean