GW Blok 6 Seminar 2.1 Descriptive statistics for two categorical variables
1/12
There's no tags or description
Looks like no tags are added yet.
Name | Mastery | Learn | Test | Matching | Spaced | Call with Kai |
|---|
No analytics yet
Send a link to your students to track their progress
13 Terms
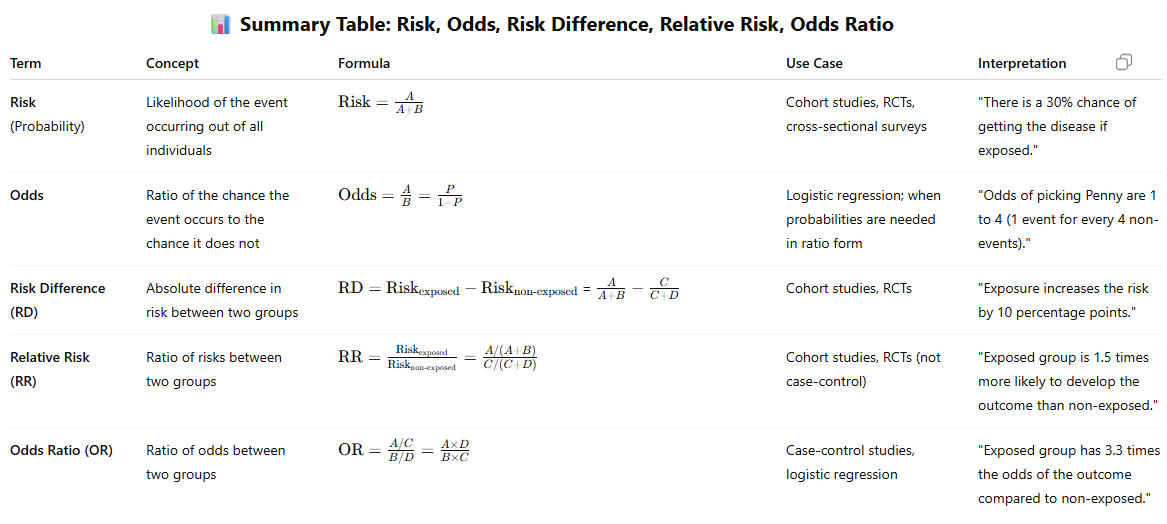
Comparison Table: Risk vs Odds vs Odds Ratio vs Relative Risk vs Risk Difference
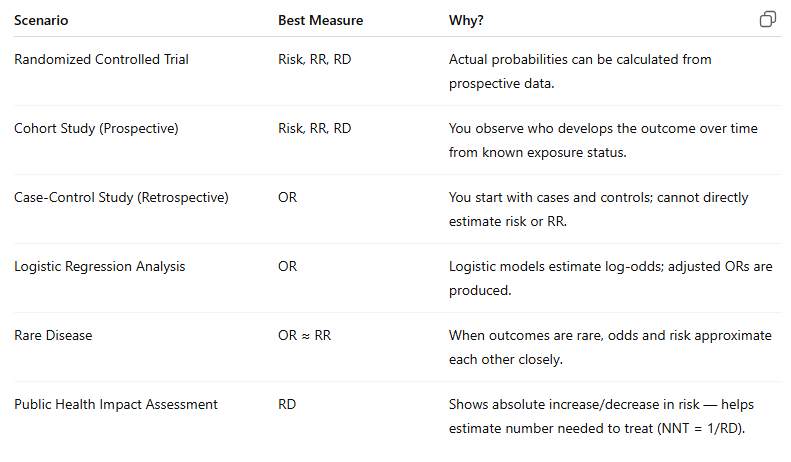
When to use Risk, RR, RD and OR
What is risk in statistics?
Risk (also called probability) is the likelihood that an event occurs out of the total population.
Risk = A/A+B
What is odds in statistics?
Odds are probability or rate of occurances/probability or rate of non-occurances
Odds: A/B = P/1-P
If 1 in 5 people pick Penny, the odds are 1 to 4.
How are odds and risk different?
Risk = chances out of total
Odds = chances of event / chances of non-event
Note: They are close when the event is rare, but diverge when the event is common.
What is risk difference (RD)/attribunal risk (AR)?
The absolute difference in risk between two groups (exposed vs. non-exposed).
It tells us the absolute increase or decrease in risk due to an exposure.
Formula: P(D/Exposed) - P(D/not exposed)
Interpretation: Someone who is exposed to the risk factor is 1.1 times more likely yo get the disease or being exposed to the risk factor increases your risk of disease by 10%
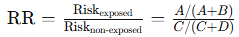
What is relative risk (RR)?
The ratio of risk in the exposed group to risk in the non-exposed group.
Unfortunately, it is not always possible to determine the relative risk. It is only possible if a representative part of the target population is sampled.
Formula: P(D/Exposed)/P(Disease/not exposed)
Interpretation: Someone who is exposed to the risk factor is 1,5 times more likely to get the disease than someone who wasn’t exposed or being exposed to the risk factor increase you chance of the disease by 50%
RR > 1: Higher risk in exposed group
RR < 1: Lower risk in exposed group
RR = 1: No difference
RR eph vs gzw = 2.3 dus RR gzw vs eph = 1/2,3
Conclusion: RR > 1 if and only if OR > 1
RR < 1 if and only if OR < 1
RR = 1 if and only if OR = 1
What is odds ratio (OR)?
The ratio of odds of an event in the exposed group to the odds in the non-exposed group.
In a case control type of design we can’t estimate the prevalence or incidence, so the OR is then used
This is for rare diseases
The most common use of case control is for rare diseases
Formula: odds(disease/exposed)/odds(disease/not exposed)/P(of the event occuring)/P(of the event not occuring)
Interpretation: The odds of disease for someone that is exposed are 1.71 times the odds of someone that is not exposed or for someone that is exposed the odds of disease increase by 71%
OR > 1: Greater odds in exposed group
OR < 1: Lower odds in exposed group
OR = 1: No association
OR eph vs gzw = 2.3 dus OR gzw vs eph = 1/2,3
Case control study and OR
Case control design
Selecting people who have the disease and people who don’t have the disease and we ask about their exposure
Therefore you can’t estimate P(D/E), P(No disease/E), P(D/Not exposed) and P(No disease/Not exposed)
OR: Odds (E/D)/Odds (E/No disease) (we can estimate prevalence for exposure)
= P(E/D)/P(Not exposed/D) / P(E/No disease)/P(No exposure/No disease)
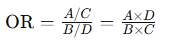
= (A/(A+C))/(C (A+C)) / (B/(B+D))/(D/(B+D))
= (A/C)/(B/D) or A x D/B x C
What is the chi-square test and what are the H0 and Ha?
Chi-square test tests for independence between two variables (X & Y) that are both categorical/factors in other words to test whether there is an association (or independence) between two categorical variables.
The variables can have two or more levels, but the groups formed by X are independent
Non-parametric test, but it uses a theoretical distribution and requires large sample sizes, similar to parametric tests.
H0: there is no relation between social distancing and program
Ha: there is a relation between social distancing and program
𝐻0: 𝜋 𝑠𝑜𝑐𝑖𝑎𝑙 𝑑𝑖𝑠𝑡𝑎𝑛𝑐𝑖𝑛𝑔 = 𝑦𝑒𝑠|𝐸𝑃𝐻1026 = 𝜋 𝑠𝑜𝑐𝑖𝑎𝑙 𝑑𝑖𝑠𝑡𝑎𝑛𝑐𝑖𝑛𝑔 = 𝑦𝑒𝑠|𝐺𝑍𝑊1026
𝐻𝑎: 𝜋 𝑠𝑜𝑐𝑖𝑎𝑙 𝑑𝑖𝑠𝑡𝑎𝑛𝑐𝑖𝑛𝑔 = 𝑦𝑒𝑠|𝐸𝑃𝐻1026 ≠ 𝜋 𝑠𝑜𝑐𝑖𝑎𝑙 𝑑𝑖𝑠𝑡𝑎𝑛𝑐𝑖𝑛𝑔 = 𝑦𝑒𝑠|𝐺𝑍𝑊1026
Because RR and OR are limited to 2x2 tables, while the Chi-square test can handle larger contingency tables with more categories (e.g., 3x2, 4x3). → more useful
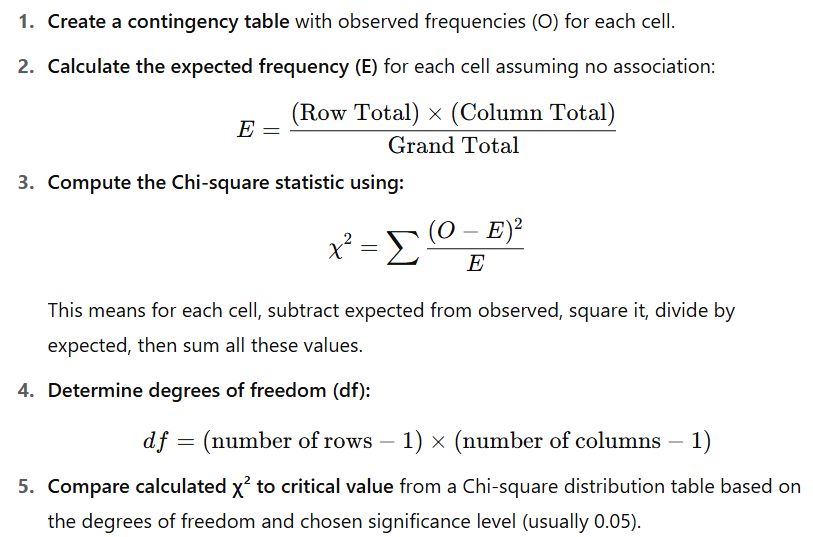
How do you calculate chi2 and interpret chi2?
Minimum: 0 (perfect match between O and E) → no association
Maximum: ∞ (complete mismatch) → association
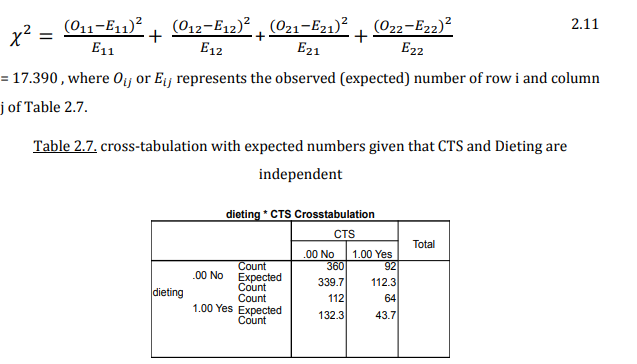
How do you calculate the expected frequency for a cell under H₀?
E = (Row Total)×(Column Total)/Overall Total
How do you calculate chi2 by hand?
Step 2 you can subtract and add with the row or column total to calculate the other values. 1 values has to be calculated with the expected frequency formula