Week 5
1/17
There's no tags or description
Looks like no tags are added yet.
Name | Mastery | Learn | Test | Matching | Spaced |
|---|
No study sessions yet.
18 Terms
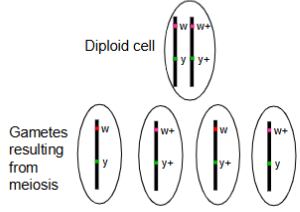
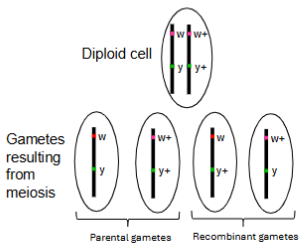
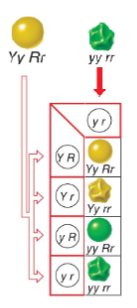
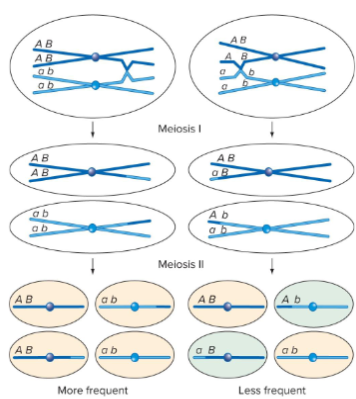
In an individual heterozygous for
two genes (w and y), there are
four possible genotypes for the
gametes:
• wy
• w+y+
• w+y
• wy+
If the genes are located on the
same chromosome, how can
the latter two gamete genotypes
arise?
Parental genes are more likely to be formed than the recombinant genes.
w⁺y and wy⁺ arise due to crossing over between linked genes during meiosis I, creating new combinations of alleles not found together on the original parent chromosomes.
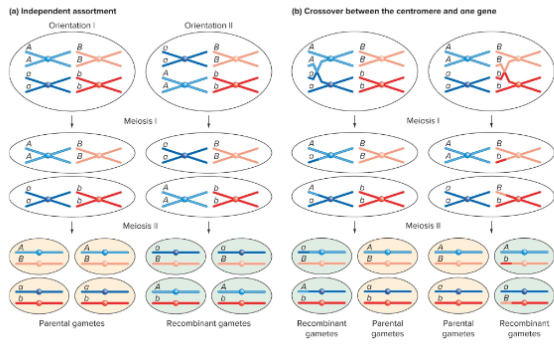
Gene linkage
Tendency for genes located on the same chromosome, in close proximity to one another, to be inherited together during meiosis.
(the alleles for separate genes do not assort independently, and gametes are more likely to have allele copies for two or more genes that match one parental chromosome or the other, rather than allele copies for two or more genes that reflect a mixing of parental chromosomes)
Syntenic genes
Genes located on the same chromosome.
Example of genes not assorting independently
Hemophilia A and colour blindness are distinct traits, but both genes are located on the X chromosome.
For independently assorting genes, we would expect inheritance of hemophilia causing alleles to be independent of inheritance of colour blindness causing alleles.
But individuals in this pedigree always have either both traits or neither trait.
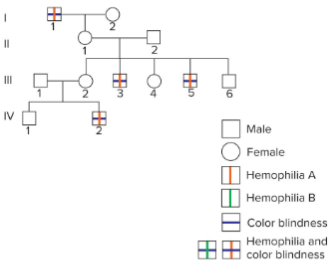
Degree of gene linkage can vary
Hemophilia B and colour blindness are also distinct traits both controlled by genes located on the X-chromosome.
Individuals in the second pedigree who have one trait may have the other, or they may only have one.
Even though all three genes are located on the same chromosome, the degree of linkage is not consistent.
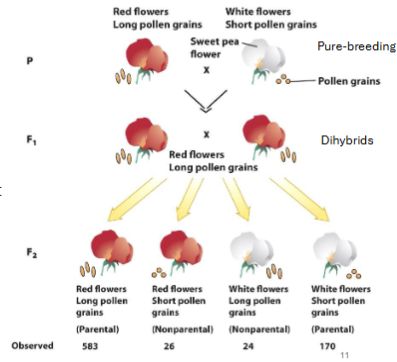
How to tell if a gene is linked or independently assorted
Observing the expected ratio is indication that genes are not linked.
E.g. (flower colour and pollen grain length, expected pheno ratio 9:3:3:1, observed is 24:1:1:7)
Suggests genes for flower colour and pollen grain length are linked.
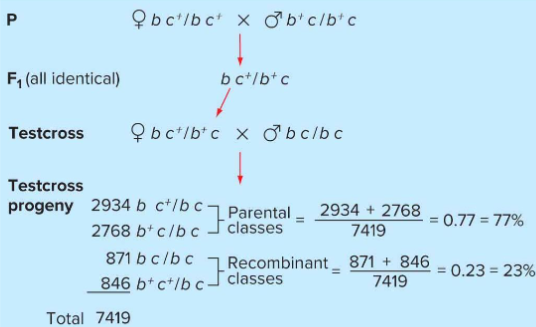
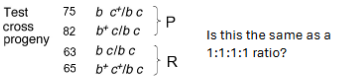
Test crosses for analysis of gene linkage
Heterozygote x recessive homozygote
Phenotype of offspring reflects the gamete that was inherited from heterozygous parent.
Can establish the rate of crossover events by comparing expected phenotypic ratio (in this case, 1:1:1:1)
Gene linkage in autosomal genes
In the test cross, the homozygous recessive parent always contributes a chromosome containing b and c.
Heterozygous parent can contribute one of four chromosome configurations:
bc+, b+c, bc, b+c+
The first two configurations do not require crossing over, the latter two do.
With no linking, you would expect 1:1 parental and recombinant classes.
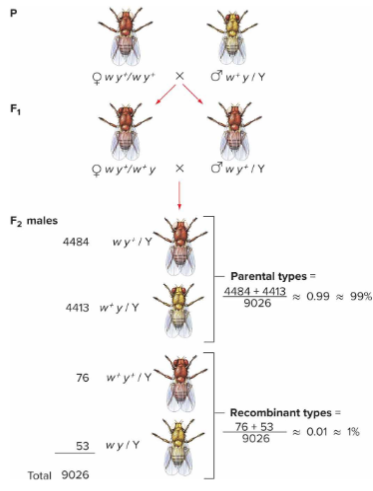
Gene linkage for X-linked genes + why test cross not needed
For genes on X chromosome, can cross a heterozygous female with any male if we only look at male offspring.
A test cross isn’t needed for X-linked genes because males show the allele they inherit from their mother, making it easy to study linkage and recombination just by examining male phenotypes.
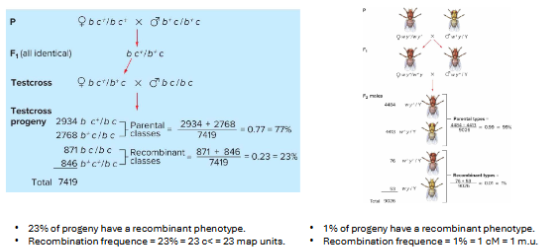
Recombination frequency and distance + units
The probability of a crossover between two genes increases with the distance between them.
Recombination frequency (RF) can be used to estimate physical distance between genes.
1% RF = 1 centimorgan (cM) = 1 map unit (m.u.).
Are recombinant gametes less frequent than parental gametes when genes are linked? (info on crossing over and RF)
It is more likely for crossing over to not occur between two genes that it is for it to occur.
The closer the two genes are to each other, the less likely there will be a crossing over event between them.
Lower RF the closer the genes are.
What leads to a recombination frequency of 50%?
Two genes on two different chromosomes have a recombination frequency of 50%.
Two genes located very far apart on the same chromosome have recombination frequencies of almost 50%.
Chi Square Test
Can be used to evaluate if the numbers of offspring in various phenotypic/genotypic categories are likely to be due to random chance or due to linking.
Compares observed values to predicted values.
The larger the sample size, the more reliable the test is.
Null vs alternative hypothesis
Null hypothesis H0:
Observed pattern is due to chance. The effect being studied does not exist.
Alternative hypothesis H1:
The pattern is due to a real effect.
If the null hypothesis is rejected, you can accept the alternative hypothesis as a likely explanation.
Null hypothesis example
Null hypothesis: the ratio of progeny in each phenotypic/genotypic class after a test cross does not differ from the expected ratio; the genes are not linked. (Null should always be no link)
Alternative hypothesis: the ratio of progeny in each phenotypic/genotypic class after a test cross does differ from the expected ratio; the genes are linked. (Alt should always be linked)
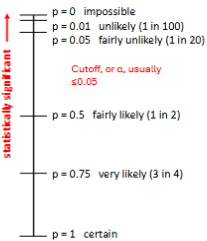
Statistical significance
p-value: the likelihood of obtaining the observed result, or one mor extreme, if the null hypothesis is true.
The lower the p-value, the less likely you are to get a false positive. (Concluding that an experimental ratio is significantly different from the expected ratio when it isn’t).
Degrees of freedom
Number of classes - 1
Summary of Chi Square Test
Use data to obtain: total number of offspring and degrees of freedom.
Calculate expected number of offspring (with no linkage)
Apply chi square equation
Determine critical x2 value corresponding to degrees of freedom in the experiment and the pre-set value of a in critical table.
Compare calculated x2 value to critical x2 value.
If value is > than critical value, reject null.
If value is < than critical value, fail to reject null.Reject —> genes are linked.
Fail to reject —> genes are not linked.