4.3 Probability with t-Distribution
1/27
There's no tags or description
Looks like no tags are added yet.
Name | Mastery | Learn | Test | Matching | Spaced | Call with Kai |
|---|
No analytics yet
Send a link to your students to track their progress
28 Terms
[know] When the population standard deviation (σ) is not known, why is the sample standard deviation (s >) used to calculate probability?
a) Because the spread of the sample (s) is the best estimate of the spread of the population (σ).
b) Because the sample standard deviation is a component of the population standard deviation.
c) Because both are standard deviations.
d) Because sample standard deviation is the square-root of sample variance.
a
[know] There is only one possible value for the population standard deviation for a given population, . How many possible values are there for the sample standard deviation taken from this population?
a) There are many, many possible values for the sample standard deviation.
b) There is only one possible value for the sample standard deviation.
c) There are several possible values for the sample standard deviation, but not many.
d) There are the same number of possible values for the sample standard deviation as there are for the population standard deviation.
a
[know] Why is the t-Curve wider than the z-Curve?
a) Because the sample standard deviation has a wider spread than the population standard deviation.
b) Because the t-Curve contains less information than the Iz-Curve.
c) Because the t-Curve is less accurate than the z-Curve.
d) Because the area under the t-Curve is greater than one (1).
a
[know] The t-Distribution cannot be used to find the probability of an event.
t/f
f
[know] What is the shape of the t-Distribution?
a) The t-curve is bell shaped, but not normal shaped.
b) The t-curve is normal shaped.
c) The t-curve is uni-modal and skewed.
d) The t-curve has a different shape for every degree of freedom.
a
[know] What is the location of the t-Distribution?
a) The t-distribution has a mean of zero.
b) The t-distribution has a different mean for every degree of freedom.
c) The mean of the t-distribution is dependent on the standard deviation.
d) The mean of the t-distribution is equal to the mean of the population.
a
[know] What is the spread of the t-Distribution?
a) he t-distribution has a different spread for every degree of freedom.
b) The t-distribution has a different spread for every standard deviation.
c) The t-distribution has a spread of one (1).
d) The standard deviation of the t-distribution is equal to the standard deviation of the population.
a

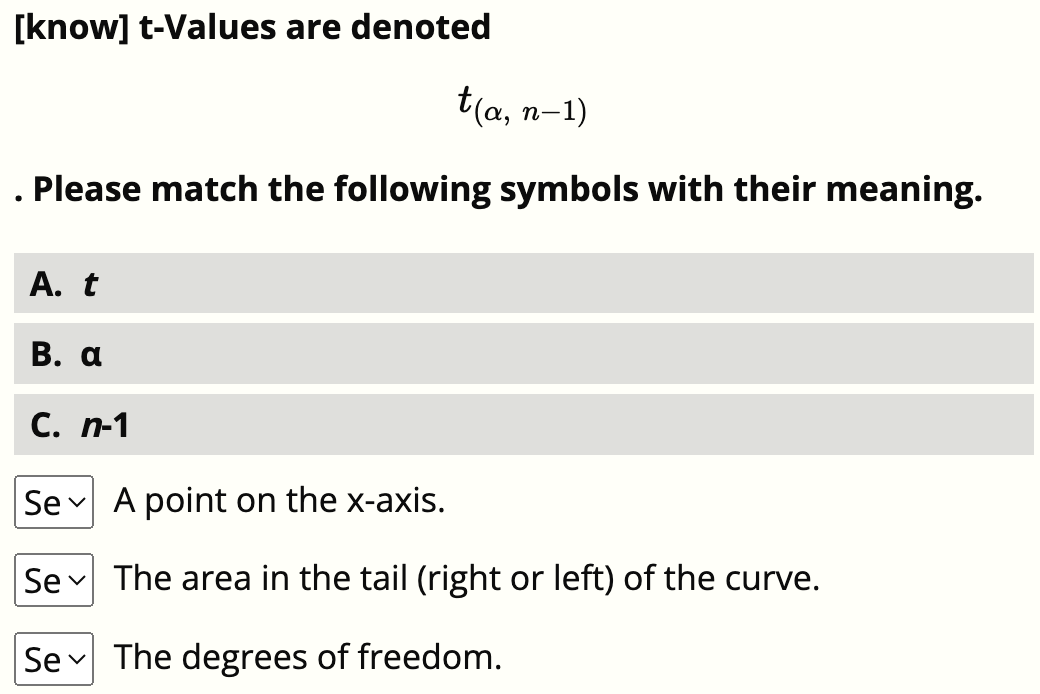
Please match the following symbols with their meaning.
A. t
B. α
C. n-1
-A point on the x-axis.
-The area in the tail (right or left) of the curve.
-The degrees of freedom.
a, b, c

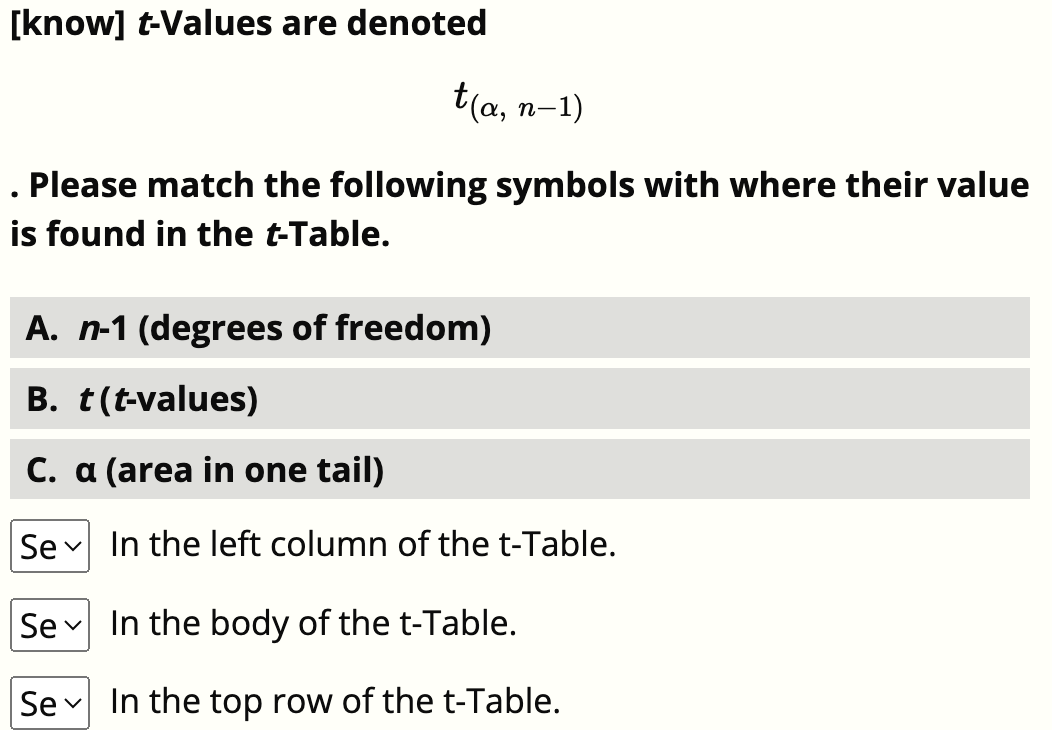
Please match the following symbols with where their value is found in the t-Table.
A. n-1 (degrees of freedom)
B. t (t-values)
C. α (area in one tail)
-In the left column of the t-Table.
-In the body of the t-Table.
-In the top row of the t-Table.
a, b, c
![<p><strong><span>[know] Select the correct equation for the </span><em>t</em><span>-Equation.</span></strong></p>](https://knowt-user-attachments.s3.amazonaws.com/e3f4b4ba-0ce0-4a3b-91c3-ba69c9cc3f3b.jpeg)
[know] Select the correct equation for the t-Equation.
a
[know] What is the first step in using the t-Table?
a) Choose the correct row for the degrees of freedom.
b) Choose the correct column for the area in one tail.
c) Choose the correct t-value in the body of the table.
d) Choose the correct t-table for your situation.
a
[know] Use the t-table to find the correct t-value for a sample size of 6 and a right tail area of 0.10.
1.476
[know] Use the t-table to find the correct t-value for a sample size of 12 and a right tail area of 0.025.
2.201
[know] Use the t-table to find the correct t-value for a sample size of 18 and a left tail area of 0.05.
1.74
[know] Use the t-table to find the correct tail area for a sample size of 20 and a t-value 2.539.
0.01
[know] Use the t-table to find the correct tail area for a sample size of 32 and a t-value 1.309.
0.10
[know] Use the t-table to find the correct tail area for a sample size of 40 and a t-value 3.313.
0.001
[calc] A new workout app claims that users could burn 350 calories on average per workout session. A local statistics student questions this claim so she gets 12 of her friends to follow the workout app and calculates the average number of calories burned. The standard deviation of this sample of calories burned was found to be 25 calories. What is the probability that the sample average of her friends is over 363?
a) 0.05
b) 1.801
c) 0.10
d) 2.201
a
[calc] A restaurant chain has a known satisfaction rating of 8.6 units. A local restaurant owner wants to know how his restaurant compares, so he asks 25 customers for their satisfaction ratings and records the average rating. The sample standard deviation of this sample was calculated to be 1.5 units. What average rating would the owner need to have so that less than 25% of his customers disliked his restaurant?
a) The owner would need an average rating of 8.39 units.
b) The owner would need an average rating of 8.8 units.
c) The owner would need to collect more satisfaction ratings.
d) The owner would need an average rating of 8.6 - (0.25*8.6) \= 6.45 units.
a
[calc] A fishery graduate student caught 10 fish in the university lake that had an average length of 4 inches and a standard deviation length of 1.18 inches. The population mean length of fish in this lake was 3.6 inches. He wanted to know how exceptional his average length was so he asked a statistics student, what is the probability of the sample average being greater than 4 inches?
a) 0.15
b) 0.20
c) 0.25
d) 0.10
a
[calc] A kindergarten teacher had an incoming class of 18 students that seemed to be shorter than usual. She measured these students and calculated an average height of 37 inches and a standard deviation height of 2.6 inches. If the population mean height was known to be 39 inches, what percent of a class of incoming kindergarten students would have a sample average less than 37 inches?
a) 0.25%
b) 2.50%
c) 5%
d) 0.05%
a
[calc] A fishery graduate student caught 10 fish in the university lake and calculated their average length. The standard deviation length of this sample was 1.18 inches. The population mean length of fish in this lake was 3.6 inches. What is the probability of the sample average being less than 2.7 inches or greater than 4.5 inches?
a) 0.04
b) 0.02
c) 0.24
d) 0.10
a
[calc] A new workout app claims that users could burn 350 calories on average per workout session. A local statistics student questions this claim so she gets 12 of her friends to follow the workout app and calculates the average number of calories burned. The standard deviation of this sample of calories burned was found to be 25 calories. What is the probability that the sample average of her friends is less than 340 or greater than 360 calories burned?
a) 0.20
b) 0.10
c) 0.40
d) 0.14
a
[calc] A kindergarten teacher had an incoming class of 28 students that seemed to be both shorter and taller than usual. She measured these students, calculated the sample average height, and calculated a standard deviation height of 2.6 inches. If the population mean height of incoming kindergarten students was known to be 39 inches, what is the probability of the average height of this class being less than 37.5 inches or greater than 40.5 inches?
a) 0.005
b) 0.0025
c) 0.01
d) 0.02
a
[calc] A town in Sweden was known to have long-lived residents with a mean life span of 80 years. To find out if this was still true, a sociology researcher found the life span of 40 residents, calculated the average life span, and calculated a standard deviation life span of 8 years. What is the probability that this average life span is less than 77.4 years?
a) 0.025
b) 0.0025
c) 0.05
d) 0.02
[calc] A town in Sweden was known to have long-lived residents with a mean life span of 80 years. To find out if this was still true, a sociology researcher looked at several samples of 40 residents that had a standard deviation life span of 8 years. What would be the lowest and the highest life span of the middle 90% these residents?
a) Between 76.7 years and 83.3 years.
b) Between 77.9 years and 82.1 years.
c) Between 79.2 years and 80.7 years.
d) Between 79.7 years and 80.3 years.
a
[calc] A new workout app claims that users could burn 350 calories on average per workout session. A local statistics student questions this claim so she looked at samples of 12 people with a standard deviation of 25 calories burned. What would be the least number and the greatest number of calories burned for the middle 95% these residents?
a) Between 336 and 364 calories burned.
b) Between 332 and 408 calories burned.
c) Between 334 and 366 calories burned.
d) Between 345 and 355 calories burned.
a
[calc] A fishery graduate student went fishing in the university lake where the fish were known to be 14 inches long on average. The graduate student caught 8 fish and calculated a standard deviation length of 1.5 inches. What would he expect to be the shortest and the longest average length of the middle 99% of samples?
a) Between 12.92 and 15.07 inches long.
b) Between 13.34 and 14.65 inches long.
c) Between 11.15 and 16.85 inches long.
d) Between 12.14 and 15.85 inches long.
a