Yr 11 ATAR Economics - Chapter 1, 2, 3
1/105
There's no tags or description
Looks like no tags are added yet.
Name | Mastery | Learn | Test | Matching | Spaced | Call with Kai |
|---|
No study sessions yet.
106 Terms
Positive Statement
. objective statements (can be proven true/false)
. what’s IN the economy
. testable using economic data
EG: if the gov increases the sales tax on tobacco, people WILL purchase fewer cigarettes
Normative Statement
. subjective statements (based on opinions)
. what SHOULD BE in the economy
. value judgement (one situation is preferable to another)
EG: the gov SHOULD increase the tax on cigarettes
What is the fundamental economic problem?
. Society has limited/scarce resources to produce unlimited wants and needs
—> Problem: Is to match limited resources to unlimited wants and needs
—> Humans have unlimited wants + needs but there are limited number of resources to fulfill those
—> societies need to work out how to produce + distribute (allocate) scarce resources
What are the 3 fundamental economic questions?
What to produce?
How to produce?
For whom to produce?
What to produce: Describe what goods are
. can be seen + touched (tangible)
. can be stored
. there’s a time gap between production and consumption
EG: pen, paper, notebook
What to produce: Describe services
. can’t be seen and touched, but felt (intangible)
. can’t be stored
. no time gap between production and consumption
EG: teaching, medical care, plumbing
3 Types of Resources (Factors of Production - How to produce): Natural Resources
. unprocessed products from nature
—> Renewable natural resources, eg trees
—> Non-renewable natural resources, eg coal, natural gas, gold
3 Types of Resources (Factors of Production - How to produce): Human Resources
. quantity + quality of the labour force
—> Labour: physical or mental effort applied in production
—> Enterprise: coordination or management of production by an entrepreneur AND ideas + skills needed to create new things
3 Types of Resources (Factors of Production - How to produce): Capital Resources
. man made resources which assist in production
—> Physical capital: machinery and equipment needed, eg - pen, computer, vehicles
—> Social overhead capital: basic infrastructure of the economy (eg - transport + communications)
What is Relative Scarcity?
. scarcity = basic economic problem being the gap between limited resources and theoretically limitless wants
—> the economic problem is just the problem of relative scarcity
—> most resources are limited relative to society’s unlimited wants
—> meaning everyone in the economy is constantly having to make choices
Scarcity vs Shortage
Shortage = a situation where demand is greater than the supply at a particular point of time, thus is temporary
Scarcity = always exists, permanent
Opportunity Cost
. the value of the best alternative you give up when you choose one option over another
—> every decision involves a trade off/every decision has a cost
—> opportunity cost = return on the best option not chosen - return on the option chosen
—> true cost of a decision should measure the alternatives which have been given up
—> opportunity cost for billionaires (who can buy anything) = time
What is Economics?
. the study of how people allocate their limited (scarce) resources to satisfy their unlimited wants
Microeconomics
. a branch of economics that analyses the market behaviour of households and firms to understand their decision-making processes
—> deals with economic problem from an individual POV
—> attempts to understand how consumers + producers make decisions
—> how firms behave in an effort to maximise profit
—> how markets + prices work to allocate resources between all the competing industries in the economy
—> the theory of supply and demand
Macroeconomics
. branch of economics that studies the behaviour of an overall economy (markets, firms, consumers, governments)
—> deals with economic problem from society’s POV
—> concerned with performance of whole economy, focusing on total economic activity in terms of total production, employment + overall price level
—> important theories: economic growth (determines a nation’s standard of living) + business cycles (how economies experience fluctuations in economic activity, which affects country’s rate of inflation + unemployment)
—> Economic indicators = GDP (measuring total value of final g + s produced in an economy), inflation rate, unemployment rate
—> EG: economic growth, gov policies
Ceteris Paribus
. latin term = all other things constant (other IV kept unchanged/same)
Economic Systems
. the way in which a country’s resources are allocated to deal with the economic problem
—> determines that allocation of resources + distribution of income
Market Economy
. resources owned privately
. decisions made by the owners of resources, acting in their own self interest
. prices are set through the interaction of buyers + sellers (an economic system in which economic decisions + pricing of products are guided by the interactions of a country’s individual consumers and firms)
Planned/Command Economy
. resources are owned by the state
. decisions made by a planning authority (eg gov)
. prices are set by the gov
Characteristics of the 2 different economic systems
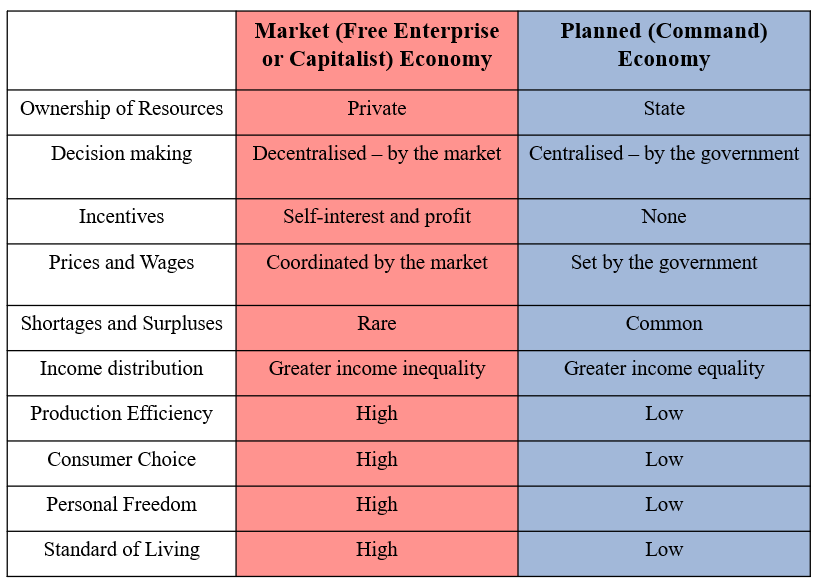
Economic systems spectrum
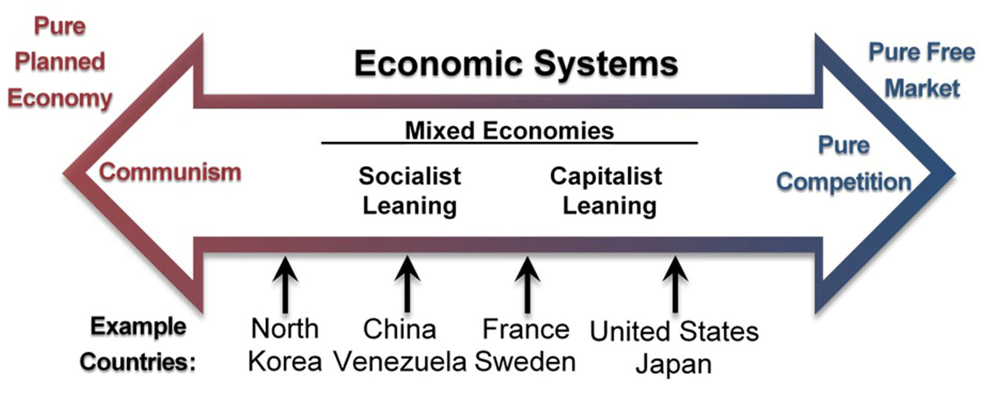
Economic systems spectrum explained
. most economies today combine elements of both market AND planned economies = mixed economies
—> tries to take advantage of each of the positives of the 2 pure economic systems
—> EG: Australia, US, Japan
—> In France + Sweden, gov. accounts for 40-45% of total production
Characteristics of mixed economies
. market economy: markets allocate resources for most g + s = food, housing, clothing, motor vehicles, entertainment, recreation
—> private markets account for ~70% of total production
Planned economy: gov allocation of public health, education, redistributing income (reducing income inequality), law and order, defence sectors = gov sector accounts for 30% of total production
Basic supply and demand model
Marginal Analysis model description
. introductory model
. for understanding how decisions are made
. used to demonstrate how economists assume that all decisions are made using the assumption of rational self-interest (when making decisions people weigh up costs + benefits + do what’s best for themselves)
. demonstrates the concept of marginal benefits and costs
. Shows how consumers weigh up the costs + benefits of a decision and pick the option that maximises their net benefits
What is meant by the assumption of rational self interest?
Rational: decisions are made by weighing up the costs and benefits of the different choices
—> using the info available at the time decision is made
—> opposite of random decision process
Self interest: choice that’s taken is the one that results in the max net benefits
—> largest net gain (=benefits-costs)
Explain what Marginal costs and benefits are
. Marginal = the benefits or costs of the last unit purchased
—> usually, the benefit of each additional purchase gets smaller and smaller (Law of diminishing returns)
—> usually, costs remain constant (marginal costs stays same as first total cost) - irl, would eventually start to rise
Where is the best decision on the Marginal Analysis model
. the one where marginal benefit = marginal cost, as here net benefits are maximised
—> optimal level of production been reached
—> any value other than this, either costs are greater or there are more benefits to be consumed
How to find marginal benefits, marginal costs, and net benefits
Marginal benefit of the next purchase: subtract previous purchases’ total benefits from the next purchases’ total benefits: next purchase total benefits - previous total benefits = next marginal benefits
Marginal costs: remains the same number as the first total cost
Net benefit = benefit - cost
What is the role of markets in an economy?
. markets allocate scarce resources to satisfy the many competing wants in an economic system
—> in markets, there’s incentives for both producers and consumers
—> economists believe that markets are an efficient way to deal with economic problem as they don’t require any resources to function
What elements does a market consist of?
. Buyers (demand)
. Sellers (supply)
. something to exchange (good, service or resource)
. except for basic barter economies, all modern markets include : a medium of exchange (money), which is something that everyone agrees has a set value that they are willing to accept in trade
—> markets can exist without this, but they operate much less efficiently
—> money makes a market more efficient as it’s much easier to arrange trades
What principle do markets function under?
. voluntary exchange = no one is forced to trade with another
What’s a market?
. the collection of all consumers and producers of a particular thing that can be exchanged
—> most economic activity takes place in markets
—> *NOT A PHYSICAL PLACE
How can markets be categorised?
By what’s exchanged: factor vs product markets
By how much gov is controlling market: Regulated vs free market
By how many sellers there are/how competitive: Perfect vs Imperfect market
Factor Market
. buying + selling of factors of production
—> households = supply
—> firms = demand
Product Market
. buying + selling of goods and services
—> households = demand
—> firms = supply
Competitive (Perfect) Market Characteristics
. large number of buyers + sellers (that compete)
. firms are price takers, consumers are price setters
. very similar (homogenous) products
. easy entry into the market (no barriers to entry/exit)
EG: BP, shell, 711 (petrol), fresh produce sellers (woolies buys)
Imperfect Market Characteristics
. small number of firms (1=monopoly, 2=duopoly, 3+ = oligopoly = most markets)
. product differentiation
. firms are price setters, have market power
. entry into the market is restricted
. Less firms = less competition = less efficient
. EG: Australia post
—> is pretty much every market, as there’s always some kind of differentiation in products sold
Competitive (Perfect) Market Advantages and Disadvantages
Advantages:
. helps allocate resources most efficiently
. encourages efficiency
. consumers are charged a lower price
. responsive to consumer wishes
Disadvantages:
. conditions are strict
. insufficient profits for investment
. lack of product variation
. unequal distribution of goods + income
Imperfect Market Advantages and Disadvantages
Advantages:
. can encourage research + development
. can encourage innovation
. economies of scale can be gained
. products are differentiated
. price stability
Disadvantages:
. high barriers to entry
. exploitation of consumers (higher prices)
. potential for inefficiency in market
What is the role of prices in a market
. in a market the 3 key questions are answered by the price mechanism (the interaction of buyers and sellers that determines price of products):
What to produce: consumers signal what to produce through their demand for a particular item
How to produce: firms will produce in a way that will maximise their profit (efficiency + cost minimisation)
For whom: the rewards of production reflect the price which the market is willing to pay for resources
—> price coordinates economic activity in a way that maximises the benefit to society = the invisible hand of the market
Demand Schedules: What is market demand (supply)?
. the sum total of everyone’s individual demand (supply)
—> to calculate, given individual demands: add up individual demands
. schedules less useful as harder to see patterns
Demand
. the buying intentions of consumers
. quantity of product consumers are willing + able to purchase at a given price
—> in model, represented as ‘the quantity demanded’ by a consumer = how much consumers demand at a specific price, holding everything else constant (ceteris paribus)
Law of Demand (relationship between price and demand)
. as the price increases, demand decreases, ceteris paribus
—> negative/inverse relationship
What are the 2 reasons the law of demand exists?
Income effect: when the price of a product rises, less people want it (takes up more income) or can afford it
Substitution effect: if consumers can get another similar product for cheaper, they’ll buy the substitute (trying to get the same benefit for lower price)
—> as price of a product rises, consumers switch to alternative products which now represent better value
—> the closer the substitutes that are available = stronger effect
—> EG: if coke price rises, many consumers switch to pepsi (close substitute), with a resulting large contraction in demand for coke, BUT if tap water prices rise the lack of close substitutes = relatively small contraction in demand
Law of Demand Exceptions
. NO exceptions
—> to break law of demand, if offered same product at 2 different prices, a consumer would have to be willing to pay the higher price for the same product, and as it’s assumed people act in rational self interest, this wouldn’t happen
There are variations in strength however due to forces that affect demand
—> for petrol: forces weaker due to lack of availability of many substitutes
—> for coke: forces are stronger as are many substitutes
Non Price Factor Affecting Demand: 1. Levels of Disposable income
. consumers usually purchase more goods when their income rises
—> true for normal goods:
. increase in income = increase demand (as name brand now takes up relatively less income)
. decrease in income = decrease demand
—> false for inferior goods:
. increase in income = decrease demand
. decrease in income = increase demand
—> Why: even though normal goods cost more, they’re perceived as better over inferior goods which cost less but are perceived as worse
Non Price Factor Affecting Demand: 2. Price of Related Goods
. consumers can choose between a number of products to satisfy the same wants (substitutes)
—> price of one product increases, consumers switch to another similar product to fill the same want for a lower price, eg big macs to whoppers
—> consumers also consume goods in conjunction with other goods = complements
—> price of a product increases, consumers switch to a substitute, so there’s also a decrease in demand for the complement that accompanies the original product, eg increase in pizza price = decrease in garlic bread demand/sales
Non Price Factor Affecting Demand: 3. Tastes and Preferences
. change over time
—> EG: decreasing the demand of old products, and increasing the demand of new products due to technological advancements/innovation overtime
—> 1990s = CDs, DVDs
—> Present = Spotify, Netflix
—> demand for 1990s products has decreased
—> trends and associated groups could also affect preferences
Non Price Factor Affecting Demand: 4. Expectations of Consumers
. if consumers think that prices are going to change in the future, they may buy more now or save buying until later
—> expected price increase = increase current demand (buy now)
—> expected price decrease = decrease current demand (buy later)
—> is rational behaviour
Non Price Factor Affecting Demand: 5. Demographic factors
. composition of population: age, gender, income, education, family life cycle, religion, socioeconomic status
—> pop growth = more demanded generally
—> pop growth in specific demographic = more demand for products demanded by that demographic
—> EG: increase demand for groceries, cars, fuel
What is a price factor in relation to demand changes
. change in price = movement/shift along the demand curve (expansion or contraction)
—> increase in price = decreased quantity demanded (contraction)
—> decrease in price = increased quantity demanded (expansion)
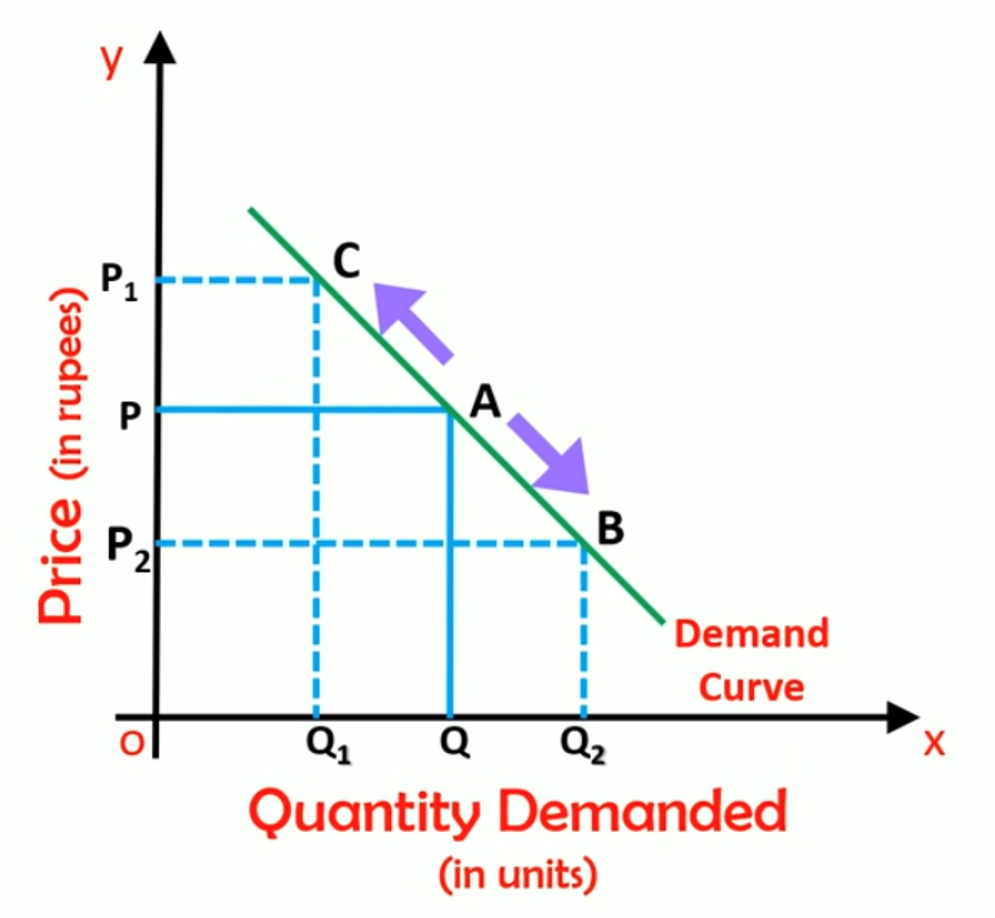
What is a non-price factor in relation to demand changes
. change in a non price factor = shift of the demand curve (increase or decrease in demand)
—> EG: income
—> increase in income = increased quantity demanded
—> decrease in income = decreased quantity demanded
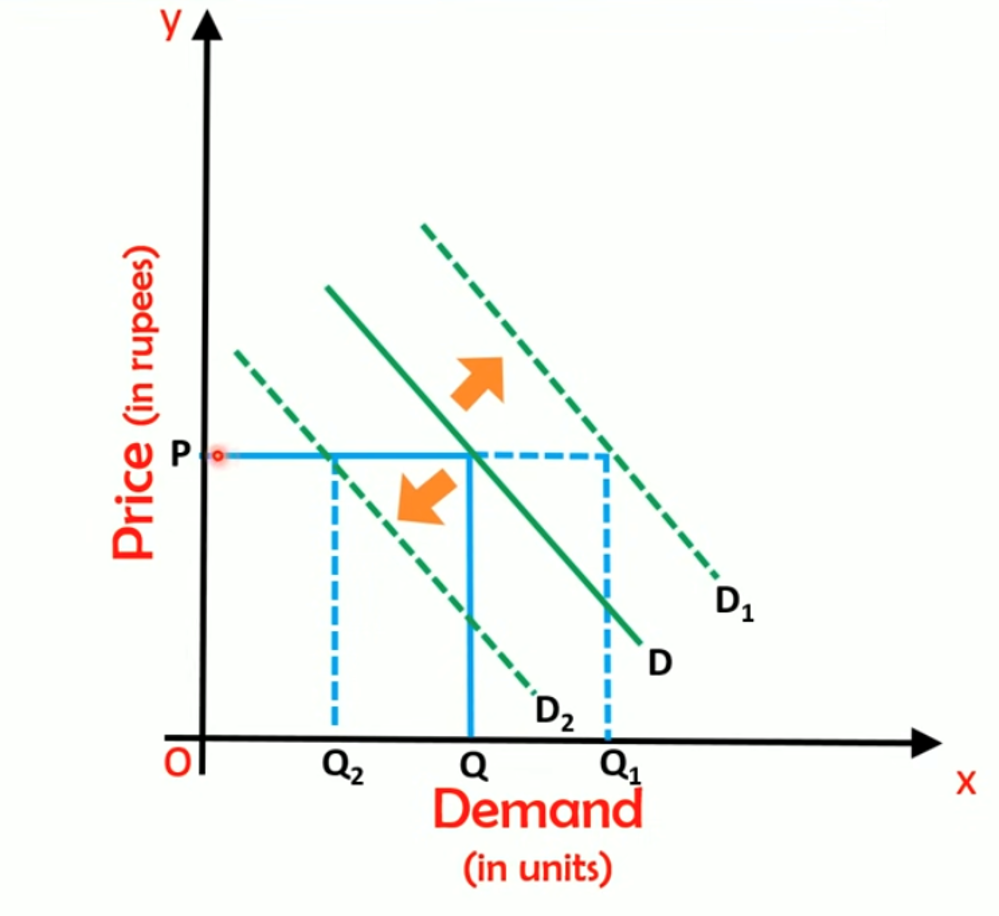
Expansion in Demand vs Increase in Demand
Expansion:
. when price of product decreases, quantity demanded expands (law of demand)
Increase:
. when anything other than price of product changes that increases demand, entire demand line shifts to the right
. the increase in demand results in a new equilibrium (increase in price, increase in quantity)
Contraction in Demand vs Decrease in Demand
Contraction:
. according to law of demand, if price for a product rises then less is demanded (quantity demanded contracts)
Decrease:
. if anything other than price of product changes that reduces demand, entire demand line shifts to the left, resulting in a new equilibrium (decreased price + quantity)
Demand and Total revenue (total expenditure)
. total expenditure (spending) = (price paid per unit) x (number of units bought)
—> as every dollar spent by consumers goes to producers, total expenditure = total revenue
—> Revenue: the total amount of money a business earns from selling its products (gross sales)
What is Supply?
. the producing intentions of producers
. the quantity of a product that producers are willing + able to sell
. selling side of the market
—> represents relationship between market price of product/resource + quantity of that product/resource producers are willing + able to sell
—> it’s a series of price/quantity combinations that form a supply line
—> reflects the costs of production
—> in model, represented as ‘the quantity supplied’ by a producer, referring to how much suppliers supply at a specific price, ceteris paribus
Law of Supply (relationship between price + supply)
. as the price increases, supply increases, ceteris paribus
—> positive relationship
Market supply
. the quantity of something that ALL sellers in a market are willing + able to sell at a given price
Why does the Law of Supply hold true?
Incentive:
. producers will make more of a product if they can make a profit
Production costs increase with the supply of each additional unit:
. suppliers will want a higher price to supply a higher quantity
. EG: farmer may need more machines/labour to produce more cabbages
Non-Price Factors Affecting Supply: 1. Cost of Production
. cost of production increases: for a given price, firms will have to decrease the production of products to reduce costs
—> rational decision as firms need to make profit to run business
—> price of resources determine firm’s cost of production (supply curve = cost curve)
—> product cost = the total price paid for the resources used to manufacture a product/create a service, such as raw materials, wages, factory overhead
Non-Price Factors Affecting Supply: 2. Technology
. knowledge about the techniques of production
. improvements = more output can be produced with the same number of inputs
—> ceteris paribus, leads to increase in supply
Non-Price Factors Affecting Supply: 3. Number of Sellers
. more firms enter the market = market supply for that product will increase
—> firms tend to enter the market if there are high profits to be made
—> as more competitors enter, profits for all firms decrease
—> often leads to firms leaving market = decrease in supply
Non-Price Factors Affecting Supply: 4. Expectations of Producers
. higher price expected in future = decrease in current supply (to be able to sell more at higher price)
—> can encourage firms to invest in capital to be able to produce more in future
. lower price expected in future = increase in current supply (to be able to sell more at the current higher prices)
Non-Price Factors Affecting Supply: 5. Price of other Goods
. As same resources could be used to produce multiple products
—> producer closely monitors movements in prices of the products they are capable of supplying so that they can take advantage of profit opportunities
—> if price of a product increases, more resources used to produce more of that product = increased supply
. if producer is selling 2 different products, and the price of one of the products increases (eg due to other firms raising their prices of that product, thus price is raised to match), they may then switch to using more resources to produce more of that product (more supply) over the other cheaper product (less supply) to maximise profit
—> EG: a car manufacturer will decrease supply of petrol cars if electric cars become more popular
Non-Price Factors Affecting Supply: 6. Availability of resources
. if resources are short in supply, supply will decrease
—> firms can’t produce what they would like so overall supply in the market decreases
—> relates to factors of production
—> has become very evident since pandemic started where many companies have global supply chains + need materials from other countries to make their product
—> as supply chains were disrupted from travelling restrictions, firms couldn’t get resources = less products made = decreased supply
What is a price factor in relation to supply changes?
. change in price = movement/shift along the supply curve (expansion or contraction)
—> change in quantity supplied
—> varying price: changes the min price a supplier would take for the new quantity supplied
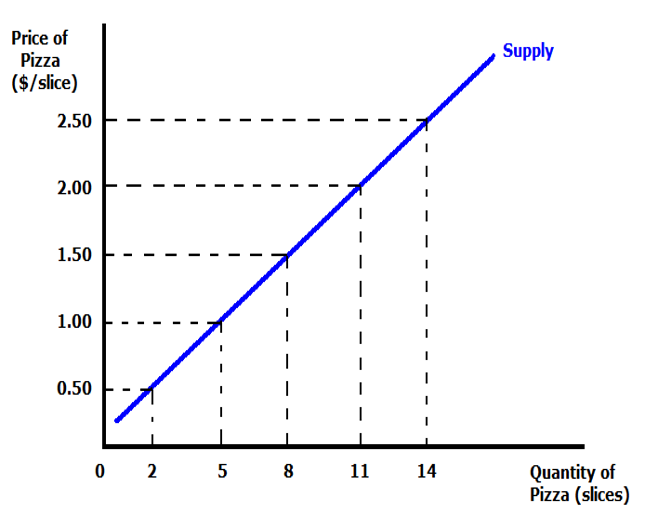
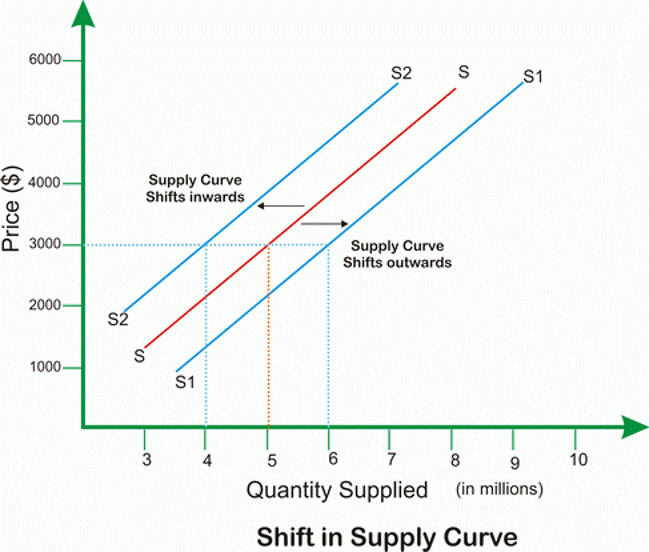
What is a non-price factor in relation to supply changes?
. change in non price factor = shift of the supply curve (increase or decrease in supply)
—> EG: technology
—> increase in tech = increased quantity supplied
—> decrease in tech = decrease in quantity supplied
. moves supply curve
. change in supply
What is Market Equilibrium
. a state where supply and demand for a product are balanced
—> meaning the quantity supplied equals the quantity demanded, resulting in a stable price and quantity.
What does the Market Equilirbrium show?
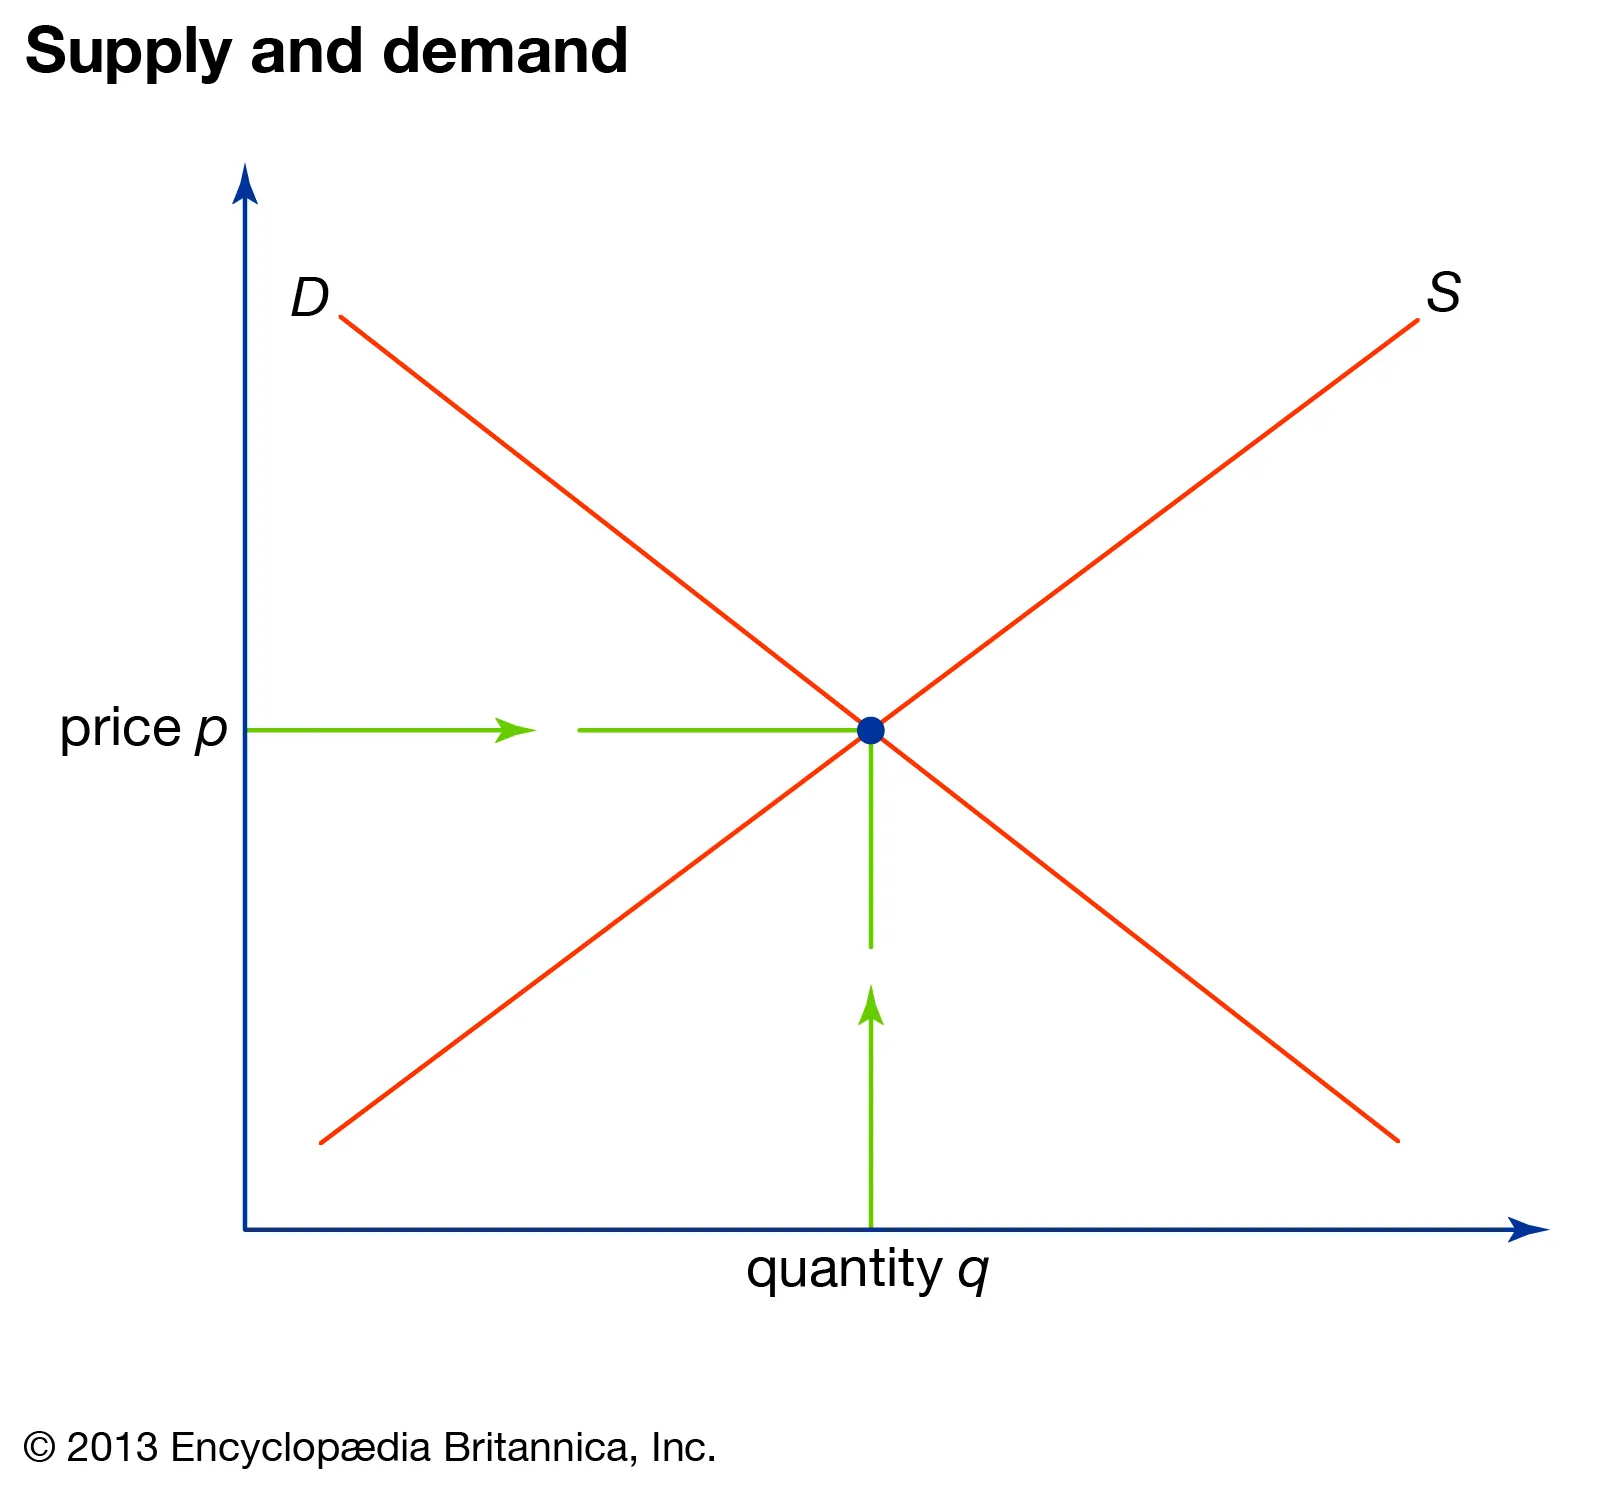
. shows the price where the quantity that buyers are willing to buy exactly matches the quantity that suppliers are willing to supply
Where does market equilibrium occur and what also occurs at this point?
. occurs at the point in which the supply + demand curves intersect
—> price at intersection = equilibrium price
—> quantity at intersection = equilibrium quantity
—> Marginal costs (supply) = Marginal benefits (demand)
—> when there’s equilibrium, market is said to have been ‘cleared’
When does a disequilibrium occur and what occurs at this?
. if market price is above or below equilibrium price = market in disequilibrium
—> occurs when quantity supplied DOESN’T MATCH quantity demanded, resulting in a SHORTAGE or SURPLUS
—> Surplus: when the quantity supplied is greater than quantity demanded
—> Shortage: when the quantity supplied is less than quantity demanded
What will happen to supply and demand if the market is not in equilibrium?
. any price/quantity combination that’s not at equilibrium will automatically lead to a change in the direction of equilibrium
—> these price adjustments = the invisible hand + the price mechanism
What happens when demand is higher than supply?
. temporary shortage (price is too low to clear the market)
—> buyers will bid up the price (contracts demand)
—> causes suppliers to expand supply (expands supply)
= new equilibrium - at higher price + less demand but higher supply
What happens when supply is higher than demand?
. Temporary surplus (price is too high to clear the market)
—> buyers will want to lower the price (contracts supply)
—> causes buyers to expand demand (expands demand)
= new equilibrium with lower price, lower supply but higher demand
What is Price Elasticity (in general)?
a measure of the responsiveness or sensitivity of a quantity to a change in price
What is Price Elasticity of demand?
. the responsiveness of quantity demanded to a change in the price of the product
. simple method: % change in quantity demanded/% change in price
Inelastic (insensitive) demand
. a change in price/income will result in a minimal change in quantity demanded
—> relatively inelastic = <1
—> perfectly inelastic = 0
—> eg medication (necessities)
Elastic (sensitive) demand
. a change in price/income will result in a large change in quantity demanded
—> relatively elastic = >1
—> perfectly elastic = infinity
—> eg foreign currency
Main determinant of the elasticity of demand
. the substitution effect:
—> few substitutes = relatively inelastic demand
—> many substitutes = relatively elastic demand
Midpoint method for calculating PeD

What do different PeD look like?
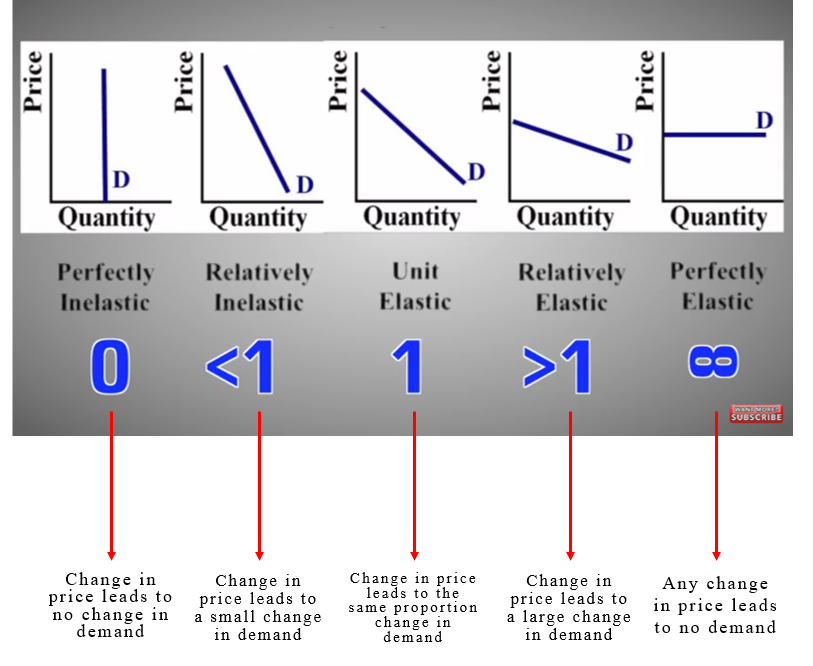
Determinants of PeD: 1. The Availability of substitutes
. many substitutes = price elastic (as if price of the product rises, consumers can easily switch to another product with lower price)
. few/no substitutes = price inelastic
Determinants of PeD: 2. Necessity or Luxury/Importance/Urgency
. necessary/urgent/important = price inelastic
—> consumers still need to buy these necessary products thus will continue to do so even if price rises
. Luxury/not urgent/unimportant = price elastic
—> consumers can go without
—> habit forming + addictive products also price inelastic
Determinants of PeD: 3. Definition of the Market
. a market for a general product is more inelastic than for brands within the market
—> eg: market for petrol
—> market as a whole is relatively inelastic as there are few close substitutes for petrol
—> however, each brand of petrol has relatively elastic demand as BP petrol can be substituted for Shell
Determinants of PeD: 4. Proportion of Income Spent
. large % of income spent = PeD relatively elastic
. small % of income spent = PeD relatively inelastic
Determinants of PeD: 5. Time
. PeD more inelastic when there’s little time to respond to the change in price + look for alternatives
—> immediate run = relatively inelastic
—> as time goes on, demand tends to become more elastic (in short and long run)
. plenty of time to respond = price elastic
. no time to respond = price inelastic
What is price elasticity of supply?
. measures the responsiveness of quantity supplied to a change in price
. USE MIDPOINT METHOD TO CALCULATE
Inelastic (insensitive) supply
. a change in price/income will result in a minimal change in quantity supplied
Elastic (sensitive) supply
. a change in price/income will result in a large change in quantity supplied
Factors determining PeS: 1. Time to respond
. production can be changed either in short or long run
. all supply becomes more elastic in the long run
Short run: within next few months
Long run: longer period of time away (year+)
products that can quickly change their supply in response to price changes = elastic (can change in short term)
—> eg manufacturing
Products that can’t change quickly change their supply in response to price changes = inelastic (can only change change in long run)
—> eg agriculture
Factors determining PeS: 2. Nature of Industry
. factors of production used in an industry determine how quickly or not a producer can adapt to a change in price
—> agricultural industry = inelastic supply
—> manufacturing industry = elastic supply
Factors determining PeS: 3. Ability to store inventories
. inventory = the stock that producers keep for future sale
ability to store inventory = elastic supply
—> eg non perishable goods
Limited ability to store inventory = inelastic supply
—> eg perishable goods
What is a tax?
. a compulsory financial charge or some other type of levy imposed on a taxpayer by a governmental organisation to fund gov activity
Goods and Services Tax (GST)
. consumption tax
. levied on most products at a rate of 10%
. efficient tax (negligible effect on resource allocation)
. 2022: $76 billion
Excise Duty Tax
. extra tax levied on specific goods such as petrol, alcohol and tobacco
. higher rate than GST
. 2022: petrol $18 billion, other $4.5 billion
Tax effect on elasticity
. applying a tax to a product will always increase price but doesn’t increase by the full amount due to the downward sloping demand curve
. How much price rises depends on PeD
—> PeD elastic = lower price increase
—> PeD inelastic = higher price increase
How are incidence and tax revenue determined by price elasticity?
. Incidence:
—> elastic = more on producer
—> inelastic = more on consumer
Revenue:
—> elastic = lower
—> inelastic = higher
Why do governments tend to place taxes on inelastic goods?
. they generate more tax revenue
—> consumers can’t avoid the tax as easily as there’s limited substitutes for good
—> as consumers have to pay more, they’re more likely to change their habits, often resulting in a net benefit to society
—> EG: tax on tobacco/cigarettes = decreased consumption = less health burden
How do you calculate tax revenue collected by the gov, paid by consumers, and paid by producers?
Tax revenue collected by gov = (P1-P0)xQ1
Proportion paid by consumers = (P1-P*)xQ1
Proportion paid by producer = (P*-P0)xQ1