Unit 3 - Spectroscopy & Spectrometry
1/99
There's no tags or description
Looks like no tags are added yet.
Name | Mastery | Learn | Test | Matching | Spaced |
|---|
No study sessions yet.
100 Terms
Spectroscopy
Interaction of light with different molecules
Microwaves vibrates
OH bonds
UV Waves breaks
Pi bonds
X-Rays Breaks
Sigma bonds
Wavelength is
Inversely proportional to energy
Frequency is
Proportional to energy
NMR
Uses radio waves to find what’s bound to what
IR
Uses infrared to find what functional groups present as every bond type absorbs a specific photon
UV-VIS
Uses visible + UV to find conjugated pi systems
Matter on a macro scale exhibits
Continuous behaviour
Matter on a molecular scale exhibits
Wave-like, quantum behaviour
% Transmittance
How much light get through
IR Absorption Specrum
% transmittance vs wavenumber
Absorption Bands
Peaks in a IR plot
Wavenumber ranges
400 - 4000 1/cm
Wavenumber is
Proportional to energy
Diagnostic Region
Above 1500 1/cm
Fingerprint Region
Below 1500 1/cm, hard to analyze
Characteristics in IR
Wavenumber
Intensity
Shape
Stronger bonds have
Higher stretching frequency, and wavenumber
More bonds, and similar orbitals have
More overlap and thus higher wavenumber
>3000 1/cm
Terminal Alkenyl & Alkynyl Bonds
4000 - 2700 1/cm
Bonds to H
2300 - 2100 1/cm
Triple Bonds
1800 - 1600 1/cm
Double Bonds
<1600
Single Bonds
Resonance & Delocalized pi electrons have
Weaker pi bonds and thus decrease wavenumber
Larger mass difference have
Lower stretching frequency (very light bonds = large wavenumber)
More polar moelcules have
Higher wavenumber because more interaction between stronger electric field from oscillating dipoles that photon from IR can bump into
Complete Symmetry Creates
No signal because no electrical fields from lack of EN
Narrow SIgnal
No intermolecular forces
Broad SIgnal
Intermolecular forces
OH Bonds show up
Very broad because H bonding weakens and vary in a molecule, leading to varying wavenumber
Free OH Bonds create
Shorter intensity
COOH
Weaker from more efficient H bonding and variety of a broad OH, and sharp carbonyl
Amines
Less broad peaks than alcohol because H bonding is less efficient
Tertiary Amine has
No peaks
Secondary Amines have
Single Peaks
Primary Amines have
Doublets
NH2 H bond vibrations
Symmetrically, higher energy
Asymmetrical, lower energy (2 peaks)
Mass Spectrometry
Determines molar mass and formula of a compound
Mass Spectrometry Process
Vaporize in a vacuum, ionized with electrons, fragment
Electrical field spreads ions by mass
Detectors reads them
Radical Cation
Molecular with an unpaired electron
Molecular Ion
Radical cations stays intact
Mass to Charge Ratio
M/z (usually +1)
Relative Abundance
Tallest peak is 100% and everything else is relative
The most right cluster in mass spectrometry is
The molecule with varying lines the isotopes of the molecule
Carbon Isotopes
12C and 13C
Chlorine Isotopes
35Cl and 37Cl (3:1)
Bromine Isotopes
79Br and 81Br (1:1 ratio)
If molecules has odd molar mass
Odd number of nitrogens
Degree of Unsaturation
A pi bond and ring counts as degree of unsaturated, and number of hydrogens decrease by 2
Hydrogen Deficiency Index (HDI)
1:1 ratio where 1HDI = 1 degree of saturation
Halogen HDI
Treated as 1 HDI
NItrogen HDI
Increase number of hydrogens by 1
Oxygen HDI
Doesn’t affect it
HDI Formula
½(2C + 2 + N - H - X)
Nuclear Magnetic Resonance (NMR)
Manipulate nucleus with electromagnetism
B spin sate
Opposes Bo, higher energy state
a spin state
Allign with Bo, lower energy state
Energy Gap
Difference between alpha and beta spin state (really small)
Stronger Magnetic Field
Greater energy gap
More electrons
Smaller energy gap because shielded electrons create a stronger opposing FB, causing smaller Bo
Less electrons
Bigger energy gap because deshielded electrons have weak opposing FB, more delta+
Resonance
Spinning in sequence
Common NMR Solution
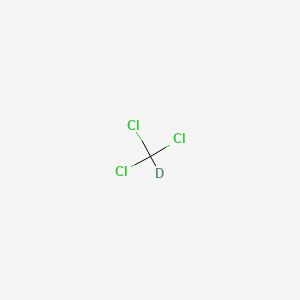
Deteurium chloroform

Characteristics of NMR
Number of signals
Signal location
Signal intensity (integration)
Signal shape
Higher Chemical Shift
Higher energy, delta positive, deshielded, larger gaps, closer to pi electrons
Lower Chemical Shift
Lower energy, delta negative, smaller gap
Counting Number of Signals
Determine the number of hydrogens that have unique atoms and number of hydrogens bound to it
Protons nearby EN atom
Creates a larger shift because it’s more positive and deshielded
Diamagnetic Anisotropy
Electron in a pi system creates a FB which goes through atoms orthogonal, increasing FB
Pi Systems
Higher shift (more energy needed to flip), and closer to the pi system causes more deshielding
Symmetrical Molecules
Don’t give absolute hydrogen count
Doublet
1 H atom on neighboring carbon from hydrogens spinning up or down, creating two different electrical fields
Singlet
No H atoms on neighbouring C
Triplet
2 H atoms on neighbouring C because coupling of H atoms has 3 outcomes with higher chance of spinning different directions
Quartet
3 H atoms on neighbouring C with coupling creating 4 outcomes and mix of spin up or down is more likely
Multiplicity Rules
Hydrogens bounded to the same carbon don’t couple because equivalent magnetic field
To couple, H must be 3 bond distance apart
Coupling doesn’t happen with O-H and N-H because H bonding is too quick to catch
1500–1680 cm-1
Double bonded carbon
1680–1800 cm-1
Ketones, Carbonyl, Amides
2900-3200 cm-1
sp3 C-H
3200-3600
Alcohol or Amine
1-1.5ppm HNMR
Alkyl
1.5-3.0ppm HNMR
Allylic
3.0-4.5ppm HNMR
Carbon bound to hetero atom
4.5-6.5ppm HNMR
Vinylic
6.5-8.5ppm HNMR
Aromatic
8.5-10ppm HNMR
Aldehyde or COOH
0-50ppm C NMR
Alkyl sp3
50-100ppm C NMR
sp3 bound to O or F, triple bond to carbon or nitrogen
100-160ppm C NMR
sp2 carbon, double bond
160-190ppm C NMR
Carbonyl and hetero atom
190-220ppm C NMR
Ketones and aldehydes
Integration Value substituted Aromatics
4
What kind of Signals is Expected for Ortho (1-2)
3 doublets and 1 triplet
What kind of Signals is Expected for Meta (1-3)
2 doublets, 1 triplet and 1 singlet
What kind of Signal is Expected for Para (1-4)
4 doublets
DEPT-90
Shows methine signals (CH)
DEPTh 135
Positive signals for CH3 and CH, negative signals for CH2