LESSON 6-9: DESCRIPTIVE AND INFERENTIAL STATISTICS (copy)
1/27
There's no tags or description
Looks like no tags are added yet.
Name | Mastery | Learn | Test | Matching | Spaced |
|---|
No study sessions yet.
28 Terms
DESCRIPTIVE STATISTICS
It describes, shows or summarizes data from your
sample in a meaningful way.
MEASURES OF CENTRAL TENDENCY
It indicates a single numerical value that summarizes the entire set of data which are a central to the complete set.
MEASURES OF VARIABILITY
It provides information about the spread or dispersion of scores in a data set.
MEAN
It refers on the average score in a data set. It is used for interval or ratio data - not skewed.
MEDIAN
Refers on the middle score in a data set. It is used for ordinal, interval, or ratio data - skewed.
MODE
Refers on the most frequent score in data set. It is used for nominal or ordinal data.
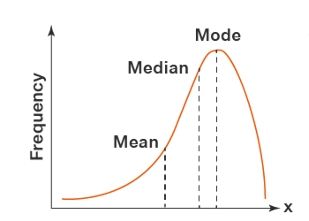
NEGATIVELY SKEWED

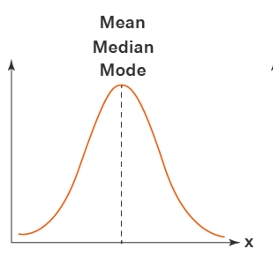
SYMMETRICAL DISTRIBUTION

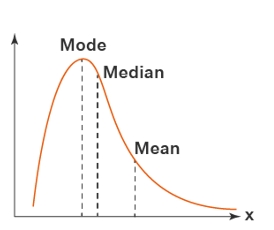
POSITIVELY SKEWED

RANGE
The difference between the maximum and the minimum scores in a data set.
STANDARD DEVIATION
The average distance of observations from the mean of the data set.
VARIANCE
The average squared differences of the observations from the mean of the data set.
INFERENTIAL STATISTICS
It makes inferences about the population using data from a sample.
ONE-SAMPLE T-TEST
Identify the statistical test: This statistical test is used to compare with a hypothesized value.

CHI-SQUARE GOODNESS OF FIT
Identify the statistical test: This statistical test is used to compare with a hypothesized value.

DEPENDENT T-TEST
Identify the statistical test: This statistical test is used to compare between groups.

INDEPENDENT T-TEST
Identify the statistical test: This statistical test is used to compare between groups.

ONE-WAY ANOVA
Identify the statistical test: This statistical test is used to compare between groups.

PEARSON’S PRODUCT-MOMENT CORRELATION
Identify the statistical test: This statistical test is used to measure relationships.

CHI-SQUARE TEST OF ASSOCIATION OR INDEPENDENCE
Identify the statistical test: This statistical test is used to measure relationships.

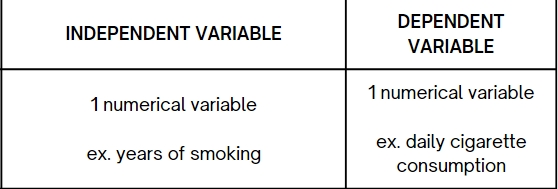
SIMPLE LINEAR REGRESSION
Identify the statistical test: This statistical test is used to predict variables.

MULTIPLE LINEAR REGRESSION
Identify the statistical test: This statistical test is used to predict variables.

PEARSON’S PRODUCT-MOMENT CORRELATION
Identify the statistical test to be used: A pre-service teacher wants to determine the relationship between organizational commitment and job satisfaction among in-service teachers in public high schools.
SIMPLE LINEAR REGRESSION
Identify the statistical test to be used: A student researcher wants to determine whether the number of minutes spent in studying for the examination can significantly predict one’s score in the examination.
DEPENDENT T-TEST
Identify the statistical test to be used: A researcher wants to investigate how metacognitive instruction can improve the question-posing ability of the students. He compared the pretest and posttest scores of the students to determine the effectiveness of metacognitive instruction.
DEPENDENT T-TEST
Identify the statistical test to be used: A Practical Research 2 teacher wants to compare the final defense scores of students from the current school year to the previous school year. He knows that the mean final defense scores of students from the previous school year is 42. He compared it with the mean final defense scores of randomly selected students from the current school year.
INDEPENDENT T-TEST
Identify the statistical test to be used: A PE teacher wants to compare the cheer dance scores of STEM and ABM students.
ONE-WAY ANOVA
Identify the statistical test to be used: A PE teacher wants to compare the cheer dance scores of STEM, ABM, and HUMSS students.