AP Statistics - Full
1/35
Earn XP
Description and Tags
Name | Mastery | Learn | Test | Matching | Spaced | Call with Kai | Chat |
|---|
No analytics yet
Send a link to your students to track their progress
36 Terms
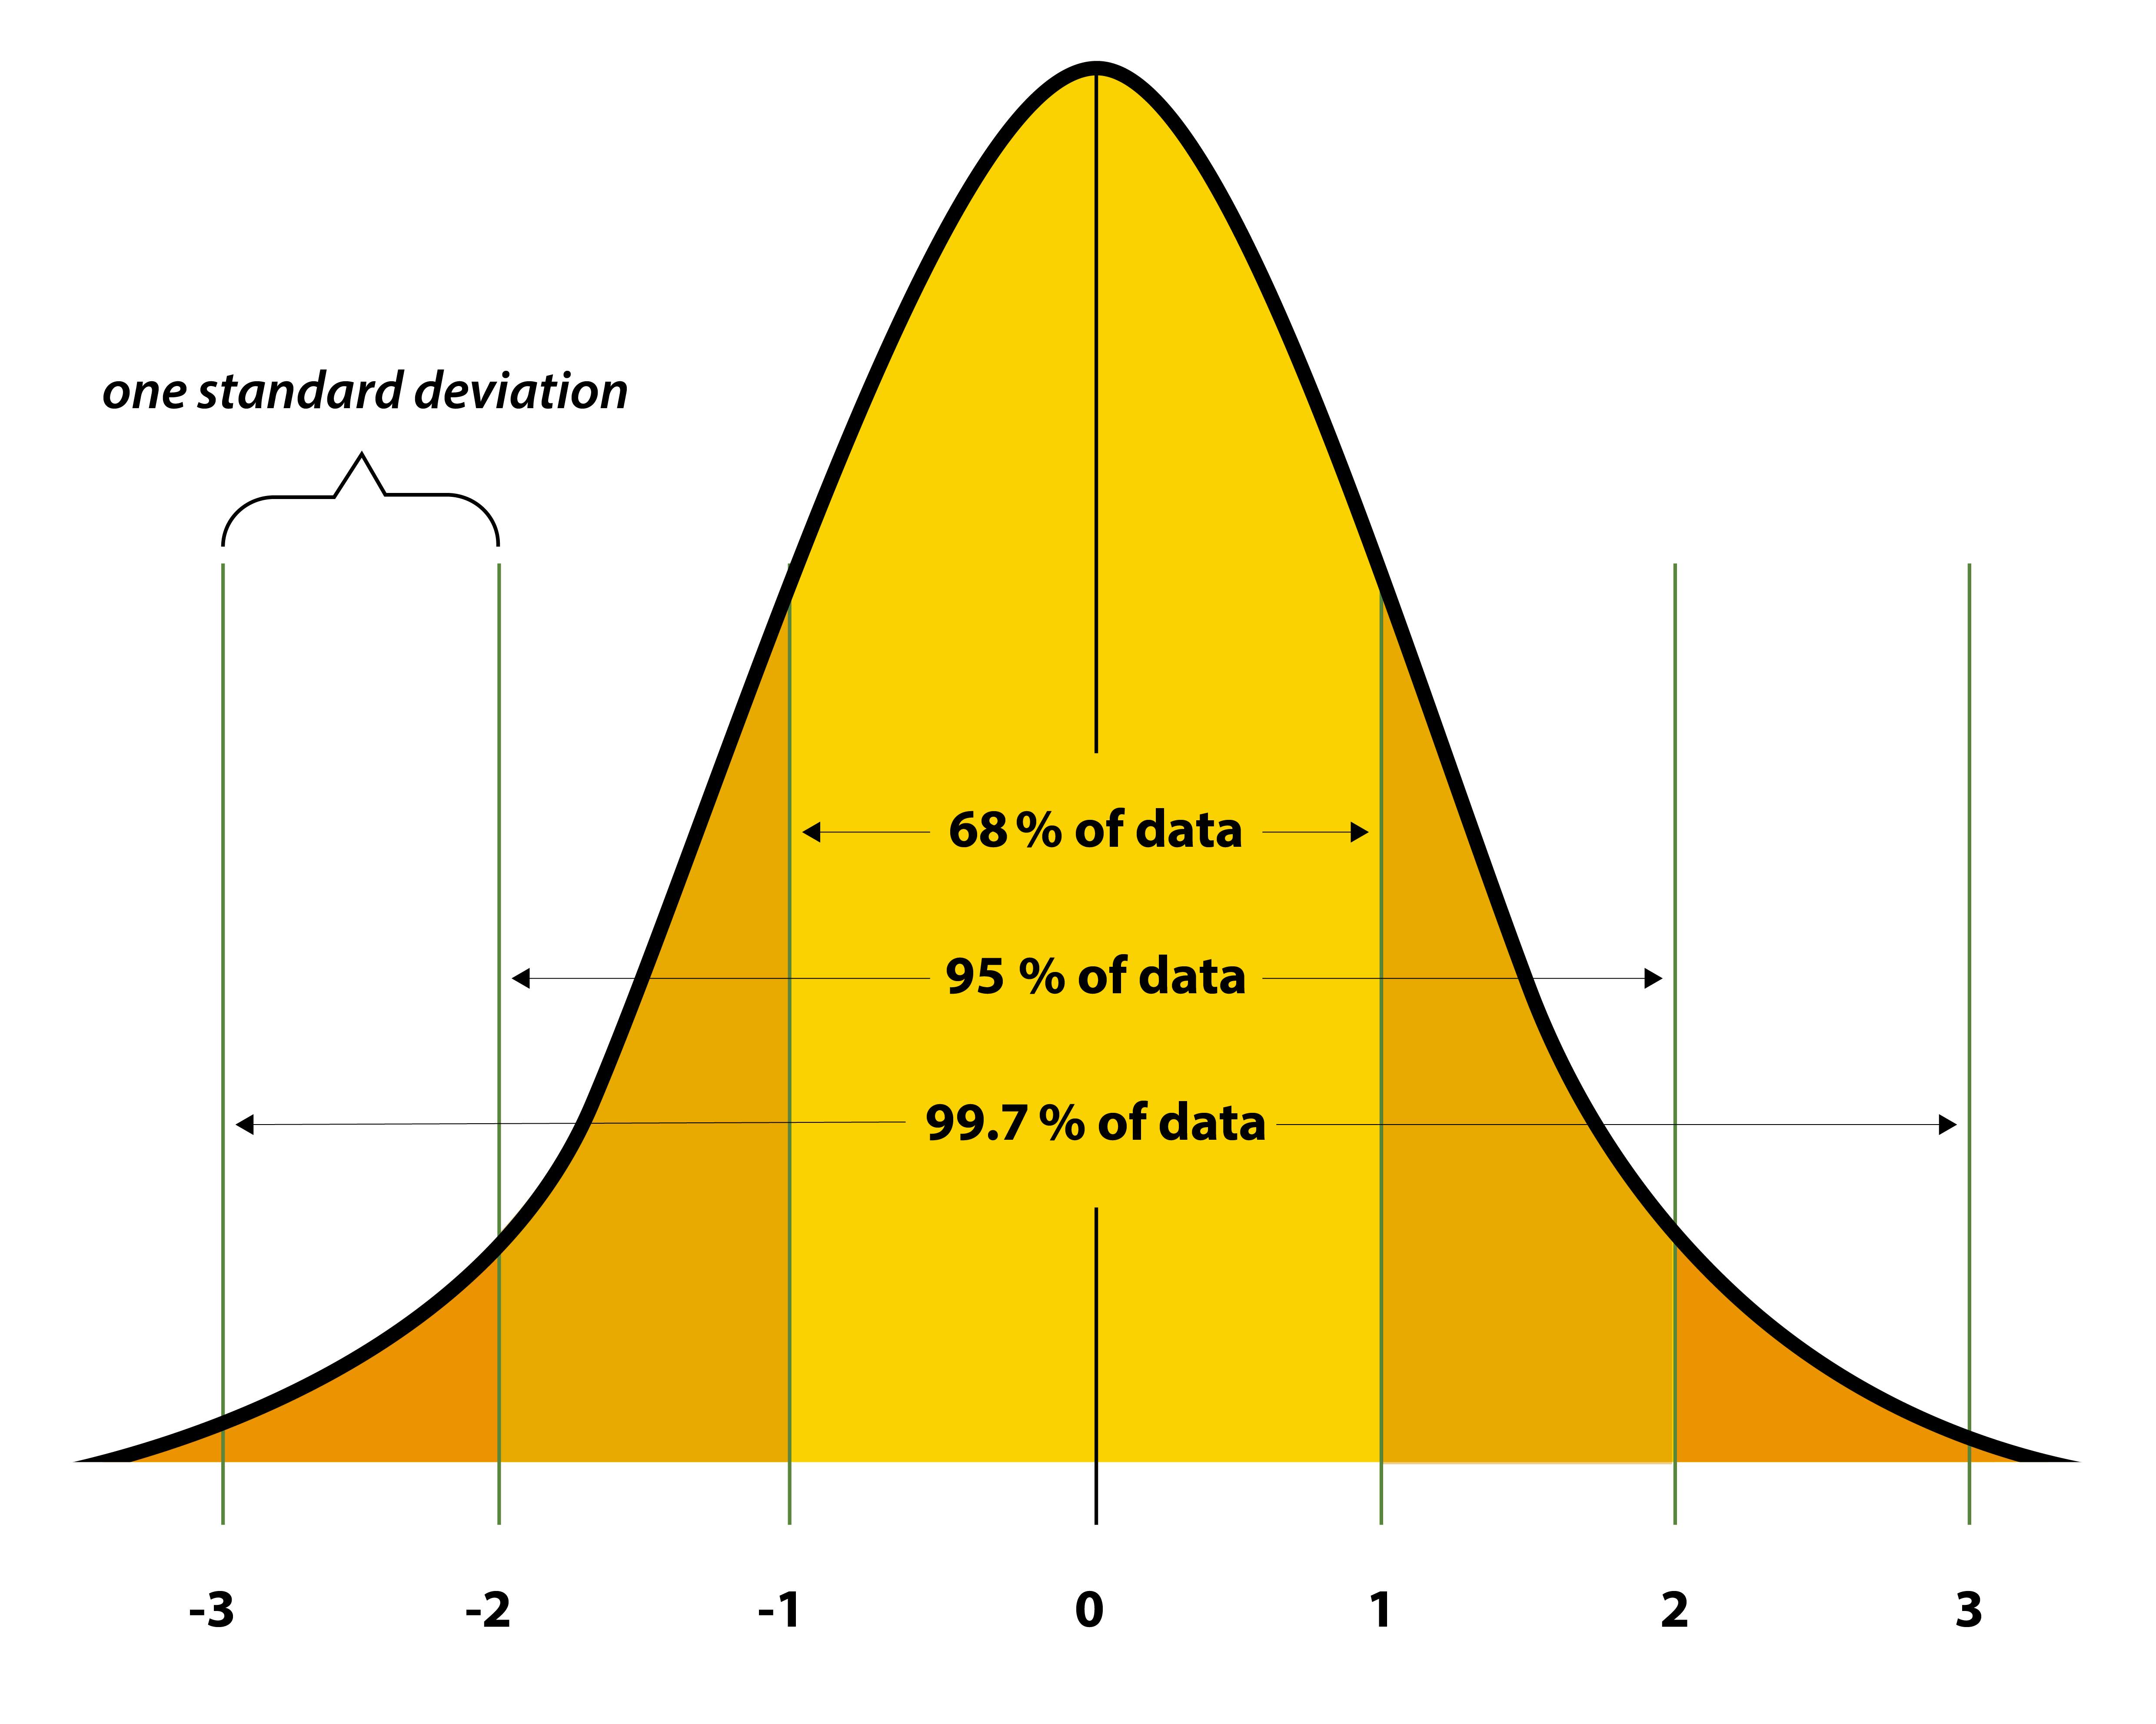
Normal Distribution
Data near the mean are more common than data far from the mean
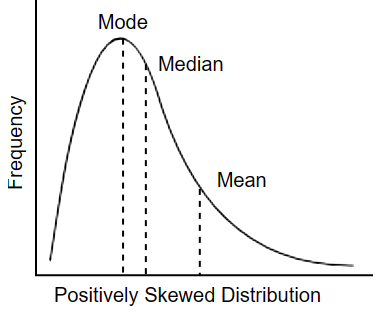
Positive Skew distribution
Tail is longer on the right
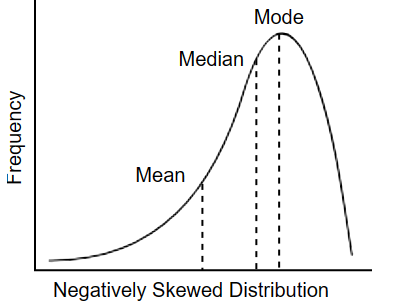
Negative Skew Distribution
Tail is longer on the left
SOCS
Shape, Outlier/unusual, Center, Spread
z-score
Flashcard: "Z-score formula calculates how many standard deviations a data point is from the mean in a normal distribution. Formula: z = (X - μ) / σ."
Can also be found using invNorm on calculator
Interquartile Range
Q3 - Q1
Outlier
Data point if it is less than [Q1 - 1.5IQR] or more than [Q3 + 1.5IQR]
Standard Deviation
Average distance between an individual data value and the mean
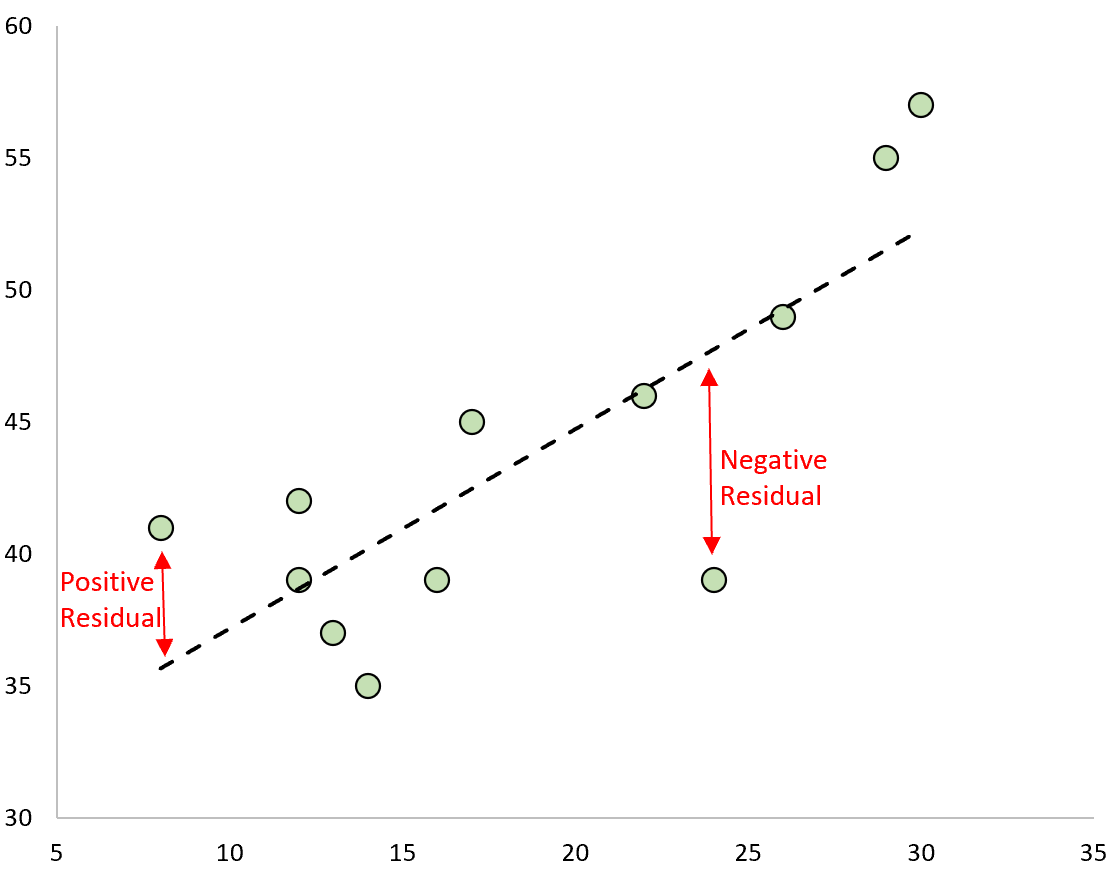
Least-Squares Regression Line
Associations that are approximately linear on a scatter plot
Formula: ŷ = a + bx
Residuals
The difference between the actual value on the scatter plot and the value on the line of the scatter plot
Formula: e= y - ŷ
Line of Best Fit
Residuals on the LSRL being in a random pattern
Lurking Variable
One variable causing two another variables to change together
Confound Variable
The effect of multiple explanatory variables on a response variables cannot be changed
Simple Random Sample (SRS)
Each set of individuals having an equal chance of being randomly selected
Stratified Random Sample
Population divided into groups or strata and use SRS to select individuals from groups
Cluster Sample
Population is divided into non-homogenous groups (ex: geographic location) and use SRS to select individuals in groups
Systematic Sample
Selecting individuals in a certain interval order (ex: every 5th person)
Convenience Sample
Biased sample that selects individuals in a ‘convenient’ manner.
Voluntary Response Bias
Asking for volunteers instead of selecting participants
Non-response Bias
Researchers choose the participants, but refuse to participants
Response Bias
Anything in the survey design that might induce a SPECIFIC answer
Undercoverage Bias
Some portion in population not being included in right proportion
Single-Blind
One party (researchers or participants) are blinded
Double-Blinded
Both parties are blinded
Placebo
Fake treatment
Conditional Probability
The likelihood of an event happening given that another event has already occurred. It is calculated by dividing the probability of both events occurring by the probability of the given event.
P(A|B)
Compound Events (AND)
Compound Events (AND): Events that occur simultaneously or in conjunction. The outcome is dependent on the occurrence of both events. Independent
P(A ∩ B)=P(A)⋅P(B)
Compound Events (OR)
In probability, this refers to events that can occur separately or together, resulting in at least one of the events happening.
P(A U B) = P(A) +P(B) - P (A ∩ B)
Independent Events
One event does not affect the probability of another event
If P(A and B)=P(A)⋅P(B)
If P(A|B) = P(A)
Mutually-Exclusive Events
Both events cannot occur at the same time
If P(A ∩ B) = 0
Uses the (OR) formula
Binomial Probability
A probability distribution that describes the number of successes in a fixed number of independent trials with the same probability of success.
binomPdf(n,p,x)
n = number of trials
p = probability of success
x = number of successes

Geometric Distribution
A probability distribution that models the number of trials needed to achieve the first success in a series of Bernoulli (trials with two possible outcomes) trials.
z-test
Only used if standard deviation is known

one-sample t-test
Only used if experiment has only one independent variable and one group/condition

t-test for independent means
Only used if there is one independent variable and two groups/conditions
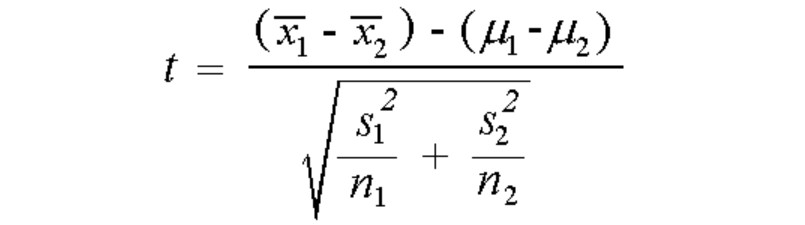
Pooled variance