Lab 4: Enzymes, Seawater plating & Vibrio Colony Streak
1/6
There's no tags or description
Looks like no tags are added yet.
Name | Mastery | Learn | Test | Matching | Spaced |
|---|
No study sessions yet.
7 Terms
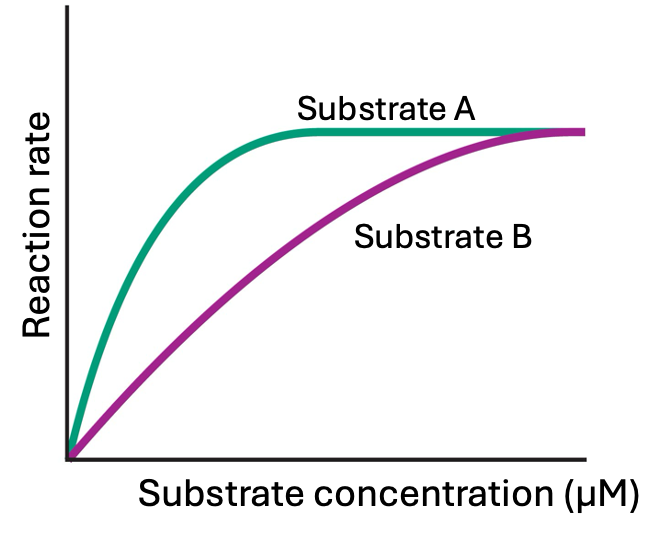
Below is an image shown from the lab lecture:
Which of the following substrates has the highest EC50?
Substrate A
Substrate B
Unable to determine from this graph
Neither; both have the same EC50
Unable to determine from this graph
**REACTION RATE cannot determine EC50. It can determine Km.
What is the purpose of graphing the reciprocal of reaction velocity and substrate concentration (i.e. the Lineweaver-Burk plot?
It makes all the negative values become positive
You can calculate the amount of product formed for any given enzyme concentration
You can determine the activation energy for the reaction
Vmax can be calculated from the y-intercept
Vmax can be calculated from the y-intercept
Based on the Lineweaver-Burk plot below, what type of inhibitor was used?
Mixed inhibitor
Non-competitive inhibitor
Competitive inhibitor
Unable to determine
Competitive inhibitor
This is a standard absorption curve for ONP. You conduct the enzyme assay described in Lab 4 to produce ONP, and you measure an absorbance of 0.625 at 420 nm. Given the equation of the regression line in the standard curve, calculate the amount (μmoles) of ONP product generated in the assay tube for this absorbance value (420 nm wavelength). Note that you are calculating μmoles of ONP produced in a 4 mL assay volume, not simply the μM concentration. Write the number in the space provided (as a number only). Round to the nearest hundredths--your answer should have three digits after the decimal.
0.798
You collect absorbance data for the β-galactosidase assay in Lab 4. You enter your data into the Enzyme Data Analysis Excel file and calculate the μmoles of ONP present at each time point for the reaction that started with 3.2 mM of ONPG. The μmoles ONP data for time points 0.5 - 2 minutes is shown in the table below. You decide to use time points 0.5 min and 1.5 min to calculate the initial velocity.
What is the initial reaction velocity in μmoles of ONP/min? Write the numerical value in the space provided (include all the numbers after the decimal point).
0.182
For the following Michaelis-Menten graph, what is the Km (in mM)? Write your answer in the box below (as a number only). You only need to include one number after the decimal.
0.5
The plot shown below is a ______.
If Line A represents enzyme activity without an inhibitor present, Line B was represents enzyme activity with a _______ inhibitor present.
Lineweaver-Burk plot
competitive inhibitor