Term 4 Cumulative (Kent, 2025)
1/31
There's no tags or description
Looks like no tags are added yet.
Name | Mastery | Learn | Test | Matching | Spaced |
|---|
No study sessions yet.
32 Terms
Mean
Sum of all values divided by the number of values.
Median
The middle number in a set when the numbers are ordered. If there are two middle numbers, the median is the average of these two numbers. To find the median, list the values in order and identify the middle value or average the two middle values.
Mode
The most frequent number in a data set.
Standard Deviation
A measure of the amount of variation or dispersion in a set of values.
Symmetric Distribution
A distribution where the mean is approximately equal to the median.
Skewed Left
A distribution with a tail on the left side, where the mean is less than the median. In this type of distribution, most data points are concentrated on the RIGHT.
Skewed Right
A distribution with a tail on the right side, where the mean is greater than the median. In this type of distribution, most data points are concentrated on the LEFT.
Uniform Distribution
A distribution where all values are equally likely.
Effect of Outliers on Mean
The mean is affected by extreme values.
Effect of Outliers on Median
The median is resistant to extreme values.
Histogram
A graphical depiction of the frequency distribution of numerical data.
Scatterplot
A graph that shows the relationship between two variables.
Line of Best Fit
A straight line that best represents the data on a scatterplot. A statistical line that minimizes the distance between itself and all data points on a scatterplot, indicating the trend in the data.
Form (y = mx +b)
Equation of Line of Best Fit
y = mx + b, where m is the slope and b is the y-intercept.
Equation for slope is given by m = (y2 - y1) / (x2 - x1), which represents the change in y for a unit change in x.
Strength of Correlation
Describes how closely the data points cluster around the line of best fit (weak, moderate, strong).
Sample Space
The set of all possible outcomes of a probability experiment.
Probability Calculation
The ratio of favorable outcomes to total outcomes.
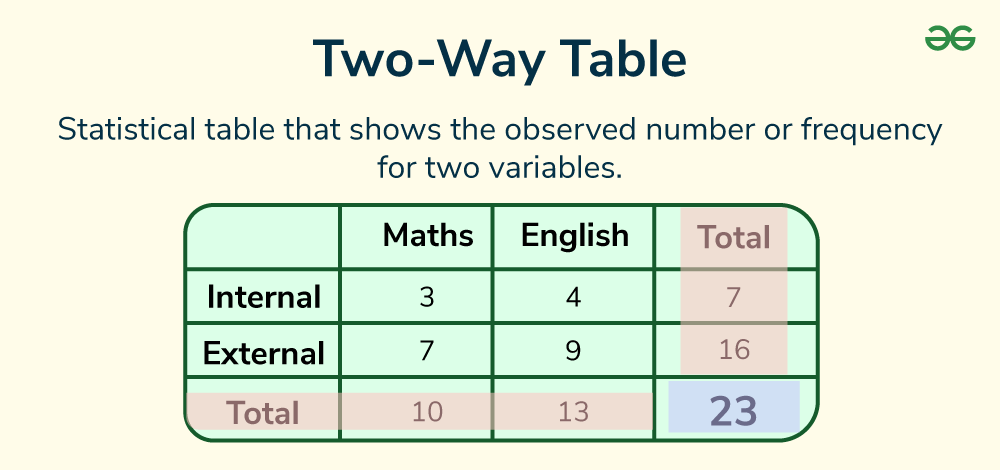
Two-Way Table
A table that displays data about two categorical variables.
Union of Events
The occurrence of at least one of the events A or B.
Intersection of Events
The occurrence of both events A and B.
Independent Events
Events where the occurrence of one does not affect the other.
Dependent Events
Events where the occurrence of one affects the occurrence of the other.
Disjoint Events
Events that cannot occur at the same time.
Function Notation
A way to express a function using symbols, typically f(x) for an input x.
Polynomial Degree
The highest power of the variable in a polynomial.
Leading Coefficient
The coefficient of the term with the highest degree in a polynomial.
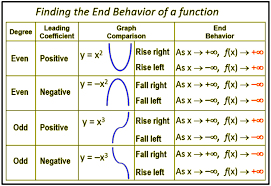
End Behavior of Polynomials
The behavior of the graph of a polynomial function as x approaches positive or negative infinity.
Y-Intercept
The y-coordinate where the graph intersects the y-axis, found by setting x = 0.
X-Intercepts
The values of x where the polynomial equals zero.
These points are where the graph intersects the x-axis, found by solving the equation for when y = 0.
Factoring Polynomials
The process of breaking down a polynomial into simpler factors.
Look for the Greatest Common Factor
What multiplies to a * c?
What adds to b?
Box method
Invisible Zeros
Zeros that do not appear as x-intercepts on a graph, often relating to imaginary numbers.
Multiplicity of Zeros
Refers to how many times a particular zero occurs in a polynomial.