Ap Psych: In Order Observation Studies, Types of Research,Experiments, Correlation, Statisitcs
1/49
There's no tags or description
Looks like no tags are added yet.
Name | Mastery | Learn | Test | Matching | Spaced |
|---|
No study sessions yet.
50 Terms
Theory:
an experiment using a intergraded set of principles that organizes observations and predicts behaviors and events ex: low self esteem feeds depression
Hypothesis
A testable prediction, often implied by a theory
Research and observations
Gathering info and recording results
Operation Definition
an experiment using a intergraded set of principles that organizes observations and predicts behaviors and events. Use number in answers. Ex; for adhd you would see how many times someone got distracted in a day
Replication
Repeating a research study with different participants and situations to see whether the basic finding can be generalized to other people
Types of Research:Descriptive Methods
Case Study and Naturalist Observation
Types of Research: Case Study
ONE PERSON is studied in depth for a long period of time in the hope of revealing universal principles ex: can a chimpanzee learn a language
Types of ResearchNaturalistic observation
Observing and recoding behavior in their natural habitat( where they usually live) without interfering/ butting in ex: what percent of their time do college students spend online?
Surveys
NOT A RESEARCH MTHOD. Questionnaires or interviews to collect data
Sample
The small group of participants out of the total number available that a research studies
Population
The total group being studied from which the sample is drawn ex: a study has some people take a pill for depression some have a placebo.. The population is the people that have depression in general
Random sampling
Everyone in the population has an equal chance of participating
Sampling Bias
A flawed sampling process that produces an unrepresentative sample
Experiments
Method of collecting data in which the research experts contact over the subjects or units in the study. Experiments applies something to someone and then measures it
Observational study ( difference with experiments)
Observes the variable not influence
Why we use experiments
To establish the cause and effect between two variables or to compare two groups on their researcg to treatments
Explanatory variable is a factor
Ex: treatment which aspirin
Explanatory varialvbe is the number answer
Ex: number of heart attacks
Examples of testing
Determine the ost effective dose of aspirin. People take the different doses( 200, 400) referred to as levels of the factor
Placebo
Thinking the treatment is working( fake medicine)
Double blind
Tester and participants don’t know the purpose of what they are doing
Blind
Subject doesn’t know the purpose
Replication
People can replicate it
Generalizability
Offer a goal of an experiment or a sample survey
Lurking variable
Variables that are hidden until the experiment happens ex: fertilizer helps plants grow( variable) but so does rain
Confounded
Can’t tell which variable is causing a effect
Two main variable so Control Group and Treatment Group
Control group receives nothing or a placebo and Treatment group receives the treatment
Hawthorne effect
People who change their behavior because they know they’re being observed
Control
Account for lurking variables so that lurking variables are in both groups
Randomization
People are randomized so it’s fair
Quasi- experiment
You follow all the rules except your sample isn’t randomized ONLY good for yo if you want to experiment on certain people or preliminary studies
Independent variable
Treatment, experimenter manipulates( changes) something related to as the treatment
Dependent variable
Result, measurable what was the outcome of the experiment. We don’t conduct the independent variable
Null hypothesis
Hypothesis that says there is no change or difference
Alter hypothesis
There is a difference or change
Significance testing
Calculation with the question “ how likely is it that my results have occurred because of change along?”
P-value
Probability that it is due to chance. Must be under .0.5 or 5% for it to be a good testing
Correlation Research/ Study
Measures relationships between 2 variables( a lot of date). THIS ISN”T ABOUT CAUSE ex: are act scores related to gpa. Is self esteem and depression related?
Correlation coefficient
Number that represents the relationship between two variables or sets of data. Note: a negative .9 has a stronger relationship than a positive .8
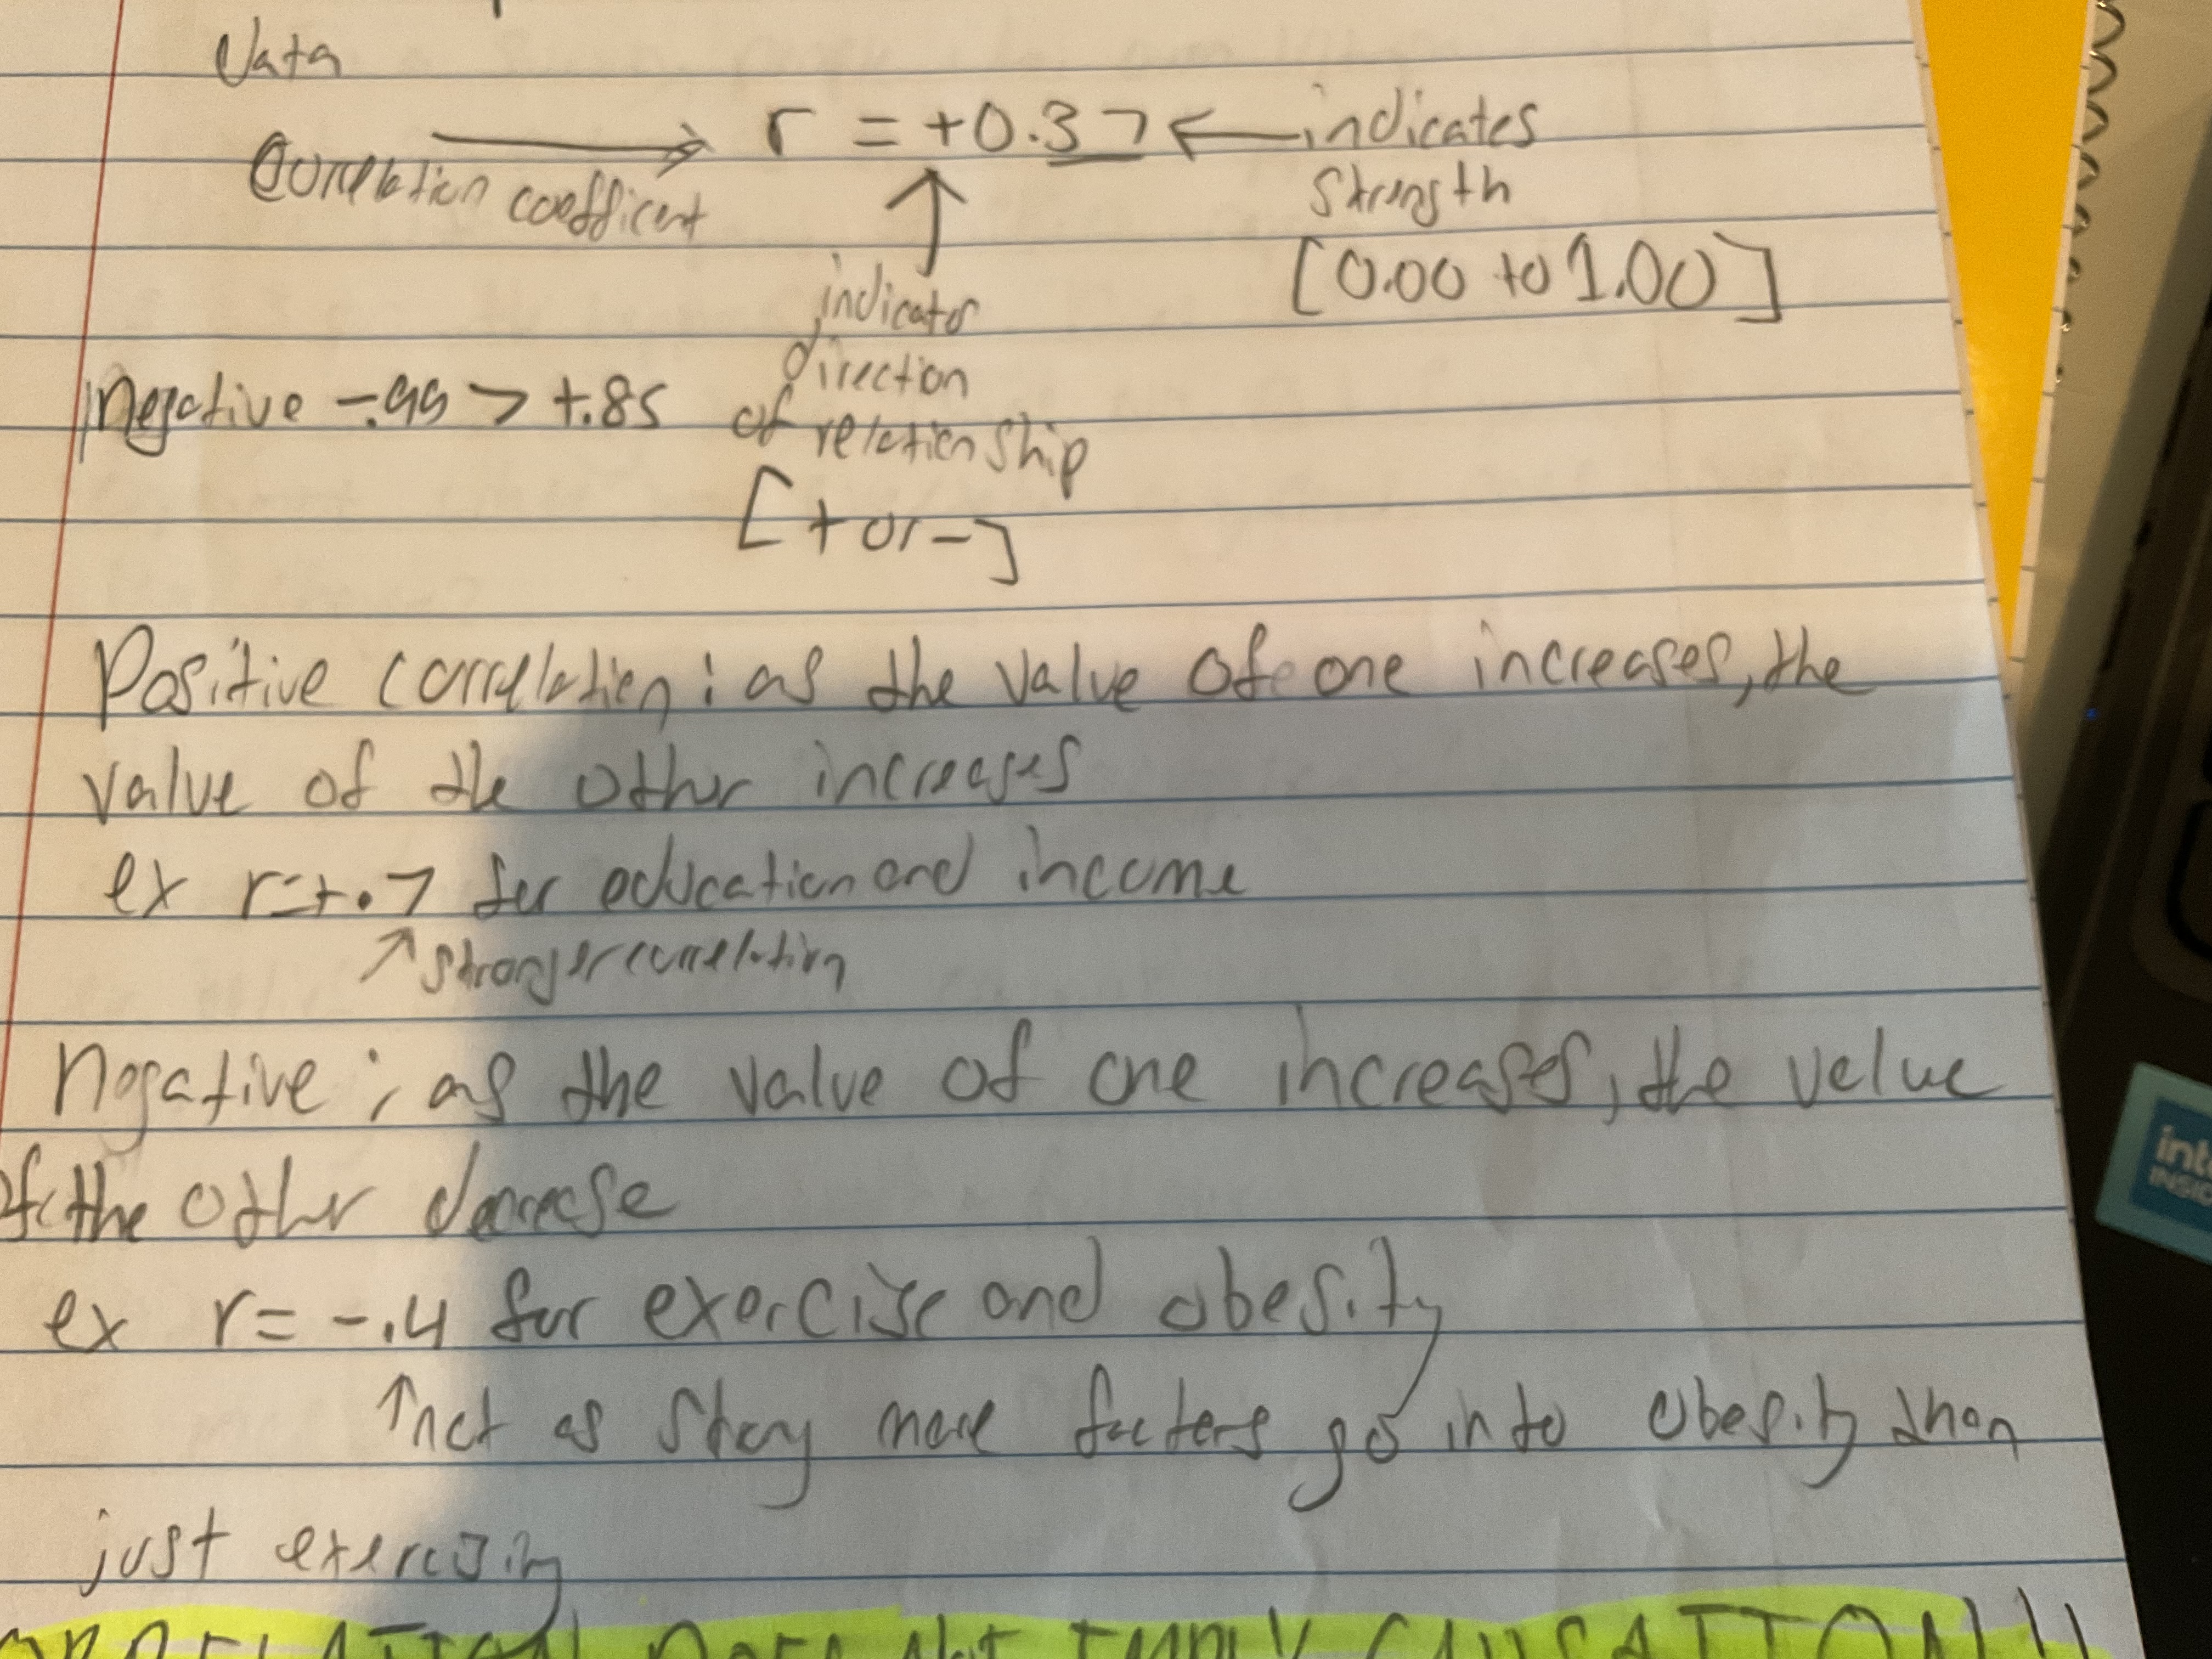
Only and experiment can support a hypothesis of causation. Why?
When one variable changes when adjusting another variable. Ex: people seem to be more happy when they have more shoes/ Does this mean people are more happy because they have new shoes? No. But if you run an experiment where you take away or give shoes does the happiness change?
Illusionary Correlation
The perception of a relationship where non exist. Belief that if you flip a coin multiple times the result with be random. It would be all tails, you never know.
Result variable
Is measure after the treatment
Descriptive Statistics
List and summarize data in a practical efficient way. Ex: describe characteristic of a sample
Inferential Statistics
Tell how frequently an obtained result occurred by experimental manipulation or by chance. Use details to make generalizations( Inferences) about the population
Description Statistics more info: Central Tendancy
A number that describes something about the average score of a distribution ex: mode( most frequent), median( middle), and mean( average score)
Description Statistics more info Normal Curve
A symmetrical, bell shaped curve that describes the distribution of many types of data most shared scores fall near the mean
Description Statistics more info Measures of Variance
Variability- measure of difference or spread of data. Range- how far apart the highest and lowest scores are. Standard deviation- a measure of variability that describes how much scores vary around the mean
Inferntenial Statisitics info: When is an observed difference reliable?
Response samples are better than biased, 2 less-variable observation are more reliable than more variable, 3 more cases are better than fewer
Inferntenial Statisitics info: Statistically Significant
The probability that a result is due to chance is smaller than .5( less than 5%. The p-value. Ask the question [ did the intervention work? Yes or no] Did it work?
Inferntenial Statisitics info: Effect size
A quantitative measurement al of the of an effect in psychological research? In simpler terms: how much of a difference was made?[ tell us how much it works] how much did is help?