EAS 205 - Climate Change
 Call Kai
 Learn
Learn Practice Test
 Spaced Repetition
 Match
Match Flashcards
 Knowt Play
1/104

There's no tags or description
Looks like no tags are added yet.
Name | Mastery | Learn | Test | Matching | Spaced | Call with Kai | Chat |
|---|
No analytics yet
Send a link to your students to track their progress
105 Terms
Rachel Carson
Warned that widespread pesticide use (particularly DDT) was poisoning wildlife, contaminating ecosystems, and threatening human health.
Her work challenged industries, allowed for debate, and help launch modern environmental movements.
When “Silent Spring” was published, many critics attempted to discredit her research. However, decades of scientific investigation confirmed many of her concerns.
Her book led to stronger awareness, stronger environmental regulations, and eventually the banning of DDT in several countries.
Climate Change
Climate change refers to long-term shifts in earth’s temperature and weather patterns.
The warming of the earth is largely due to human activity (transportation, electricity, industry). We release greenhouse gases (such as CO2 and CH4) into the atmosphere.
These gases trap heat (like a blanket around earth).
This is called the greenhouse effect. This effect is natural and necessary for life.
Climate Change Effects
Human activities have intensified it, causing global temperatures rise faster than any natural systems can adapt.
It affects every country, every ecosystem, and every person on earth.
Stronger temperatures, stronger storms, melting glaciers, prolonged droughts, wildfires, and rising sea levels are no longer predictions for a distant future.
They are realities we are facing today.
All of these are intensifying as time goes on.
Animals are dying out, coral reefs are experiencing widespread bleaching (due to warming oceans), and ecosystems are becoming increasingly unstable.
Climate Change Alternatives
Renewable energy sources like solar, wind, hydroelectric, and nuclear power reduce greenhouse gas emissions. Electric vehicles and improved public transportation helps lower pollution.
Protecting forests preserves natural carbon storage while safeguarding biodiversity.
Advances in energy efficiency reduces waste and sustainable agriculture can improve food security while lowering environmental impacts.
Everyone has a role to play.
WHAT IS CLIMATE?
Climate is the average of the weather for a region over time (2 years)
Paleoclimatology
Is the study of ancient/past climates
Paleo meaning “old” or “ancient” and –ology means “study”
Climate before instruments and historical records
Assume that past climatic processes generally operated the same way as in the present
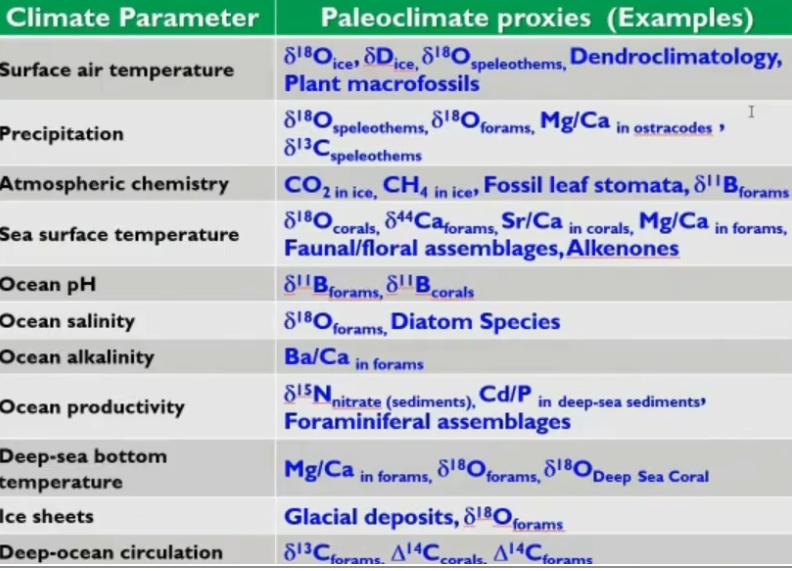
Uses paleoclimate “proxies” within paleoclimate “archives” to reconstruct climatic/environmental “parameters”
Paleoclimatology Examples
Paleoclimate archive examples: corals, speleothems (stalactites and stalagmites), foraminifera, tree rings, pollen, ice cores, sediment cores, etc
Paleoclimate parameters examples: temperature, pH, salinity, etc
Paleoclimate proxy examples: stable isotopes (e.g., δ¹⁸O, δ¹³C, and δD), elemental data, biomarkers
Proxies are usually split up into biological, physical, and chemical proxies
Use this information to refine the climate models that we use to study current climate change including the effects of anthropogenic (human caused) warming.
ISOTOPES OF OXYGEN
The most abundant element in the Earth’s crust
Abundant in several key components of the climate system
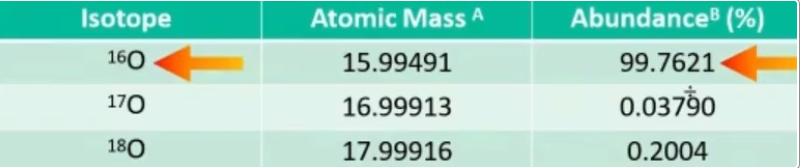
Isotopes are atoms whose nuclei contain the same number of protons but a different number of neutrons
An isotope of a given element differs from another isotope of the same element by the number of neutrons in its nucleus
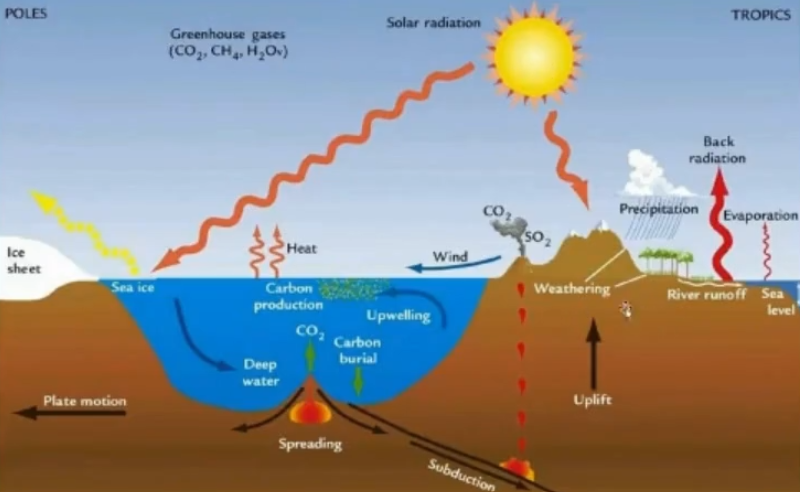
OXYGEN IN THE CLIMATE SYSTEM
The major components: air, water, ice, land, and vegetation.
There’s technically a sixth one: humans.
THREE ISOTOPES OF OXYGEN
Oxygen occurs in gaseous (O₂ and water vapor), liquids, and solid compounds over large temperature ranges
ISOTOPES are atoms whose nuclei contain the same number of protons but a different number of neutrons
All the same element. Only the neutrons differ.
DELTA (δ) NOTATION
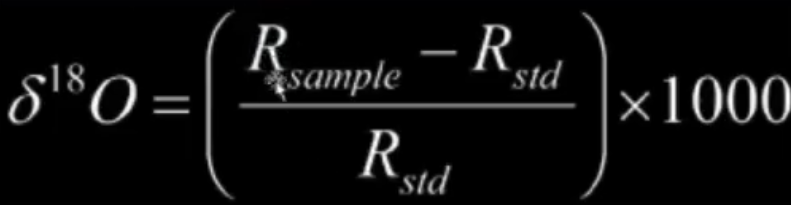
where R = ¹⁸O/¹⁶O
Delta (δ) values are reported in per mil (‰)
δ – Change in amount of isotope of interest relative to a standard (std).
Per mil refers to per thousand so 1 per mil (‰) is equal to 0.1 % (this is why we multiply by 1000)
Each isotope has its own standard (std) - oxygen uses V-SMOW
ICE CORES
Most famous archive for paleoclimate studies
Annual snow accumulation compressed into ice
Trap air bubbles, dust, volcanic ash, and other materials
Provide records of past atmospheric composition and climate
Mass fractionation line (also called terrestrial line)
a reference line used in geochemistry to map how the stable isotopes of an element separate during natural processes, like evaporation or condensation, based strictly on mass.
All lunar rocks that we’ve collected track on the mass fractionation line.
Martian rocks track differently. Vesta (an asteroid) also tracks differently from that.
Ice Core Graph
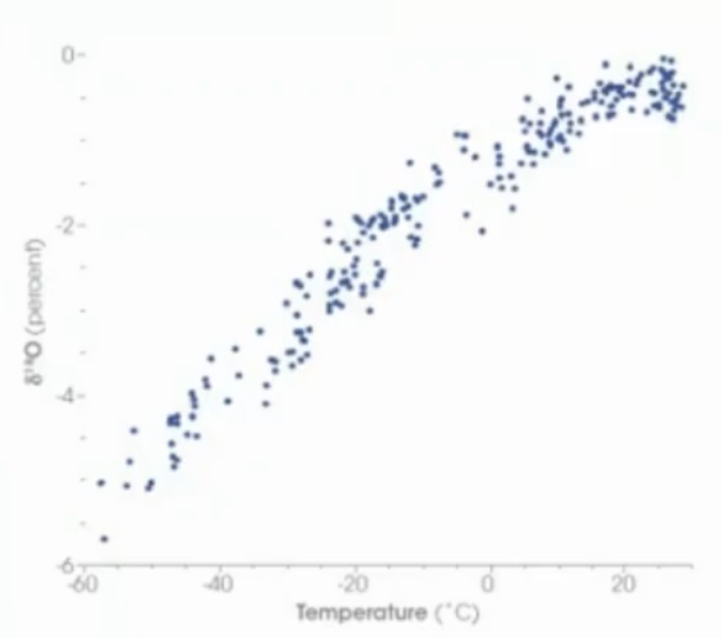
The concentration of 18O in precipitation decreases with temperature.
This graph shows the difference in 18O concentration in annual precipitation compared to the average annual temperature at each site.
Ice from the ice cores is formed from precipitation.
VSMOW is typically zero.
Ice Cores & Elevation
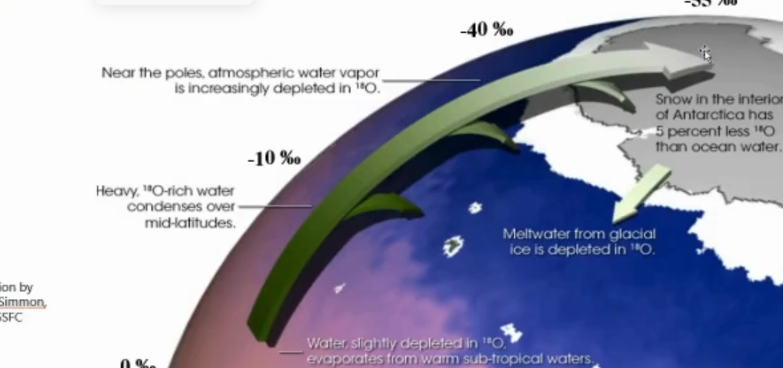
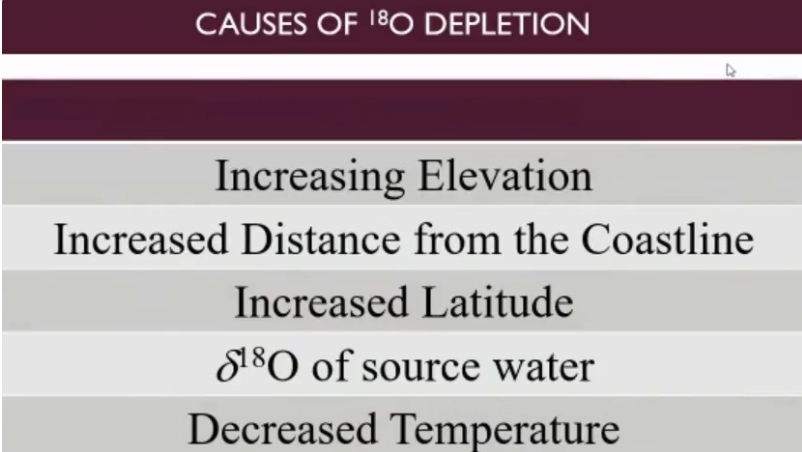
That’s why when you measure anything from the equator (not the mountains because there’s an elevation effect) it should be zero. This is because you’re comparing isotopic composition of equatorial water, which should be more or less equal to the mean ocean water.
However, if you go up in latitude or further from coastline, you’re going to get the water with the heavier 18O because they have more neutrons + more likely to precipitate out.
They will precipitate out more closely to the coastline to the base of the mountains, to the lower latitudes. As that cloud moves along, it becomes more depleted in 18O relative to 16O.
Hence why it decreases as you go up to the polar regions.
Latitudinal effect → 18O rich water condenses out. A more stable state of matter rather be water than gas.
Ice Core Data
Ice core data includes oxygen, deuterium, carbon, and often other stable isotopes.
It also includes dust, atmospheric gas concentrations (such as carbon dioxide and methane).
Thin layers of volcanic ash help constrain the age of the ice.
Decay of 238U to 234U from dust in the ice matrix.
Determine Past Air Temperatures
Directly related to concentrations of carbon dioxide, methane, and other greenhouse gases preserved in the ice.
Past precipitation can be used to reconstruct past palaecoclimatic temperatures.
δD and δ18O is related to surface temperature at middle and high latitudes.
Snow falls over Antarctica and is slowly converted to ice. Stable isotopes of oxygen ([oxygen 16O, 18O] and hydrogen [D/H]) are trapped in the ice in ice cores.
Disadvantages of Archives
Time limited.
Must be in locations where ice is deposited.
Snowfall may not be continuous, and therefore may be biased by snowfall occurring during a particular season or during a particular storm.
The amount and chemical composition of the snowfall can vary considerable over short distances due to the local micrometerological effects.
Danger in collecting samples.
POLLEN
Electron microscope image of pollen grains from various common plants.
Examples here include Scanning Electron Microscopic image of pollen grains from sunflower, morning glory, prairie hollyhock, oriental lily, evening primrose, and castor bea
POLLEN RECORD- BIOLOGICAL ARCHIVE
Pollen grains are the reproductive bodies of seed plants like conifers, cycads, and flowering plants.
Each grain has a species, specific shape are made of a substance known as sporopollenin, which is very chemically stable and strong.
When pollen grains are washed or blown into bodies of water, they can be preserved in sediment layers in the bottoms of ponds, lakes, or oceans.
Pollen in collected sample cores can help determine what kinds of plants were growing at the time the sediment was deposited.
Pollen processing
Researchers can isolate the pollen and spores from the sediments and rocks using both chemical and physical means.
Spruce (Colder Climate)
Oak (Warmer Climate)
Prairie Pollen (Drier Climate)
Disadvantages of Pollen
Only useful in areas with ample vegetation.
Pollen needs to be collected and preserved (e.g., within lake sediments).
Direction of wind.
Trends in pollen abundance may not be clear.
Misidentification, subjective pollen zonation, etc.
Take caution for sampling bias.
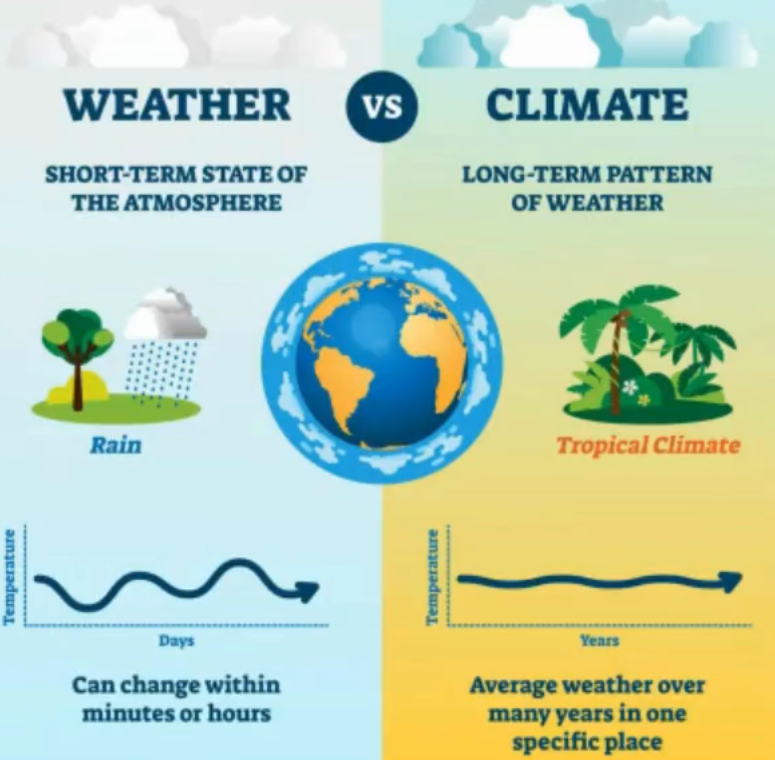
Weather
Atmospheric conditions over a short period of time.
El Nino
Regional variations can result from interactions between atmospheric circulation and the oceans and land, and also follow geographic patterns.
These timings can be rather irregular and sometimes hard to predict.
For example, El Nino which is the warming of the Pacific Ocean.
Typically happens between 3 to 7 years and it lasts for about one year.
El Nino can be detrimental to marine populations like fish, which depends on the upwelling of cold water (brings nutrients, plankton, and kickstarts the cycle).
The cooling version of El Nino is called La Nina.
La Nina
El Nino and La Nina are part of a naturally occurring variation in the exchange of heat between the atmosphere and the tropical pacific ocean. That variation is known as the El Nino Southern Oscillation.
Normally, the atmospheric pressure gradients cause winds (called trade winds) to blow east to west. This pushes warmer tropical water towards the west.
This movement of the water causes colder water to well up from the deep ocean off the coast of Peru.
Sometimes it increases, making the temperature differences between the eastern and western greater. This produces the La Nina event.
Stratigraphy
The study of rock layers and layering.
GSSPs
Golden spikes.
Define the exact boundary between geological time periods, epochs, or stages.
They act as the "golden spike" standard or yardstick against which all other rocks of the same age around the world are measured.
Earth's Climate
Atmosphere
Hydrosphere
Cryosphere
Biosphere
Lithosphere
Climate Through Time
Earth's climate has changed throughout geologic history.
Alternating greenhouse and icehouse conditions have occurred.
Modern climate change is occurring within this long-term context.
Greenhouse (Hot house) Earth
No continental glaciers on the planet.
Sea surface temperatures are somewhere around 0 and 28 degrees Celsius.
High atmospheric CO₂
Warm global temperatures
Icehouse Earth
Continental ice sheets present at both poles simultaneously.
We are currently in a Icehouse earth period.
Cooler global temperatures
Within a icehouse period (in general), we usually oscillate between a glacial–interglacial cycles.
That will continue until the quaternary ends and the earth will once again enter a future greenhouse period.
Quaternary Ice Age
Began approximately 2.5 million years ago
We are currently living in an interglacial period within the Quaternary Ice Age.
Erratic boulders
Moved by glaciers.
There is literally no other way to move them.
Evidence for Ice Ages and Interglacial Periods
Louis Agassiz + some other scientists.
He’s credited for glacial erratics, glacial striations, moraines, and u-shaped valleys.
Glacial striations
Scratch marks left on bedrock from the material in a glacier.
Moraines
An accumulation of unconsolidated debris (gravel, rock, sand, clay, etc) and these form around glaciers.
Glaciers deposit moraines → it also shows where glaciers used to be.
U-shaped valleys
previously glaciated and “bulldozed” the area below.
A V-shaped valley is carved by erosion by a river.
Ice Ages
Long period of reduced Earth's surface and atmospheric temperatures resulting in the presence or expansion of continental and polar ice sheets and glaciers.
Ice ages contain:
Glacial periods
Interglacial periods
Biozones
Periods where species (i.e. ammonites) are found throughout the world and their first and last occurrences.
These species are found everywhere, even in the ocean, and they will mark these areas as biozones.
Greenhouse Periods
Earth has been ice-free for much of its history → greenhouse earth is more common in the geological record than icehouse earth.
Greenhouse periods are associated with major evolutionary events including:
Cambrian Explosion → occurred 540 million years ago.
Dinosaurs → evolved approx. 250 million years ago and went extinct 65 to 66 million years ago.
Sedimentary Record
Sedimentary rock can preserve physical features that can tell us about the conditions when they formed. These are called sedimentary structures.
Drop stones, coal, sand dunes, paleosol, evaporites, cold minerals.
Dropstones
where a glacier picks up a rock and throws it away.
Coal
Form best in wetland. Widespread coalbeds are good indication of a rainy climate. Much coal formed during the carbonifierous period.
Paleosol
Evidence for roots and carbonate nodules.
Evaporites
form from evaporating sea water.
Cold minerals (e.g. ikaite)
some minerals are more stable in cold temperatures, such as ikaite. Evidence of minerals like this is an indicator of cold conditions.
Fossil Record
Fossils provide evidence for past climates.
Organisms are adapted to specific environmental conditions.
Changes in fossil assemblages reflect climate change.
Mass Extinctions
Five major mass extinctions have occurred throughout Earth's history.
All are associated with major environmental and climatic changes.
Index Fossils
Fossilized plants or animals that are characteristic of a certain span of geologic time or environment.
They have a few requirements:
Wide geographical distribution
Limited time range
Need to exhibit rapid evolutionary trends in order to be practical use as an index fossil.
The marine record preserves better than the terrestrial record.
The Big Five Mass Extinctions
End-Ordovician
Late Devonian
Permian–Triassic
Triassic–Jurassic
Cretaceous–Paleogene (K–Pg)
Biodiversity - “Pull of the Recent”
Biodiversity now is higher than it’s ever been before. This is due to a phenomenon called “pull of the recent” where there’s a bias towards the modern period.
This is due to better sampling rates, better preservation, and more material simply because its younger.
Ordovician Mass Extinction (~440 Ma)
~86% of species went extinct.
Associated with:
Global cooling
Followed by global warming
Sea-level changes
Major groups affected:
Brachiopods, Bryozoans, Trilobites, Conodonts, Graptolites
Late Devonian Mass Extinction (~365 Ma)
~75% of species went extinct.
Possible causes:
Ocean anoxia
Global cooling
Volcanism (Viluy Large Igneous Province)
Sea-level fall
Bolide impact
Tectonically-driven climate change
Permian–Triassic Mass Extinction (252 Ma)
Largest mass extinction in Earth's history.
~96% of species went extinct.
Possible causes:
Siberian Traps volcanism
Increased atmospheric CO₂
Ocean acidification
Ocean anoxia
Ozone depletion
Bolide impact
Formation of Pangaea
Triassic–Jurassic Mass Extinction (~201 Ma)
~80% of species went extinct.
Possible causes:
Central Atlantic Magmatic Province (CAMP) volcanism
Increased atmospheric CO₂
Ocean acidification
Ocean anoxia
Climate warming
Cretaceous–Paleogene (K–Pg) Mass Extinction (66 Ma)
~76% of species went extinct.
Possible causes:
Chicxulub bolide impact
Deccan Traps volcanism
Extinction of:
Non-avian dinosaurs
Ammonites
Many marine reptiles
Numerous plankton groups
Tanis Site
Geologists found microtektites → little glass objects resulting from the melting and vaporization of the earth’s crust.
Geologists also found ejectospherules → spherical objects containing crystallines in their own impact craters around the site. The rock liquefied (from heat) and them cooled down to form little spheres.
This site possess exceptional preservation of fish and dinosaurs in three dimensions. It is also thought to preserve the moments during and after the impact.
Milankovitch Cycles
The wobble or procession of things like earth’s axis of rotation, the tilt on the orbital plane (also known as obliquity), and the eccentricity.
Procession is 23,000 years, tilt is 41,000 years, and eccentricity is 100,000 years.
These are the three main ones you need to know.
Gravitation imbalances that cause these repeatable cycles.
1. Orbital eccentricity – 100,000 years
Shape of Earth's orbit changes from more circular to more elliptical.
A nearly circular orbit has low eccentricity.
A more elliptical orbit has high eccentricity.
Affects how much solar radiation the earth receives averaged over its surface.
2. Axial tilt (Obliquity) – 41,000 years
Earth's axis is currently tilted 23.5°.
Tilt varies between 21.5° and 24.5°.
Greater tilt = greater seasonality.
Less tilt = milder seasons, especially at high latitudes.
3. Axial precession – 23,000 years
Earth's axis wobbles like a spinning top.
Changes the distribution of incoming solar radiation.
Less powerful than the other two.
Smaller effect than eccentricity and obliquity.
Milutin Milankovich
He’s a Serbian geophysicist and astronomer. He came up with many big ideas:
According to him, Earth’s long-term climate changes are at least partially affected the position of the earth compared to the Sun.
He found the three cycles (eccentricity, obliquity, and procession).
They correlate with global climate variation.
Thermal Expansion
Warmer water has molecules that are a bit more further apart than colder water.
As oceans warm, it causes sea level rise.
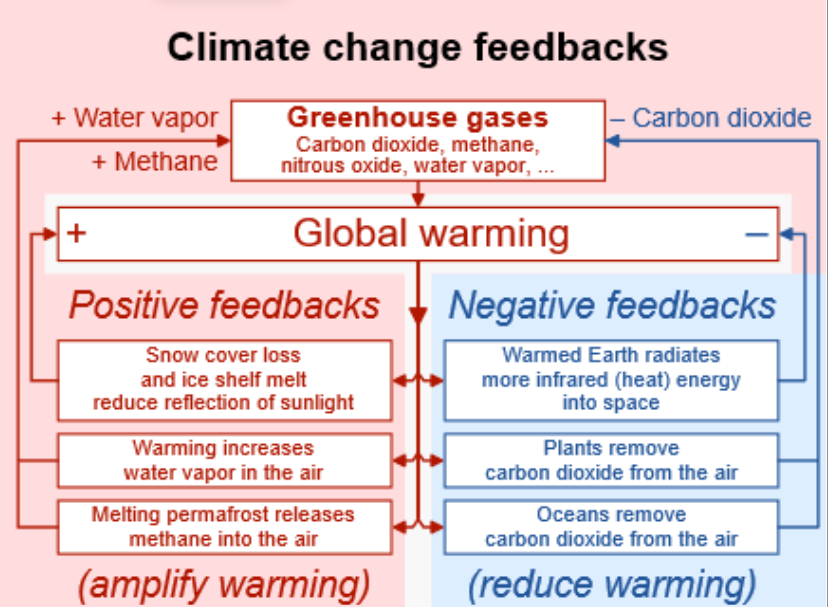
Positive feedback
Amplifies an effect.
Examples:
Greenhouse gases
Reduced snow cover
Increased water vapour
Permafrost melting releasing methane
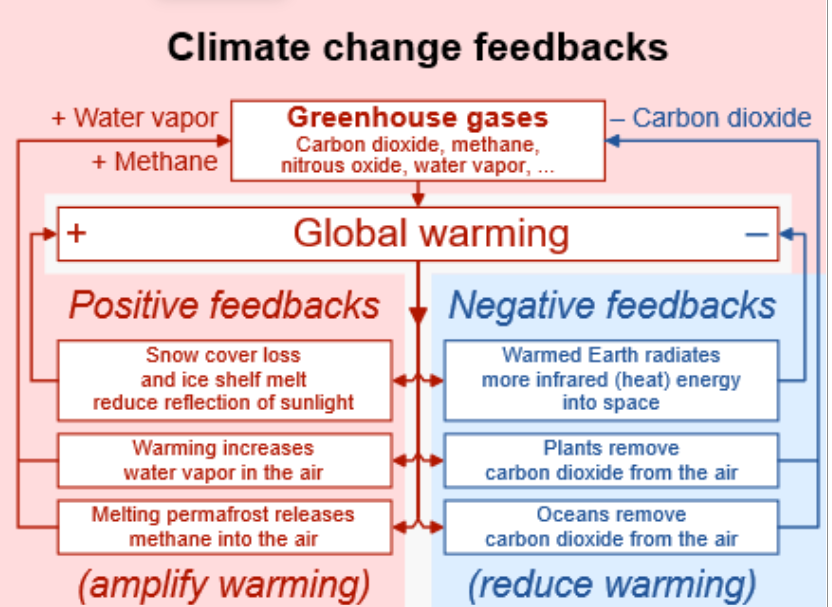
Negative feedback
Reduces an effect.
Examples:
Increased albedo
More plants removing CO₂
Oceans removing CO₂ from the atmosphere
Radiative Forcing
Is defined as a measure of an influence a factor has in altering the balance of incoming and outgoing radiation.
Its an index of the importance of a factor on potential climate change mechanism.
Radiative forcings are often reported as changes relative to the pre-industrial revolution.
Industrial Revolution
Began approximately 1750–1850
Large increase in manufacturing and industrial processes.
Burning coal for steam engines increased carbon emissions.
Since before the Industrial Revolution:
Atmospheric CH₄ has increased by 150%
Atmospheric CO₂ has increased by 48%
Holocene Climate Change
We are currently in the Holocene interglacial.
Slightly warmer periods have occurred (e.g., Medieval Warm Period).
Slightly cooler periods have occurred (e.g., Little Ice Age).
Some natural climate variability is expected.
Current warming is concerning because of:
The rate of change
Climate model projections
Climate model
representation of the climate system that reproduces one or more aspects of climate.
Models may focus on:
Local or regional processes (water vapour or cloud cover, etc)
Global climate
Based on fundamental laws of physics.
Permafrost Thaw
It’s soil or sediment that remains below 0 degrees for two or more years.
It can dry out wetlands, reduce ecosystem space, leads to slope failures and landslides, and frozen debris lobes (FDLs).
Permafrost has also been historically used as a place for hazardous waste disposal.
Permafrost stores mercury. As it melts, it can be taken up by plants and animals + people.
It can also release CO2 and CH4.
Increased precipitation
Higher temperatures increase relative humidity, leading to more heavy precipitation events over land.
This trend has been observed in:
North America
South America
Northern Europe
Northern and Central Asia
Modern climate change and extreme weather
Climate change is increasing the frequency and intensity of extreme weather events.
The IPCC has documented several observed changes linked to global warming.
Temperature extremes
Cold days and nights have become less frequent overall.
Heat extremes are becoming more common as global temperatures rise.
Hurricanes
North Atlantic hurricane activity has intensified alongside warmer tropical sea surface temperatures.
There is no clear trend in the total number of hurricanes.
However, there is a trend toward more intense hurricanes.
The number of Category 4 and 5 hurricanes has approximately doubled compared to 30 years ago.
Human health impacts
The latest IPCC report projects that rising temperatures will increase the number of days with dangerously hot and humid conditions.
These conditions increase the risk of hyperthermia and heat-related mortality.
Even under moderate warming scenarios, some regions may become effectively uninhabitable due to extreme heat and humidity.
Ocean acidification
Ocean acidification is considered a virtually certain impact of climate change according to the IPCC.
This occurs because the oceans absorb large amounts of atmospheric CO₂.
Dissolved CO₂ forms carbonic acid, which dissociates into:
Bicarbonate ions (HCO₃⁻)
Hydrogen ions (H⁺)
The increase in hydrogen ions lowers ocean pH, making seawater more acidic.
Effects on marine organisms
Ocean acidification is especially harmful to organisms that build shells and skeletons from calcium carbonate (CaCO₃).
As seawater becomes more acidic, calcium carbonate becomes more soluble, making shells and skeletons easier to dissolve.
An example is the pteropod shell, which is projected to dissolve under the seawater pH expected by 2100.
Paleocene-Eocene Thermal Maximum (PETM)
This came along with the extinction event at about 55 million years ago.
Associated with a rapid increase in global temperatures. Found in the shells of benthic foraminifera.
Benthic foraminifera → they are single-celled organisms made of calcium carbonate.
The main cause is believed to be a huge release of methane from the ocean sediments in the atmosphere.
Atlantic Meridional Overturning Circulation (AMOC)
Ocean circulation is driven by wind, temperature (heat), and salinity (salt).
Warm ocean currents transport heat from the tropics toward the poles.
One of the most important currents is the Gulf Stream, which carries warm water along the east coast of North America toward Europe.
This helps explain why Europe is warmer than North America at the same latitude.
thermohaline circulation
Ocean circulation is driven by differences in water density.
In the North Atlantic, surface water cools and becomes saltier because sea ice formation leaves salt behind.
The cold, salty water sinks into the deep ocean.
Warm surface water flows northward to replace the sinking water, creating a global "conveyor belt" known as thermohaline circulation (or the Atlantic Meridional Overturning Circulation, AMOC).
This circulation redistributes heat around the planet.
If the AMOC collapses
Scientists expect the AMOC could eventually collapse, although the timing remains uncertain.
A collapse would dramatically alter regional climate, particularly in Europe.
The tropics could become even warmer because less heat would be transported northward.
1. The Archean Earth
The early Earth formed after its collision with a Mars-sized planet (known as Theia) at 4.5 billion years ago.
Theia was destroyed and mixed with the earth. The remaining chunk became the moon.
Relative to the size of our planet, our moon is pretty large.
Accretion of particles and bombarding meteorites make the early part of the Hadean Earth (4.6-4.0 Ga) a homogenous conglomeration of space debris.
Exposed Precambrian sedimentary rocks
The most extensive exposures of Precambrian rocks.
The Canadian shield houses pre-cambrian rock and has some of the oldest rock material.
There is also the pilbara shield.
The red symbols represent known sedimentary rocks aged 3.9-3.8 billion years
Panspermia
Is an idea that perhaps life may have originated somewhere else and then travelled to earth → we’re all martians theory.
“Organic Soup” Model
Key prebiotic monomers (CH2O and HCN) were formed when reduced gases in the atmosphere were subjected to UV irradiation and electrical discharges.
They then condensed to form more complex compounds, such as amino acids, which accumulated into seawater.
“soup.”
The Miller-Urey Experiment
The classic Miller-Urey experiment demonstrated that amino acids, important building blocks of biological proteins, can be synthesized using simple starting materials under simulated prebiotic terrestrial conditions.
Late Heavy Bombardment
One major problem with the ‘Organic Soup’ model – where life evolved from a broth of organic molecules in seawater - is that giant impacts would have constrained the timing of life’s origin at the Earth’s surface.
Post impact plumes of vaporized rock would have enveloped the entire planet and evaporated the upper water column, and perhaps the entire ocean.
This may have increased the surface pressure to above 100 bars and acted as a greenhouse, raising temperatures high enough to sterilize much of the planet for several thousand years.
2. Evidence for Archean Life
Most microorganisms lack substantial hard parts and rarely fossilize.
Thus, their soft tissues are rapidly degraded and evidence of their existence is wiped away with time.
Instead, evidence for ancient life comes from:
microfossils
biogenic structures, e.g., stromatolites and MISS
isotopes
biomarkers
Stromatolites
Bacteria that trap and form these kinds of mats. They are some of the earliest forms of life on earth.
Microbially induced sedimentary structures (MISS)
Microbially induced sedimentary structures (MISS), such as the wrinkled “elephant skin” texture above, are one of the oldest forms of fossil evidence, having been characterized in rocks as old as 3.2 Ga.
MISS are formed by microbial mats of filamentous bacteria trapping siliciclastic sediments in more energetic tidal flat settings.
Cyanobacteria
the early photosynthesizes— began to produce oxygen on a global scale. It allows for respiration in general.
3. Evidence for the Great Oxidation Event
Despite the apparent evidence for cyanobacteria by at least 3.0 Gyr, the geological rock record does not record widespread oxidation on land until around 2.5 Gyr, the “Great Oxidation Event” (GOE).
2.5 billions years ago is when the great oxidation event (goe) occurred. The first form of life occurred 3.8 billion years ago.
Today we define the GOE as the first-time oxygen accumulated into the atmosphere
Sedimentary Organic Matter (SMO)
It is the raw biological debris (from ancient cyanobacteria and microbes) that settled into the ancient ocean floor.
Kerogen
As that sedimentary organic matter (SMO) gets buried and heated over geological time, it chemically cooks and cross-links into a solid, insoluble organic mass called kerogen.
The Hamersley Group
This is a famous, massive geological formation in Australia known for its giant Banded Iron Formations (BIFs).
Geologists isolate the kerogen from Hamersley shales (like the Mt. McRae Shale) to look for chemical "fingerprints" or biomarkers.
These fingerprints give us physical proof of the earliest microbial life and the rise of oxygen on Earth.
4. An oxygen fueled biosphere
One of the most significant outcomes of increased atmospheric O2 is that it would have led to an increase in stratospheric ozone. This had three biological consequences:
(1) It permitted increased occupation of the photic zone of open oceanic waters by plankton.
(2) Biofilms would have colonized vast tracts of land, thus accelerating biological weathering.
(3) Increased atmospheric O2 paved the way for the diversification of eukaryotes.
1. What caused Snowball Earth
By the middle of the Neoproterozoic, the most extensive glaciations for over 1.5 billion years took place, with ice maybe reaching as far as the equator during what is known as a “Snowball Earth” episode.
At least two main phases of ice advance occurred, the first between 715-680 Myr, called the Sturtian glaciation, and the second between 650-632 Myr, called the Marionan glaciation.
There might also have been a 3rd glaciation called the Gaskiers glaciation, but there is less global evidence for it.
Snowball Earth
As the temperature falls, glaciation occurs in the polar oceans.
White ice has a high albedo and thus reflects more solar energy back into space: about 92% of incoming sunlight is reflected away vs. 8% for seawater.
This creates a positive feedback which continues to reduce global temperature.
Eventually, when the ice reached about 33o of latitude, the albedo-induced cooling effect was unstoppable, and the remainder of the planet’s surface, including the equator, froze over in as little time as a decade.
The average global temperature at this time is estimated to have been -50oC.
Snowball Earth cycle
The snowball events were, however, short-lived because volcanoes would have continued to release CO2 into the atmosphere (and ocean), which due to lack of weathering, would climb until surface temperatures induced melting a few million years later.
A few areas of sea ice near the equator would have melted first, and this water would have led to a positive feedback causing more melting and a decrease in albedo.
2. Evidence for Snowball Earth
Diamictites are glacial deposits
On land, glaciers produce deposits, called tillites (a type of diamictite), of exceptionally poorly sorted sediment:
Giant boulders can be deposited alongside very fine particles like silt and clay.
When the boulders are transported to the oceans as part of an ice sheet, they are calved off as icebergs that float out to sea.
When the icebergs melt, the boulders then settle out into the soft underlying sediment as dropstones.