Epidemiology Quiz
1/91
Earn XP
Description and Tags
Lectures 1-5
Name | Mastery | Learn | Test | Matching | Spaced | Call with Kai |
|---|
No analytics yet
Send a link to your students to track their progress
92 Terms
Why do we need epidemiology?
Identify trends in the public’s health (increase in colorectal cancer)
Provide advance warning of possible threats to public health (event based surveillance, sentinel surveillance, social media monitoring, wastewater testing)
Keep people healthy, prevent illness (screening, prevention, awareness, vaccination)
Maximize societal benefit, minimize burden (focus on prevention over treatment, cost effective prevention programs)
Reduce health disparities (build trust locally, widely promote all programs, tailoring programs and policies based on local data)
Early Epidemiologists - Hippocrates
Rejected the idea that illness was religious or supernatural, breaking with ancestral tradition
Recognized association of disease with place
Believed disease was a result of imbalance of the body’s “humors”
Creator of the Hippocratic Oath, modern version still used today
Early Epidemiologists - John Graunt
English statistician
“Founder of epidemiology”
Examined number and causes of death to identify variations in death according to sex, residence, season, and age
Miasma
Diseases caused by environmental factors such as contaminated water, foul air, and poor hygienic conditions
John Snow
Founder of epidemiology
Large cholera outbreak of London
At the time, water was distributed by two main suppliers
Traced the outbreak to one of the suppliers
Germ Theory - Louis Pasteur
Discovered that microorganisms could cause disease
Also studied fermentation and discovered pasteurization
Germ Theory - Robert Koch
Established 4 postulates for providing a microorganism causes disease
Be present in all cases of disease
Be isolated from disease patient
Cause disease when introduced to healthy host
Be isolated again from new host
Defining a Population
Person, place, and time
Who are you interested in?
Where are they?
During what timeframe?
Be specific
Person - Characteristics to consider
Age
Sex/ Gender
Marital Status
Race/ ethnicity
Nativity and migration (where are ppl from)
Religion
SES
Age and Health Outcomes
Human biological clock
Waning of immune system —> increased susceptibility
Life cycle and behavioral phenomena
Personal behavior and risk-taking influence disease/mortality (ex: homicide among youth)
Delay b/w exposure and subsequent disease (ex: exposure to carcinogen is usually a lot earlier than cancer diagnosis)
Older individuals have had greater opportunity for adverse exposures (ex: higher rate of adult cancer than pediatric)
Sex/Gender and Health Outcomes
All-cause and age-specific mortality rates higher for men than women
Male
Hearing imparement, CVD, smoking-related illnesses, chronic illness severity
Female
Pain, asthma/lung difficulties, depression
US Life Expectancy
Males: 74.8, Females: 80.2
Race/Ethnicity and Health Outcomes
Differences in mortality by race/ethnicity
Black Americans = 72.8 years
White Americans = 77.5 years
Asian Americans = 84.5 years (longest lifespan)
AIAN American = 67.9 years (shortest lifespan)
Differences are likely multifactorial
Stress, health behaviors, systemic racism
Place
Disease, health behaviors, mortality show great variation globally
Climate, cultural factors, dietary habits (Mediterranean diet is very good), healthcare access, etc
Also, within-country variation (by state, region, county)
NYC vs upstate
Urban vs rural differences due to crowding, pollution, poverty, healthcare access, violence, food access (food deserts)
Always be specific
Time
Periodic changes in frequency of diseases and health conditions over time (months, years)
Birth rates: highest August and September
Heart disease mortality: winter
Influenza: December - February
Homicide: summer
Related to changes in lifestyle, seasonal climatic changes (have more defined illness seasons in places with seasons), virulence of infectious agent (less exercise in winter so immune system weakens), cultural shift (more public health awareness nowadays)
Stationary vs Dynamic Populations
Stationary/fixed
Membership is based on an event and is permanent
Can’t become part of that community
Ex: 9/11 survivors
Dynamic/ open
Membership is based on a condition and is transitory
Ex: NYC residents, NYU community
Steady state: # of people leaving population = # of people entering population
Exposures and Outcomes
An exposure is the hypothesized cause of an outcome
Virus, bacteria, genetics, smoking, sun exposure, diet, income, education
An outcome is your health event of interest
Death, covid, lung cancer, overdose, car accidents, depression
Can’t be the same thing
Define both before beginning study
Be specific aka operationalizing your exposure and outcome
Consider subjective vs objective measures
Ex: Exposure = flu virus, Outcome = flu illness
Outcome vs Results
Outcome
Defined before a study starts
The thing you are interested in studying
Result
The finding of your study
Cannot define before study starts bc it’s the purpose of the study
Ex: I want to see if lack of sleep caused depression.
Outcome: Depression
Result: I found that lack of sleep increases the risk of depression
Subjective vs Objective
Subjective
Self report (surveys, questionnaires)
No defined scale, could be lying
Objective
Medical charts - weight, bp, height
Blood tests
MRIs
Validates scales
Measurement Types
Binary
2 options
Continuous
Any numerical value within a range
Age, height, income, GPA
Categorical
No order
Race, marital status, job category, eye color
Ordinal
Categories with an order
Low, medium, high
Three Key Factors of Epidemiology - Epidemiology Triad Model
Host, Agent, Environment
Hosts
Can increase or decrease the chance for disease or severity (the organism, human, carrying the disease)
Factors
Personal traits (more social vs isolating)
Behaviors
Genetics (predisposition, sickle cell)
Immunologic factors (high allergies in US)
Agents
Necessary for disease to occur (the cause of disease itself)
Factors:
Biological (fungus)
Physical (allow to replicate/mutate fast)
Chemical (how are they distributed - ex: aerosol (covid)
Environment
Contributes to the disease process
Factors:
External conditions (snowing outside —> more ppl indoors in the gym, grocery stores, malls)
Physical, biologic, or social factors
Epi Triad and Disease
Triad should be in homeostasis for patterns of disease to be stable
No longer balances = disease occurs
Ex: no more vaccination requirement in Florida —> host is disrupted
Spectrum of Disease
Susceptibility
Subclinical disease
Individual is infected but clinical symptoms are absent
Might be able to detect early illness through screening
Clinical disease
Symptoms present
Time of diagnosis
Recovery, disability, or death
Incubation Period
Stage of subclinical disease
Time from exposure to onset of symptoms
Disease Transmission
Direct (person to person)
Droplets (covid, flu)
Indirect
Waterborne (cholera)
Foodborne (salmonella, norovirus)
Vectorborne (malaria)
Animals are intermediaries
Vehicle borne (via fomite)
Inanimate objects
Door handles
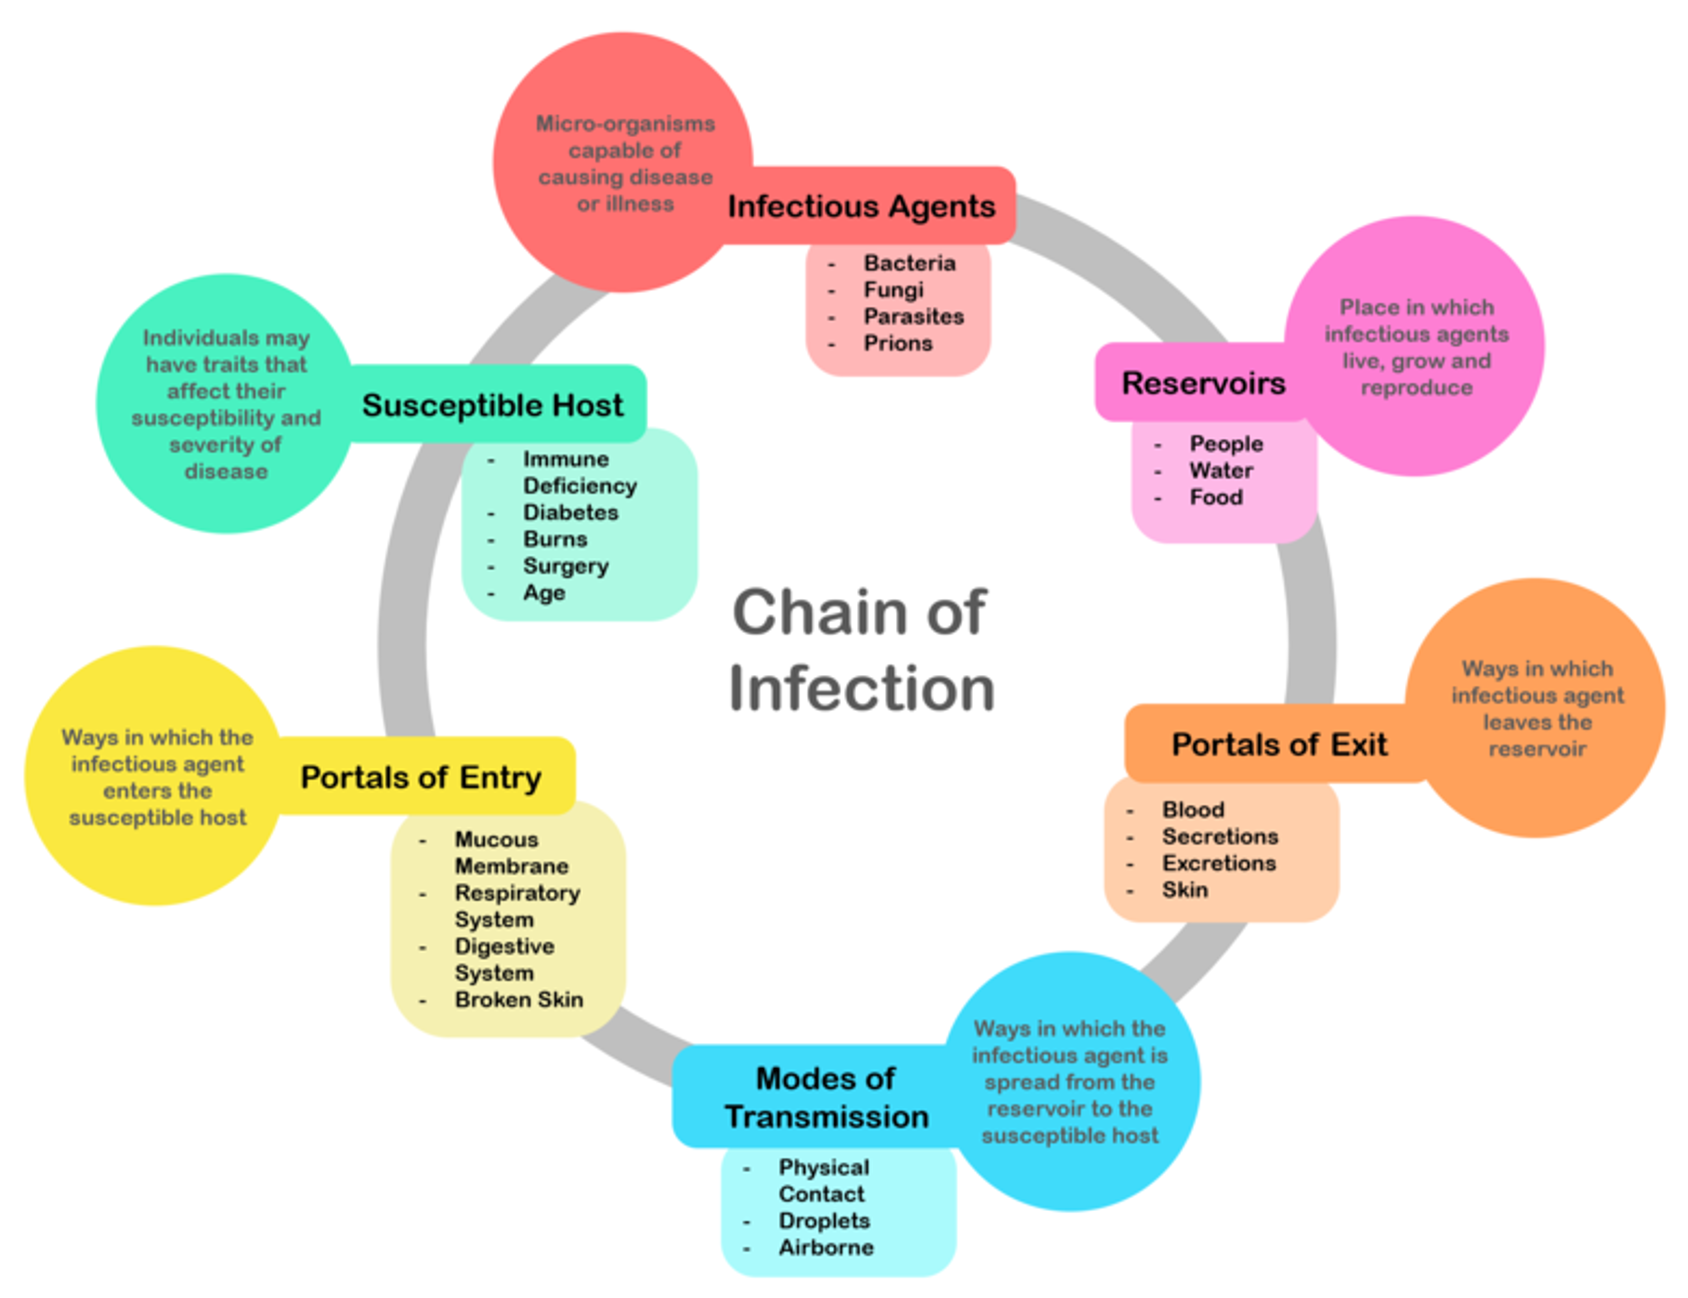
Chain of Infection
Agent - disease producing factor
Source/Reservoir - environment/habitat where a pathogen can live and multiply
Portal of Exit - pathogen leaves reservoir
Mode of Transmission - how agent moves from reservoir to host
Portal of Entry - opening where pathogen may enter
Host - person at risk
Ex of Chain of Infection
Agent - bubonic plague
Source - rats
Exit portal - flea bite
Mode of Transmission - Vector (flea)
Portal of Entry - flea bite on skin
Host - person bitten
Stopping an Outbreak/Disease Pattern
Must break the chain of transission
Upstream —> agent
ex: get rid of mosquitos
Downstream —> host
ex: vaccines
Defining Disease Patterns
Endemic
Illness consistently present in an area
ex: lyme disease upstate
Epidemic (larger area)
Cases are higher than expected and derived from a common exposure
Opioid epidemic
Influenza
Outbreak (smaller area)
Cases are higher than expected and derived from a common exposure
Norovirus outbreak at a wedding
Pandemic
Worldwide epidemic on at least 3 continents
Covid-19 2020
Exception: for some severe illnesses (plague, anthrax, cholera in the US) or previously eradicated illnesses (smallpox) just one case can be an epidemic
Herd/Population Immunity
Indirect protection from an infectious disease that happens when a population is immune either through vaccination or immunity developed through previous infection
Morbidity
Measuring states of disease
2 major types - prevalence and incidence
Counts + limitation
How many cases/deaths do you have?
Simplest and most commonly performed quantitative measure in epi
Limited bc no timeframe, needs context
Prevalence
Total cases of a disease in a population over a specified time period
Expressed as a percentage or number of cases per unit size of population
Indicates the burden of disease
Once someone is an existing case, they remain one unless they recover or die
Prevalence = (# total cases) / (total population over a time period)
Types of Prevalence
Point Prevalence
At one/short point in time
ex: prevalence on Sept 1, 2024
Period Prevalence
Over period of time
ex: prevalence from 2020-2024
Cumulative Lifetime Prevalence
Over a lifetime
ex: prevalence of people ever diagnosed with disease X
Incidence
Number of new cases of a disease in a population at risk over a specified time period
Expressed as a percentage or number of cases per unit size of population at risk
Indicates the risk of disease
In other words, probability someone who is at risk of disease will get it
Incidence = (# new cases) / *(total pop at risk over a time period)
What does “at risk” mean?
Someone who is susceptible to the disease
This will differ depending on specific disease you are interested in
Reasons someone may not be at risk
Immune
Vaccinated, type of disease where you cannot be reinfected after having it (chickenpox)
Note that if you can get reinfected then would still be at risk even if you already had it (covid, common cold)
Already have disease
If you have HIV, no longer at risk of developing it
Cannot develop disease
Can only develop uterine cancer if you have a uterus
Prevalence vs. Incidence
Prevalence
Purpose
Measure burden
Numerator
Old AND new cases
Denominator
Total population
Incidence
Purpose
Measure risk
Numerator
New cases ONLY
Denominator
Total population at risk
Types of Incidence
Incidence / Cumulative Incidence *
Assumed everyone at risk in population is at risk the same amount of time
Likely not a true assumption – people are diagnosed at different times, people come in/out of populations
Incidence rate
Accounts for time at risk
People who are diagnosed early get less time “at risk” than those diagnosed late or not at all
People who come into population late or leave early get less time “at risk” than someone in population the whole time
Epidemiologists Bathtub
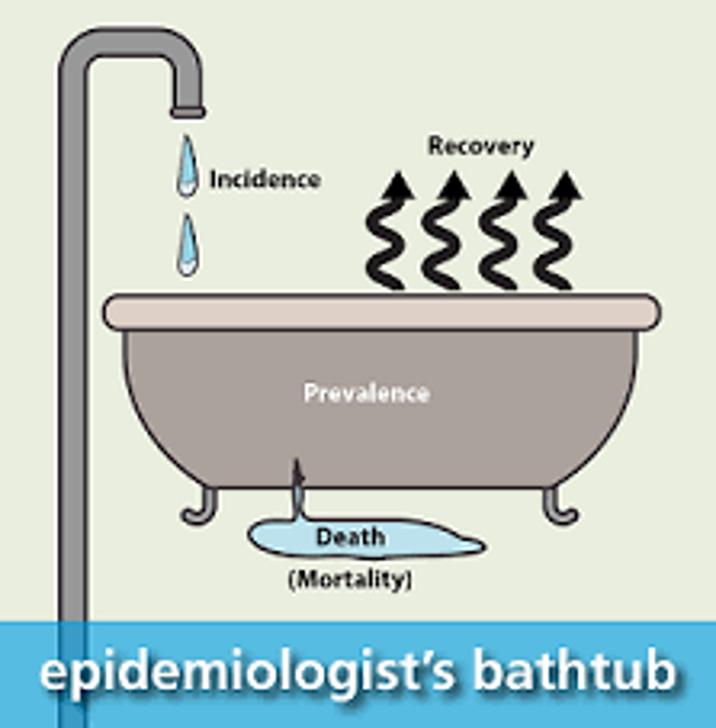
Mortality
Mortality
Measuring death from diseases
Many different types
Crude mortality
Cause-specific mortality
Case-fatality
Infant mortality
Crude Mortality
Number of total deaths in a population over a specified period of time
Expressed as number of deaths per unit size of population
Crude Mortality = (# total deaths) / total population over a time period
Crude Mortality Limitations
It does not account for systematic factors that could impact mortality like AGE
Imagine…
Population A has a crude mortality of 90 deaths per 100 people
Population B has a crude mortality of 5 deaths per 100 people
At first glace Population A seems like a big issue, but what if everyone in that population happen to be 100 years or older?
Adjusted Mortality
Therefore, crude mortality is not a good measure when comparing populations
Solution? Adjustments!
Summary measures that use a statistic procedure to remove the effect of different population compositions
Age-adjusted mortality
Sex-adjusted mortality
Allows us to compare across populations
Other Common Mortality Measures
Cause-specific mortality
Number of deaths in total population caused by specific disease/health outcome
Infant mortality
Number of deaths among infants in population
Case fatality
Number of deaths among those with specific disease
Surveillance
“The continued watchfulness over the distribution and trends of incidence [of a disease] through the systematic collection, consolidation, and evaluation of morbidity and mortality reports and other relevant data.” Alexander Langmuir
Why Collect Surveillance Data?
Assess population health status
Define objectives, priorities, and strategies
Target interventions
Evaluate interventions, effectiveness of control efforts
Generate research hypotheses
Monitor temporal trends
Detect outbreaks
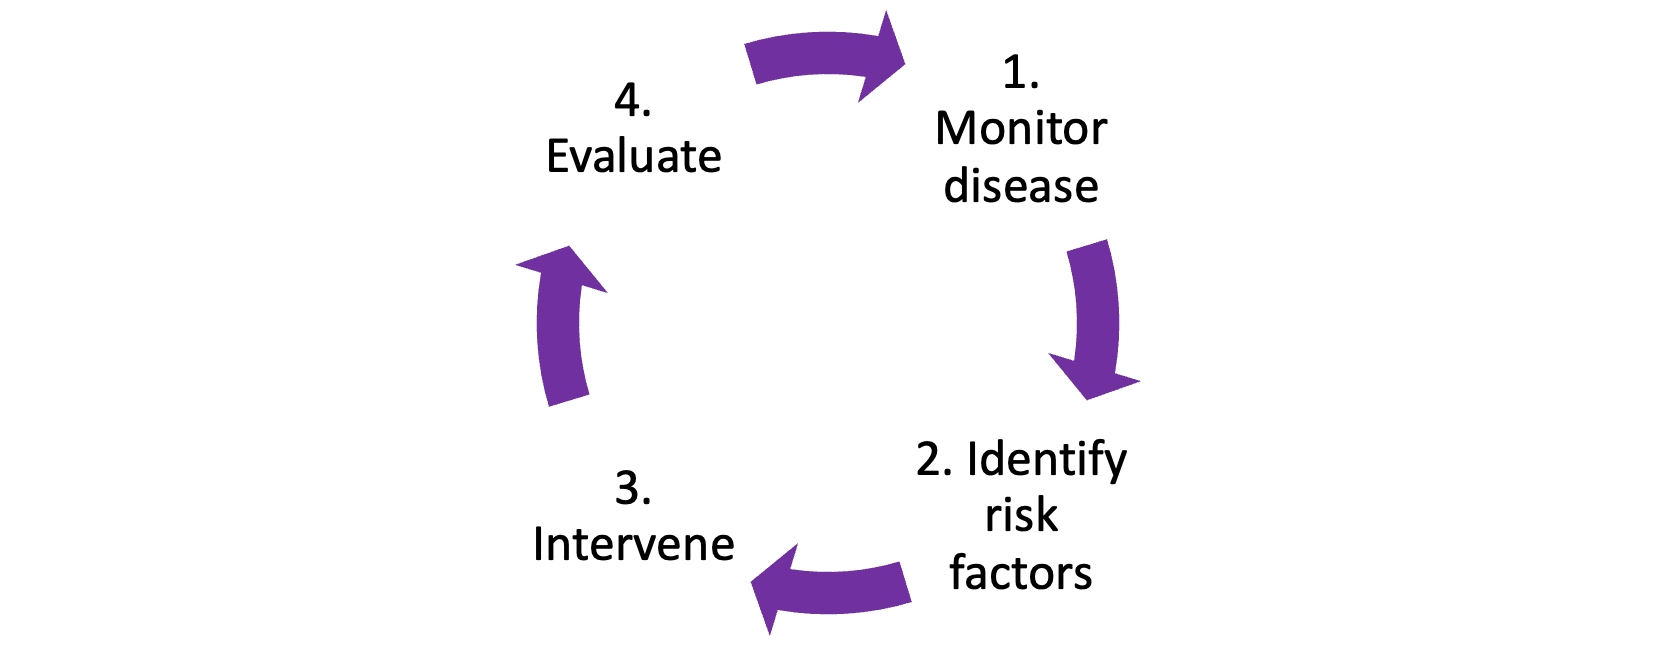
Surveillance Informs Control and Prevention
Some Questions Surveillance Data Can Answer
What is the infant mortality rate?
Has there been an increase in unsafe sex among MSMs?
Are smoking rates declining in teens?
What factors are associated with West Nile Virus?
Is flu season here? Is it more severe than usual?
What neighborhood has the highest rates of overdose?
Surveillance Examples
National HIV Behavioral Surveillance (NHBS)
In 2000, CDC and external experts designed a national plan for HIV prevention
One of the 4 goals
“Strengthen the national capacity to monitor the HIV epidemic to better direct and evaluate prevention efforts.”
In 2002, state & local government funded to develop NHBS
Findings used to enhance understanding of HIV risk and testing in high-risk groups and to develop and evaluate HIV prevention programs serving them
COVID-19 Surveillance
CDC worked with state and local departments of health, academic, and commercial partners
Goal was to understand the extent of SARS-CoV-2 infection and track trends
Used serology testing and surveys to monitor past infection (antibody)
Geographic surveys, community level surveys, and smaller-scale surveys (of specific populations)
Steps in Conducting Surveillance
1) Identify, define, and measure health problem of interest and objective of surveillance program
2) Collect and compile data about the problem
3) Analyze and interpret these data
4) Share data with those responsible for control
Take steps to control problem, as needed
5) Monitor and evaluate usefulness of surveillance program
Criteria for Selecting Health Problems for Surveillance
Public health importance
Incidence, prevalence, severity, consequences/mortality, socioeconomic impact, communicability, public perception, international requirements
Ability to prevent, control, treat the problem
Capacity of health system to implement control measures
Speed of response, economics, availability of resources (including availability of data), ability to ensure people get treatment they need
Data Sources
Various data sources
Individuals, environment, healthcare providers / institutions
Collected continuously, periodically, or defined period
Data can be:
Primary – environmental monitoring, notifications, registries (including vital statistics)
Secondary – medical records, school records, other administrative data, surveys
Common Attributes of Surveillance Systems
•Simple
•Stable
•Acceptable (to data providers)
•Standardized, uniform, high-quality data
•Timely (in reporting events)
•Representative (of all areas)
•Sensitive (to outbreaks and changes in trends)
•Flexible (to changing surveillance needs)
Data Sources: Examples
•Reportable disease notifications
•Statistics from vital registration system (births, deaths)
•Surveys of general population
•Disease registries
•Insurance data
•Clinical data sources
•School health programs
•Census data
•Economic data
•Reports from health organizations (e.g., CDC, WHO)
Active vs. Passive Surveillance
Active
Health department contacts healthcare providers or laboratories about conditions to identify cases
Advantage – Useful when need to identify all cases
Disadvantage – Requires more resources (expensive)
Passive
Health departments rely on healthcare provider or laboratories to report cases of disease
Advantage – Efficient, requires limited resources
Disadvantage – Incomplete due to underreporting
Reportable Disease Notifications
Reporting of certain diseases/health conditions as specified by law, regulation or agreement
Typically made to local or state health agencies
Types
Communicable diseases (COVID-19, HIV, HAV, HBV, HCV, Influenza)
Chemical and physical hazards (e.g., lead poisoning, firearm injury)
Adverse drug events
Elevated blood levels of lead
National Electronic Disease Surveillance System (NEDSS)*
Electronic public health surveillance system that regularly provides data to the CDC on notifiable diseases
Each state has an electronic system where this is information is aggregated
Reporting is regulated by states and it technically voluntary
All 50 states and the District of Columbia participate
Prior to COVID-19, not all states met the technological requirements to report using this system
Reportable Disease Notifications: Limitations
Possible incompleteness of population coverage
I.e. - Asymptomatic persons would not seek treatment
•Failure of physician to fill out required forms (burden on provider, incomplete forms)
•Unwillingness to report cases that carry social stigma
•Can take time (especially if passive surveillance)
Registries
•Centralized database for documenting or tracking health events
•Certain registries are required by law
•Reported by health care providers, health care facilities, morticians/funeral directors, patients
Examples
Vital statistics (births, deaths)
Immunizations
Disease specific
Exposure specific (9/11)
age, place of death, residence, sex, job, marital status, cause of death, etc
Registry—SEER
The SEER (Surveillance, Epidemiology, and End Results) program collects and distributes cancer incidence and survival data from several different cancer registries
Runs within NIH through the National Cancer Institute (NCI)
Mortality Data Limitations
Cause of death is unclear
Example: Someone with various chronic conditions
•Lack of standardization of diagnostic criteria
•Errors in coding
•Changes in coding (ICD codes can change over time)
•Stigma associated with certain diseases, e.g., AIDS, suicide, may lead to inaccurate reporting
Surveys
Systematic, structured method of gathering information to quantitatively describe population
Census (entire population) vs. sample of population
•Typically conducted at one point in time, but some are done repeatedly
•Many are population-based
Uses
Understand burden of health problem (prevalence!)
Conduct surveillance and examine trends
Estimate and target needed resources
Survey—NHANES
program of studies designed to assess the health and nutritional status of adults and children in the United States
Each year, it examines a nationally representative sample of ~5,000 persons.
Participants are in counties across the country, 15 are visited each year.
The visit includes:
An interview: demographic, socioeconomic, dietary, and health-related questions.
An examination: medical, dental, and physiological measurements, as well as laboratory tests administered by highly trained medical personnel
Surveys: Limitations
•Time delay between data collection vs. publication
•People may not complete the surveys (non-response)
•Relies on self-reported data which may be inaccurate
•Large population-base surveys are expensive and resource intensive
•Can be difficult to reach smaller sub-populations
•Some populations excluded (people experiencing homelessness, those in institutional settings like jail/prison)
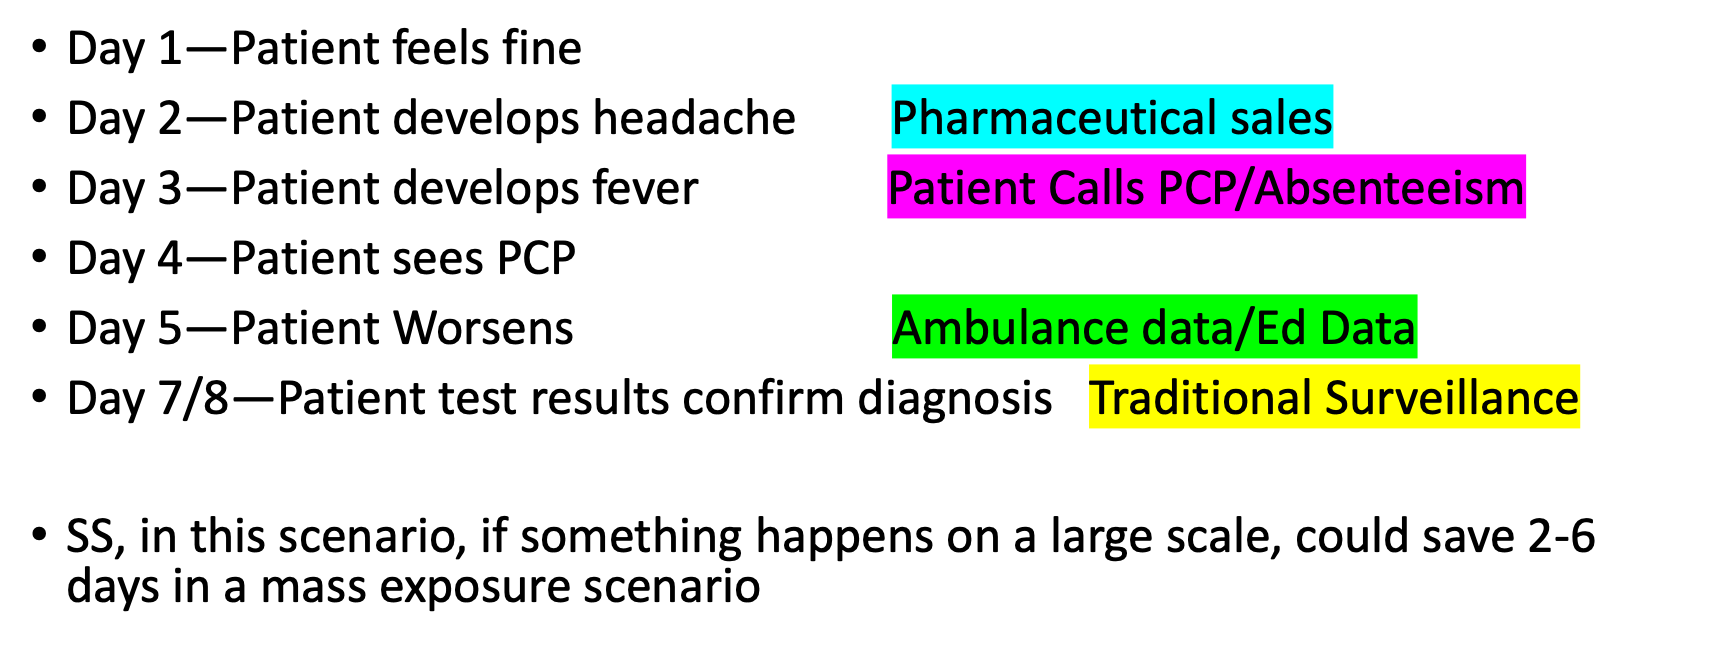
Syndromic Surveillance
Method that uses health-related data BEFORE a diagnosis
Thresholds are set and higher than expected thresholds “signal” there is a sufficient probability that a public health response should be considered
Operationalized to target potential cases
Today, it is mostly considered as bioterrorism surveillance
Identify clusters of illness (symptoms) early, prior to a confirmed diagnosis and before it is officially reported to a public health agency
This allows for earlier mobilization of response to reduce morbidity and mortality
Uses real health data, in real time, to provide immediate data for analysis and feedback to potential outbreak investigators
Syndromic Surveillance & Bioterrorism
Bioterrorism events often initially present with non-specific clinic manifestations
Pathogens that may have been altered may result in atypical clinical symptoms
For rare diseases, some physicians may never have seen a case
Think smallpox, diphtheria, even measles
It is possible that careful monitoring of specific symptoms can provide public health with early evidence of attacks
Spikes in ED complaints of nausea, neurological symptoms, respiratory issues, etc.
Examples of Syndromic Surveillance Sources
Pre-diagnostic/chief complaint
Most common, typically comes from EDs
Over-the-counter transactions
Drug stores
Grocery store purchases with OTC medicine purchases
•911 calls
•Ambulance dispatch data
•Absenteeism data
•ED discharge summaries
•Prescriptions (pharmacies)
Example: Syndromic Surveillance
What do we do with data after collecting it
Analyze by person, time, and place
Interpret data
Why might prevalence or incidence have increased or decreased over time
Disseminate data and interpretations to healthcare providers, public health professionals, community
MMWRs, surveillance reports (NYCDOHMH)
Evaluate and improve surveillance systems
Useful? What resources are needed?
HIV Outbreak in Scott County, IN
Passive surveillance of HIV to Active helps identify more cases
Notified CDC in 2015, 11 years after first diagnosis
Key Findings
•Cases primarily among people who injected drugs
•Syringe exchange programs not permitted by law
•Limited HIV awareness
•No outpatient HIV care in the community
•Insufficient substance use treatment
•Few individuals were employed or had insurance
Using the data
What is an outbreak investigation?
•Methodology to investigate an unusual number of related illnesses or an unusual geographic clustering of illnesses
Typically outbreak investigations are for infectious diseases
Investigations into chronic disease occurrence, such as geographically related cancers are typically called cluster studies
Notable outbreak investigations
John Snow—Broad Street Pump
Ignaz Semmelweis—Childbed Fever
Ignaz Semmelweis - Childbed Fever
Found that doctors and med students were not washing their hands compared to midwives so their unit had higher mortality rate of childbed fever. Implemented a rule about handwashing and rates decreased. But faced backlash so his findings weren’t published for a long time.
Why’s it important to investigate outbreaks?
Who is involved in outbreak investigations?
Local
Local Health dept
Local businesses
Hospitals
Outpatient Providers
State
State Health dept
state water agency
state food agency
Federal
CDC
FDA
EPA
What are the steps to investigate an outbreak?
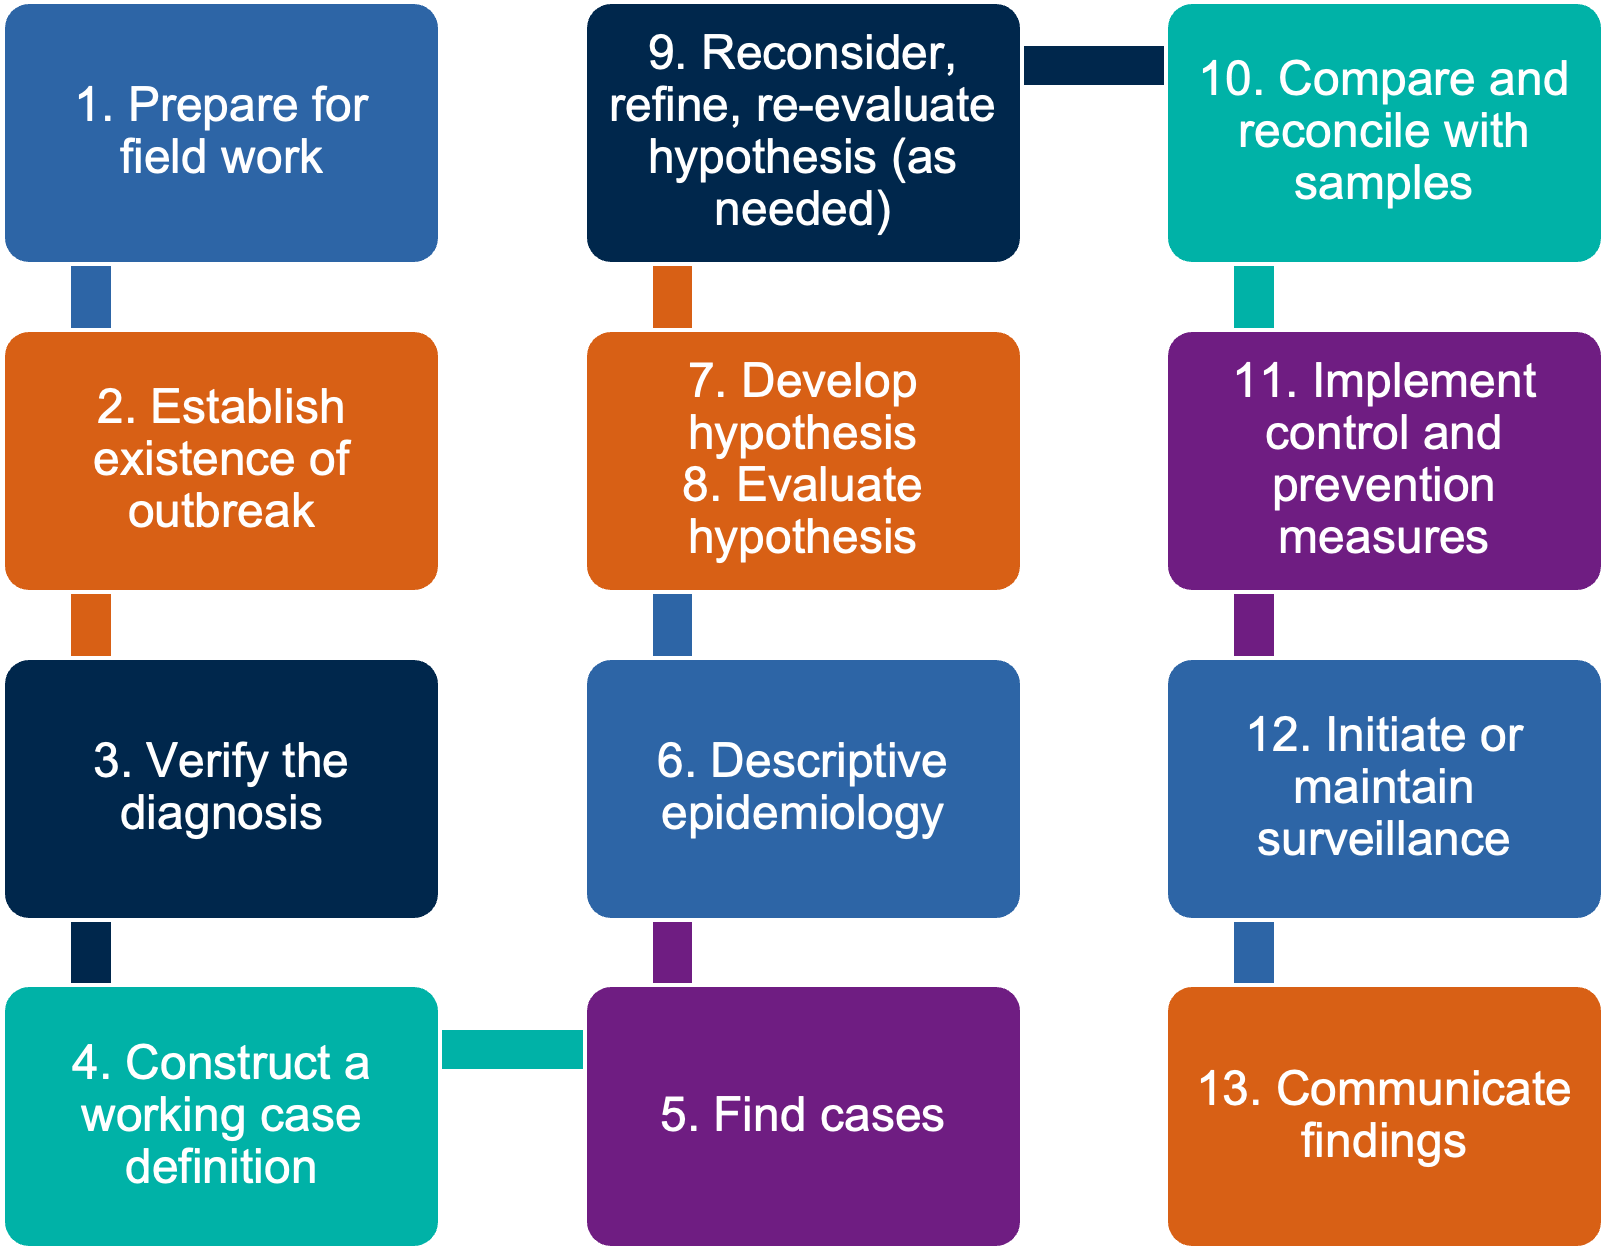
1. Prepare for Field Work
Listed first, but often occurs concurrently with or right after the “second” step (establish existence of an outbreak)
Scientific and Investigative Issues
Lab supplies
Lab capability
PPE
Management Issues
Coordination
Within agency
With external agencies
Logistics
Responsibilities of agencies
Establish Existence of an Outbreak
Considerations for non-outbreak/epidemic situations:
Severity of the illness
Potential for spread
Availability of control measures
Political considerations
Public relations
Available resources
3. Verify the Diagnosis
Review Clinical Findings and Lab Results
Summarize Clinical Picture with Frequency Tables
4. Construct a Case Definition
A case definition is a standard set of criteria for deciding whether an individual should be classified as having the health condition of interest
Includes clinical criteria and restrictions by time, place, and person.
Clinical criteria should be based on simple and objective measures such as:
Fever ≥ 40°C (101°F)
Three or more loose bowel movements per day
Myalgia (muscle pain) severe enough to limit the patient’s usual activities
Common mistake: do not limit the case definition to the exposure/risk factor you are investigating!!
Broad vs Narrow Case Definition
Broad Case Definitions
Fever ≥ 40°C (101°F), cough
Likely to result in a high number of “cases”
Identification of patrons at an event where foodborne illness is suspected (helps increase number of samples)
Highly contagious or highly deadly illnesses where strict quarantine is needed to prevent spread
Higher likelihood of catching non-cases, less likely to miss cases
Narrow Case Definitions
Fever ≥ 40°C (101°F), cough, lampshade rash
Likely to result in lower number of “cases”
Diseases where the symptoms are well documented
Situations where “false positives” are of concern
Closing restaurants, removing a product from the market
Higher likelihood of missing cases, less likely of catching non-cases
Which is better?
Depends on what you are investigating
5. Find Cases and Record Information
•Active Surveillance
•Passive Surveillance
Information usually collected using a line list
identifying info
demographics
clinical info (symptoms, dates)
risk factor info
reporter info
6. Descriptive Epidemiology
Describe the key characteristics of ill individuals
Helps infer the population at risk
Person, place, time
7. Develop Hypotheses
This step generally starts with the initial notification that there may be an outbreak
What do you know?
What is the normal reservoir?
How is it transmitted?
What are the common vehicles?
What are the risk factors?
Make sure to consider bioterrorism if warranted
Epidemiologic clues to bioterrorism
•One case of an uncommon agent (smallpox)
•Atypical strain of an agent
•Higher morbidity or mortality; ineffective usual therapy
•Unusual seasonal or geographic distribution
•Spike in a typically stable endemic disease (plague)
•Atypical transmission
•Exposure limited to one ventilation source (building)
•Many similarly ill persons seeking treatment in the same area at the same time
8: Evaluate Hypotheses Epidemiologically
Retrospective Cohort Studies
Attack rates
Relative Risk
Attributable Risk
Chi-squared Test (Statistical Significance)
Confidence Intervals
Case-Control Studies
Odds ratios
Most important consideration is picking controls
Example: Attendees at a wedding who developed gastroenteritis would be cases and attendees who attended but did not get ill would be the ideal control
9. Reconsider, Refine, Re-evaluate Hypotheses
•Unable to develop hypotheses with descriptive epi
•Evaluation of hypotheses did not yield any clues (step 8)
•Hypotheses may need to be narrowed based on findings
10. Compare and Reconcile with Samples
Patient Samples
Norovirus
Salmonella
E. coli
Measles
Environmental Samples
Food
Surface
Faucets
Cooling Towers
11. Implement Control & Prevention Measures
Eliminate Source
Cleaning
Discarding food
Mitigate Potential for Spread
Isolation of cases
Quarantine of contacts
Preventative antivirals for contacts
Masking
12. Initiate or Maintain Surveillance
Typically, surveillance begins immediately once a potential outbreak is reported
Maintenance of surveillance
High index of suspicion for cases meeting the case definition
Consider the outbreak ongoing until two incubation periods have passed with no cases
Example: Hepatitis A has an incubation period of 15-50 days. Therefore, to declare the outbreak over, you must not have any outbreak related cases for 100 days.
13. Communicate Findings
General Public (News)
Key Stakeholders (local authorities, state agencies, CDC, FDA, EPA)
Contributions to Literature (CDC MMWR, journal publication, White Paper)