EVR1001 FINAL
1/76
There's no tags or description
Looks like no tags are added yet.
Name | Mastery | Learn | Test | Matching | Spaced |
|---|
No study sessions yet.
77 Terms
In Miami Dade County our drinking water is drawn from the ___ aquifer
biscayne
what rock makes up the freshwater bearing rock formation identified as the biscayne aquifer
limestone
which of the following is an example of a discharge from a point source
sewage pipe
a large underwater structure formed by colonies of tiny animals (coral) that produce a calcium carbonate exoskeleton that over time builds up; found in shallow, warm, tropical seas
coral reef
what factor in the ocean is key in determining environmental conditions
depth
what is the major cause of ocean acidification
the increase in atmospheric carbon dioxide levels caused by human activity
the greenhouse effect involved a single ray of solar radiation following series of steps once it enter the planets atmosphere. place them in sequential order
1- solar radiation enters the atmosphere
2- surface on earth reflects or absorb the radiation
3- the radiation absorbed by the ground is eventually released as infrared radiation
4- radiation is reflected by atmospheric particles, like greenhouse gases, back toward earth
5- trapped radiation increases the temperature of the atmosphere
climate is
the long term patterns or trends of meteorological conditions
the primary driver of ocean acidification is
increased concentrations of C02 in the atmosphere (which dissolves in the ocean water)
which biochemical reaction is at the center of the carbon cycle that is responsible for drawing carbon dioxide out of the atmosphere and sequestering it in to biological materials
photosynthesis
how does the anthropogenic release of CO2 from fossil fuel use influence the carbon cycle
it increases the atmospheric pool without altering the rate at which carbon is removed from the pool
How does the ocean remove CO2 from the atmosphere?
It dissolves some of the gaseous CO2 that touches it
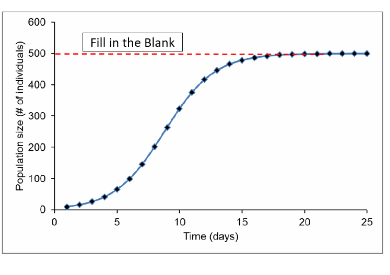
Fill in the blank with the term that represents the red dashed line in the diagram
carrying capacity
________ are different forms of an element that have the same number of protons but a different number of neutrons
isotope
In which stage of the demographic transition model is infant and childhood mortality rates very high?
IV (four)
A country experiencing zero population growth is most likely
in stage 4 of the demographic transition
Match these 3 coal mining techniques with the relative depth of the coal they're after.
shallow (<200ft) - strip mining
moderate depth - mountaintop removal
deep (>1000ft) - underground mining
There are three steps to the oil refinement process: separation, conversion and treatment. During conversion:
some fractions are transformed in to other products
Wind power is very similar to other energy sources in that a turbine is spun to generate electricity. However, the key difference between wind and most other energy generation methods is that wind turbines are spun by ______, whereas most others are spun by steam.
wind
Which of the following are known negatives of solar power? (select all that apply)
large 'solar farms' are often placed in fragile ecosystems that are damaged by their presence
manufacturing solar panels generates hazardous wastes
They require frequent cleaning with water, which can add to water shortages in dry areas
Solar thermal systems often use hazardous fluids that require special handling
The finite quantity of resources on Earth requires all species to find a way to use the resources _______________ if they're going to exist without degrading the potential of future offspring to do the same.
Sustainably
Ecosystems need to rely on a form of energy that is continuously supplied because ________________
When energy is used by one organism, it is converted to a form that is not useful to others.
Which statement is TRUE regarding the greenhouse effect?
Increased levels of human-produced carbon dioxide have enhanced the greenhouse effect.
The theory of Island Biogeography indicates that patches of various size and distances have differing rates of extinction and species accumulation. Which statement would be supported by this theory?
The most extinction prone habitat fragments are those which are the most isolated
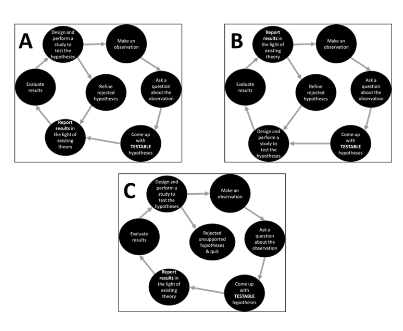
Which of the panels below properly depicts the scientific method?
B
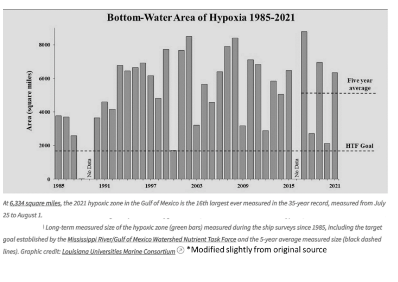
Agricultural and urban runoff lead to large eutrophication events in the Gulf of Mexico, annually. The figure below shows the size of the area of near-bottom hypoxia (lack of oxygen) induced by these eutrophication events each year since 1985. The NOAA management target is shown by a dashed line labeled "HTF Goal". Also shown by the upper dashed line is the average size during the past five years. Which statement is true regarding the data presented here?
There has been only one observed year where the extent of eutrophication induced hypoxia in the Gulf of Mexico met the target.
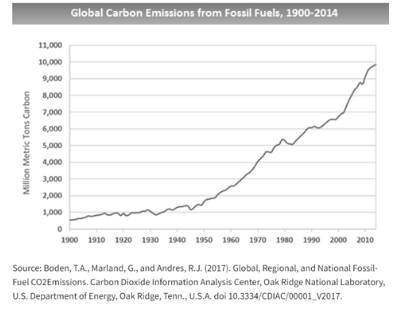
Using only the information presented in the figure provided, what conclusions can be drawn based only on the data shown?
Global carbon dioxide emissions from fossil fuels have been increasing for over a century.
In the US, the agricultural industry is the greatest emitter of methane, largest user of freshwater and the major contributor of nitrogen-based pollution. Techniques exist today to minimize each of these issues. How could consumers realistically influence agricultural practices, if they chose to do so?
Vote through their choice of purchases.
Naturally sustainable ecosystems are energetically open, and mostly closed to new matter leading to finite resources. Which statement is NOT characteristic of a sustainable ecosystem?
It is able to support ever-increasing population sizes.
Evaluate the following statements, then select the answer which is best supported by them.
Statement 1: Coral reefs are the most biodiverse, known marine ecosystem in the world, providing irreplaceable support services to thousands of species.
Statement 2: The existence of coral reefs is directly threatened by multiple aspects of near-term climate change.
Climate change's threats to coral reefs pose a threat to global biodiversity.
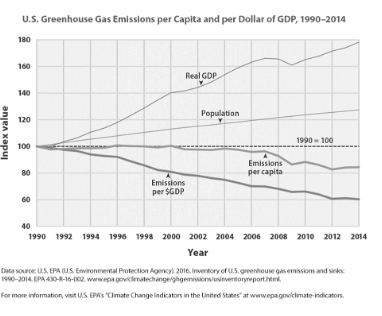
The chart below shows the US gross domestic product (GDP), a measure of economic productivity, US population size, carbon dioxide emissions per capita and the amount of carbon emitted per dollar of GDP. There has been a general hesitance to reduce carbon emissions in the US for fears that it would harm the economy and reduce GDP, despite climate related risks of continued carbon emissions. After viewing the information in the graph, which statement below is true regarding U.S. greenhouse gas emissions?
The reasons for the reluctance to decrease carbon emissions are not supported by the data shown. The Real GDP is increasing as emissions per Capita and per $GDP decrease.
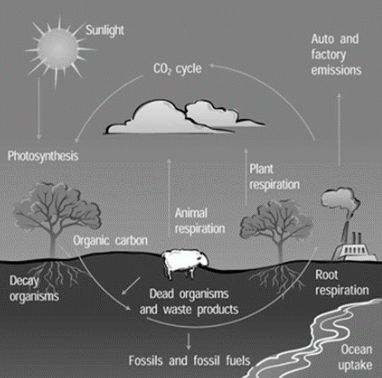
The graphic below shows the carbon cycle. The source of the figure is https://scied.ucar.edu/learning-zone/earth-system/biogeochemical-cyclesLinks to an external site. .
Using this diagram as a reference, and any other information you can recall, what impact would reducing deforestation have on the carbon cycle?
It would increase the rate at which carbon dioxide is removed from the atmosphere
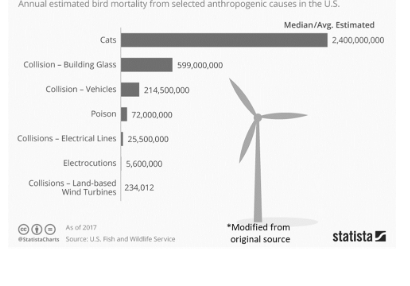
One reason people oppose large installations of wind turbines is that flying birds are killed by the spinning turbines. According to the data below, reducing which one of the causes would most limit annual anthropogenic bird mortality?
cats
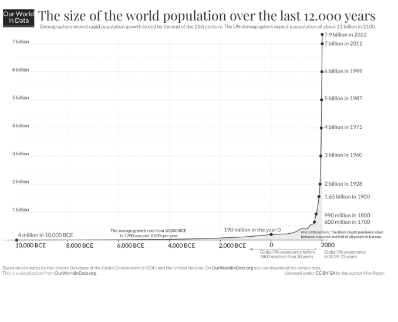
The figure below shows human population growth from about 102,000 years ago through the 21st century. The shape of the population growth curve since the industrial and agricultural revolutions has generally represented_____.
Exponential growth
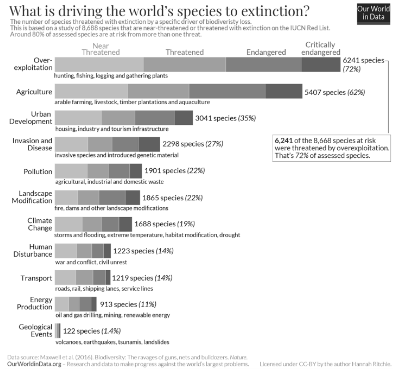
The infographic below shows human activities that account for biodiversity loss. Looking only at the total length of each bar, which sector would benefit biodiversity preservation the most if its environmental impacts were reduced.
Agriculture
A peer reviewed research paper is an example of a _____ reference.
primary

Using this figure match the letters to each term:
A - nucleus
B - neutrons
C - protons
D - electrons
Match each ecosystem service with the category in which it falls:
provisioning services - food fiber fuel
regulating services - air quality regulation, erosion regulation, pollination
cultural services - aesthetic value, social relations, spiritual value
supporting services - soil formation , photosynthesis, water cycling
Stage ________ is the preindustrial stage in which both birth rates and death rates are high. The high death rates are because of disease and potential food scarcity. A country in this stage of the demographic transition model does not have good health care; there may not be any hospitals or doctors.
I
The National Environmental Policy Act of _________ committed the United States to sustainability, declaring it a national policy “to create and maintain conditions under which humans and nature can exist in productive harmony, that permit fulfilling the social, economic and other requirements of present and future generations.”
1969
The U.S. Acid Rain Program is an example of which type of regulation?
cap and trade
Examples of _________________ include grants, low-interest loans, favorable tax treatment, and procurement mandates.
subsidies
The Resource Conservation and Recovery Act (RCRA) was passed in what year?
1976
For every _ pounds of municipal solid waste (MSW) in the United States, more than pounds can be burned as fuel to generate electricity.
100; 85
RCRA states that "solid waste" means any garbage or refuse, sludge from a wastewater treatment plant, water supply treatment plant, or air pollution control facility and other discarded material, resulting from industrial, commercial, mining, and agricultural operations, and from community activities.
true
What is the role of 'caprocks' in the formation of natural gas pockets?
they are dense enough to prevent the gas from escaping
The _________ of an energy source is defined as the amount of energy that can be obtained from 1 unit of the source (i.e. coal)
heating value
______ is a relatively clean gaseous biomass fuel source that burns fairly clean and efficiently. It can be generated by the anaerobic decomposition of most organic substances.
Methane
Windmills are most practical as energy sources for ___________ use as they don't generate a lot of electricity individually. However, large wind farms can power cities.
decentralized
In which forest biome is the canopy moderately dense and allows light to penetrate, resulting in well-developed and richly diversified understory vegetation and stratification of animals.
Temperate
According to the National Geographic article, by ___________ we’ll need to feed two billion more people.
2050
Biodiversity has also changed due to the Green revolution. Genetic diversity in crop plants ___________ due to coordinated international research efforts based on a small selection of high yielding varieties.
diminished
Select the 6 criteria pollutants regulated by the EPA. (select all that apply)
Carbon monoxide
Ground level ozone
Nitrogen dioxide
Sulfur dioxide
Lead
Airborne particulate matter
The 4 most abundant elements/molecules in Earth's atmosphere are, in order of descending abundance:
nitrogen, oxygen, argon, carbon dioxide
Evaporation
is the process by which water changes from a liquid to a gas or vapor
transpiration
is the process by which moisture is carried through plants from roots to small pores (stoma) on the underside of leaves, where it changes to a vapor and is released to the atmosphere
Condensation
is the process by which water vapor is converted from gaseous state back into liquid state
Precipitation
is water falling from clouds in the atmosphere in form of ice
surface runoff
is the portion of precipitation that travels over the soil surface to the nearest stream channel
Stream flow
is the movement of water in a natural channel, such as a river
Infiltration
is the process by which water enters the subsurface by gravitation pull. some of the water infiltrates into the ground and replenishes aquifer
When forests burn, what does that mean for the carbon cycle?
It releases large amounts of CO2 in to the atmosphere
What does deforestation do to the carbon cycle? (select 2)
releasing the carbon stored in the trees back to the atmosphere
reduces the rate at which CO2 is removed from the atmosphere
How does carbon move from producers to secondary consumers?
Primary consumers eat the producers and are eaten by the secondary consumers
The Earth's climate has been __________ since the end of the last major ice age.
fairly stable
The strength or occurrence of any given extreme event can be directly tied to climate change with 100% certainty, ever since 1995.
False
Since the early 1900's, the global climate has risen in temperature by about ____C, several years earlier than originally predicted
1
Where would you find the HIGHEST concentration of coral reefs?
tropical marine areas
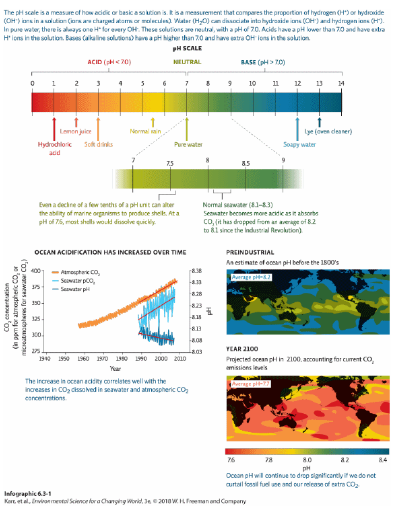
Refer to the graph depicting ocean acidification over time in Infographic 1. Which statement is TRUE of the graph?
As the atmospheric concentration of CO2 increases, the amount of CO2 absorbed by the oceans (pCO2) also increases.
The lowering of the pH of the oceans is known as:
acidification
One of the major water-related regulations in the US is the Clean Water Act (CWA) of what year? _________.
1972
water table
The top of the saturated portion of an aquifer. It is also the boundary between the saturated and unsaturated zones.
aquifer
rock formations or sediments that store (and yield) large amounts of usable water in their pore space
porosity
is the percentage of open space in a rock or sediment body
permeability
is the ability of subsurface material to transmit fluids
saturated zone
a rock body where all pores are filled with water
unsaturated zone
water from here is NOT called groundwater, it is called soil moisture