Microeconomics: Demand, Supply, and Market Equilibrium Analysis
1/142
There's no tags or description
Looks like no tags are added yet.
Name | Mastery | Learn | Test | Matching | Spaced |
|---|
No study sessions yet.
143 Terms
Market
is any place where sellers of particular goods or services can meet with buyers of those goods and services. It creates the potential for a transaction to take place.
Demand
It is the relationship between price and quantity demanded.
Needs
are things that we must have for us to live like food, clothing, or shelter.
Wants
are things that will give us a state of ease and contentment.
Law of Demand
All other things remained constant, (Ceteris paribus), price and quantity demanded are inversely proportional.
Change in Demand
Refers to the shifting of the whole demand curve. This is due to factors other than the price of the product.
Change in Quantity Demanded
Represents the amount of an economic good or service desired by consumers at a fixed price.
Surplus
Occurs when the quantity supplied exceeds the quantity demanded at a given price.
Shortage
Occurs when the quantity demanded exceeds the quantity supplied at a given price.
Equilibrium
The point at which the quantity demanded equals the quantity supplied.
Ceteris Paribus
A Latin phrase meaning 'all other things being equal' used in economic analysis.
Consumer Behavior
Demand is generally affected by the behavior of consumers.
Producer Behavior
Supply is usually affected by the conduct of producers.
Price Control
Government interventions that set price limits on goods and services.
Income Effect
The change in quantity demanded resulting from a change in consumer income.
Substitution Effect
The change in quantity demanded due to a change in the price of a related good.
Factors Affecting Demand
Include consumers' income, taste and preferences, price of related products, and number of consumers.
Profit Maximizers
Producers who aim to achieve the highest possible profit.
Cost Minimizers
Consumers who aim to spend the least amount of money.
Inverse Relationship
The law of demand states that when prices increase, quantity demand will decrease.
Desire to Possess
One of the three components of demand, indicating a consumer's interest in a good or service.
Ability to Pay
One of the three components of demand, indicating a consumer's financial capacity to purchase.
Willingness to Utilize
One of the three components of demand, indicating a consumer's readiness to use a good or service.
Demand Curve Shift
The change in demand or shifting of the whole demand curve either to the left or to the right depending on changes in the factor(s) that caused the shift.
Quantity Demanded
Refers to the movement or change in quantity demanded within the same demand curve, caused by the change in product's price.
Demand Schedule
A tabular presentation showing the price and quantity demanded for a particular good, indicating different quantities that will be bought by buyers at each of the given prices.
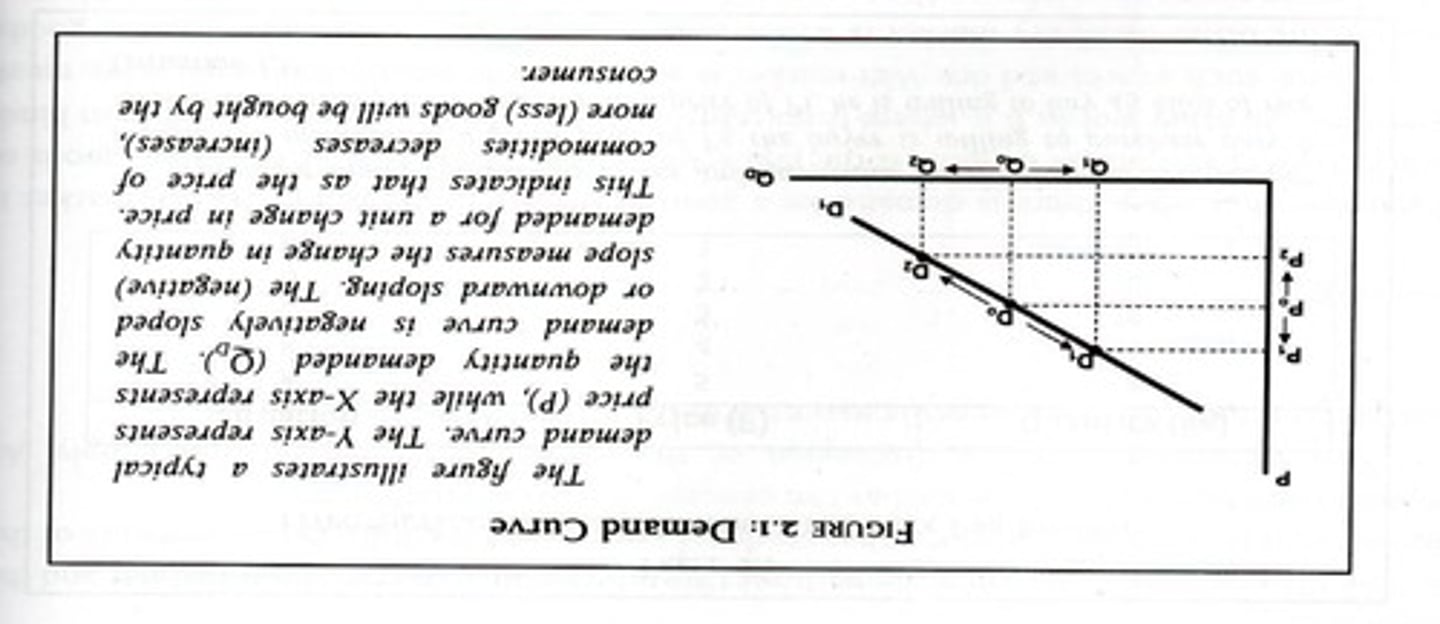
Demand Curve
A graphical representation of the law of demand that plots prices on a chart, showing that as prices decrease, demand increases.
Demand Function
Represents the relationship between the quantity demanded for a commodity (dependent variable) and the price of the commodity (independent variable).
Demand Function Formula
Mathematically represented as Qd = a - bPx, where Qd is quantity demanded, a is the intercept of the demand curve, b is the slope of the demand curve, and Px is the price of the goods.
Intercept of the Demand Curve
The value 'a' in the demand function formula, representing the quantity demanded when the price is zero.
Slope of the Demand Curve
The value 'b' in the demand function formula, indicating the rate at which quantity demanded changes with price.
Shift of the Demand Curve
Occurs when non-price factors change, resulting in a new demand curve.
Non-Price Factors
Factors that can cause a shift in the demand curve, including population, income, taste and preference, expectation, and related products.
Population
The number of buyers in the market; an increase in population leads to an increase in demand.
Income
A non-price factor that affects demand; as consumer income increases, demand for goods may increase.
Taste and Preference
Consumer preferences that can shift demand; changes in taste can increase or decrease demand for certain products.
Expectation
Consumer expectations about future prices or availability that can influence current demand.
Related Product
The price or availability of related goods (substitutes or complements) that can affect the demand for a product.
Example of Demand Schedule
At a price of P5.00, the buyer is willing to purchase 8 kilos of rice; at a price of P1.00, he is willing to buy 45 kilos.
Graphical Representation of Demand Curve
Typically starts high on the vertical axis and descends to the right, indicating that as prices decrease, demand increases.
Demand Analysis
The study of how various factors affect the quantity demanded of goods and services.
Movement along Demand Curve
Occurs when the price of a good changes, leading to a change in quantity demanded without shifting the entire curve.
Example of Demand Function Calculation
If Qd = 3 - 0.25(5), then Qd = 1.75 units of good A.
Forces that Cause Demand Curve to Change
Include changes brought by price factors and non-price factors.
Price Factor
A factor that causes movement along the demand curve due to changes in the price of the good.
Non-Price Factor
A factor that causes a shift in the demand curve, independent of the price of the good.
Demand Relationship
The relationship between price and quantity demanded by all consumers in the market.
Disposable income
It is part of income used by an individual to purchase the goods and services the individual or household needs.
Non-disposable income
It is part of income that is not used by households or individuals for their consumption, saved for future purposes.
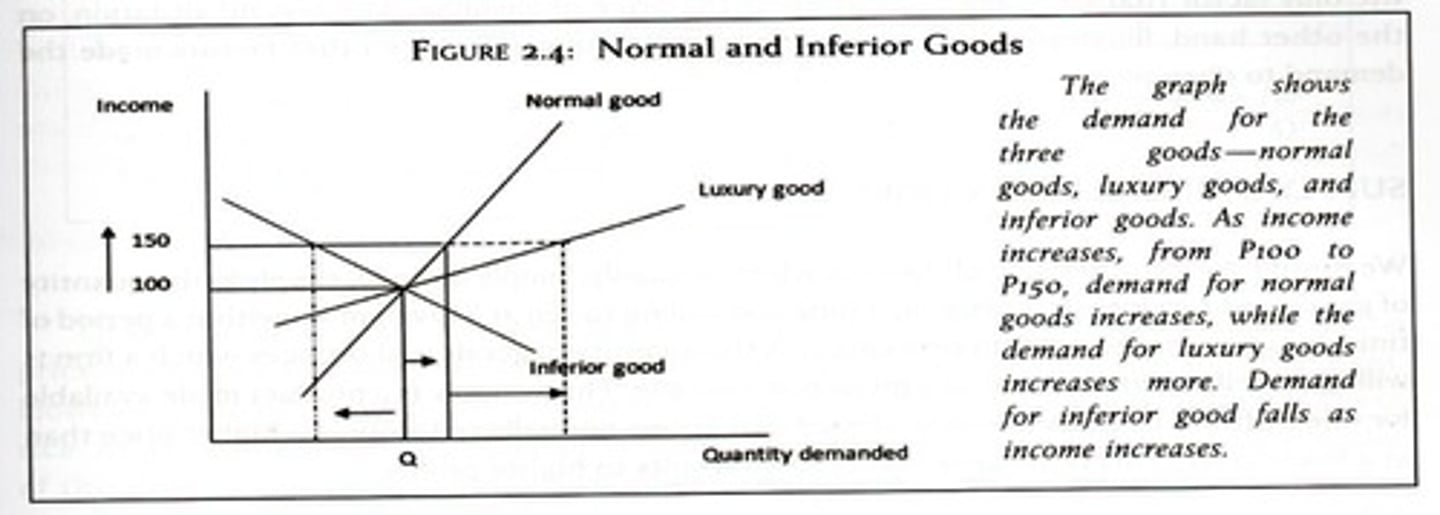
Normal goods
Consumer products such as food and clothing that exhibit a direct relationship between demand and income.
Inferior goods
Goods whose demand drops as consumers' incomes rise; the term 'inferior' refers to affordability, not quality.
Public transportation
An example of an inferior good, as its demand falls as income rises.
Taste and Preference of Consumer
The behavior of consumers affected by weather, perception, information, and occasion.
Expectations of the Consumer
If people expect the price of goods to increase, they will want to buy it more at present before the price increases.
Occasional or Seasonal Products
Various events or seasons in a given year result in a movement of the demand curve with reference to particular goods.
Substitute goods
Two alternative goods that could be used for the same purpose, satisfying the same needs and wants.
Case No. 2.2
When the late 1990s came, most of the government agencies and some of the private companies took into consideration advanced studies as one of the requirements to promote an employee.
Case No. 2.3
Joseph, a carpenter earns Php 3,000.00 a month. After his promotion, his income increased to Php 5,000.00.
Normal good for Joseph
Rice is a normal good for Joseph, as his consumption increased with his income.
Inferior goods for Joseph
Sardines are inferior goods to Joseph, as his consumption decreased with his income.
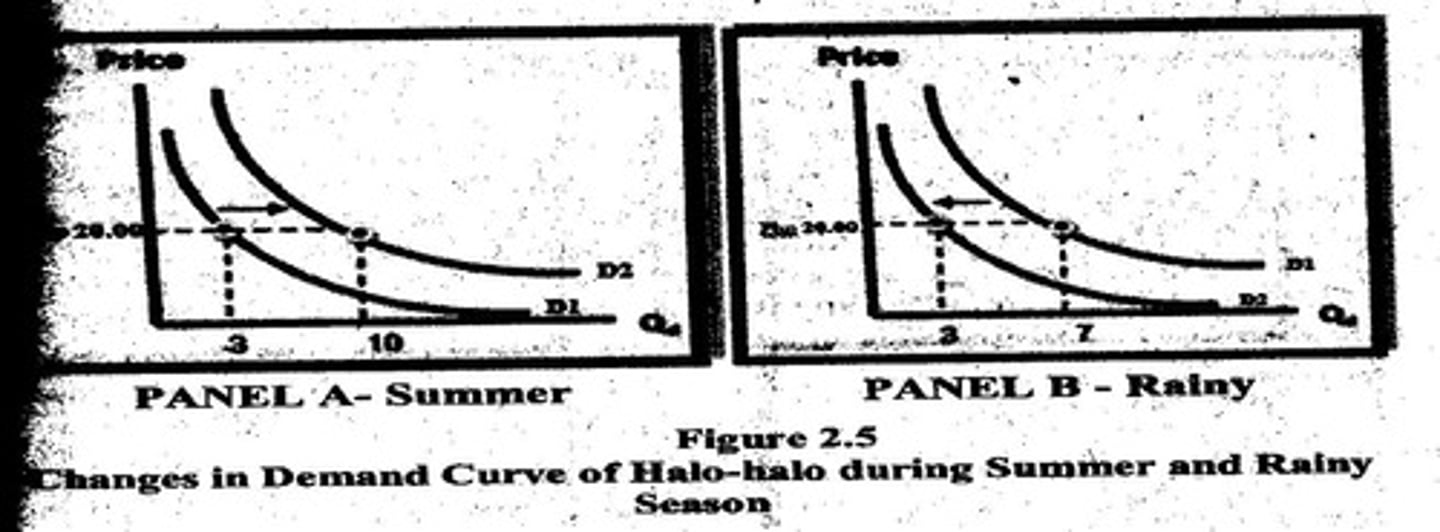
Demand for halo-halo
In summer, demand for halo-halo increases, while during the rainy season, demand decreases.
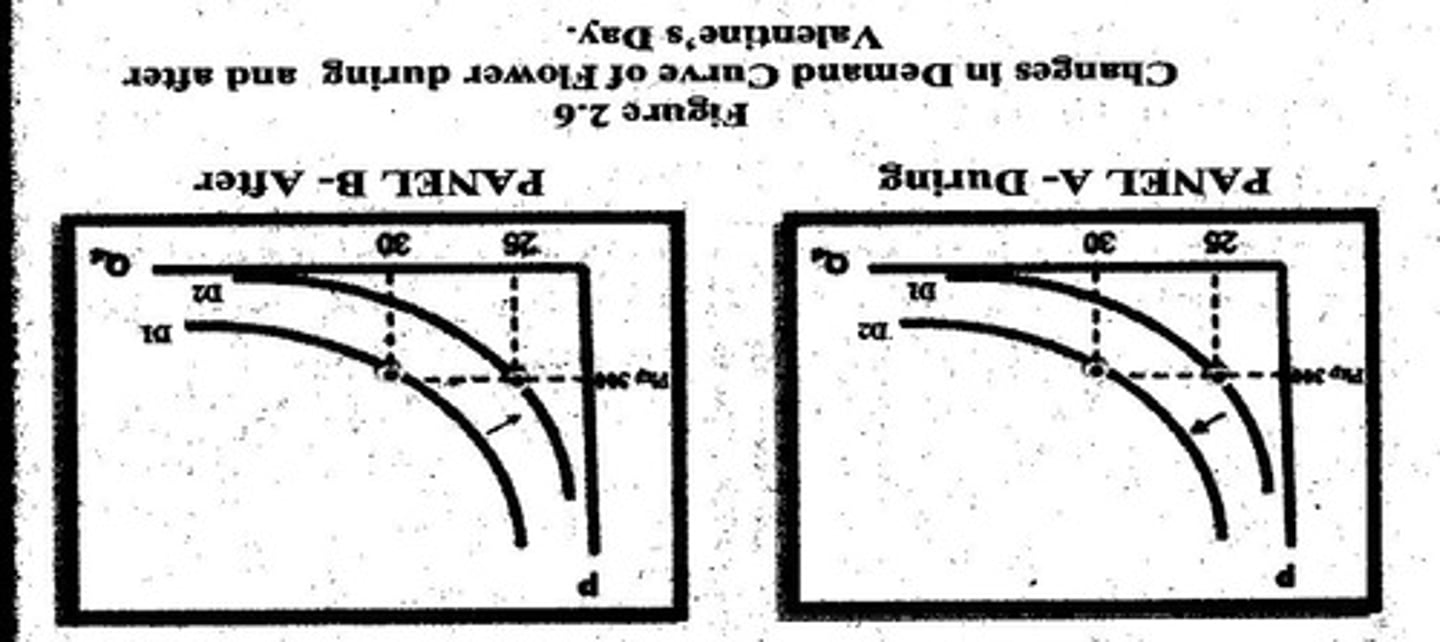
Demand for flowers on Valentine's Day
The demand for flowers increases during Valentine's Day and decreases after.
Demand for Christmas decorations
During the Christmas season, demand for Christmas Trees, parols, and other decorations increases.
Price of Related Commodity
One of the non-price factors that affect the demand curve.
Example of normal goods
Examples include food, clothing, and household appliances.
Example of inferior goods
Public transportation tends to have an income elasticity of demand coefficient that is less than zero.
Changes in disposable income
They affect the current demand, and if overall income increases, disposable income is likely to also increase.
Income elasticity of demand
A measure of how much the quantity demanded of a good responds to a change in consumers' income.
Complement goods
Products that are bought and used together, like shoes and socks.
Luxury goods
Items with an income elasticity of demand greater than one, including expensive cars and vacations.
Expectations of Future Prices
Anticipations about future price changes that can influence current demand.
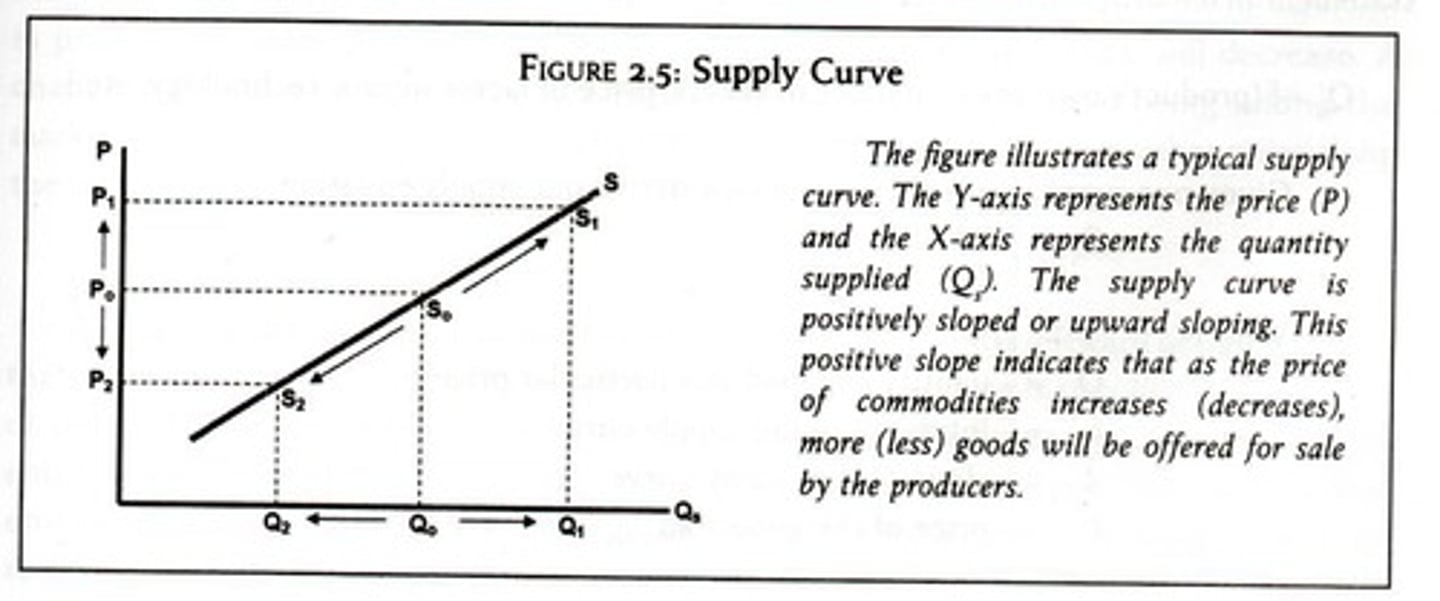
Supply
The relationship between price and quantity supplied, indicating how much sellers are willing to sell.
Law of Supply
States that price and quantity supplied are directly proportional, all other things being equal.
Supply Schedule
A tabular format listing changes in the number of goods offered for sale at varying price levels.
Supply Curve
A graphical representation of the relationship between quantity supplied and price.
Supply Function
A mathematical formula depicting the relationship between quantity supplied and price.
Cross-price elasticity of demand
A measure of how the quantity demanded of one good responds to a change in the price of another good.
Switching costs
Costs incurred by consumers when changing from one brand to another.
Consumer/brand loyalty
The tendency of consumers to continue buying the same brand due to preference.
Hypothetical Supply Schedule for Rice
A table showing the quantity of rice supplied at different price levels.
Quantity Supplied
The amount of a good that sellers are willing to sell at a given price.
Price Levels
The various prices at which goods are offered for sale.
Upward-sloping supply curve
Indicates that as the price of a good increases, producers are willing to supply more.
Mathematical function
A symbolic representation of the relationship between dependent and independent variables.
Quantity supplied of commodity X
Represented as Qs, which depends on its price Px.
Situation A in Supply Schedule
At a price of P5.00, the seller is willing to sell 48 kilograms of rice.
Situation E in Supply Schedule
At a price of P1.00, the seller is willing to sell 5 kilograms of rice.
Qs
quantity supplied at a particular price
a
intercept of the supply curve
b
slope of the supply curve
P
price of the goods sold
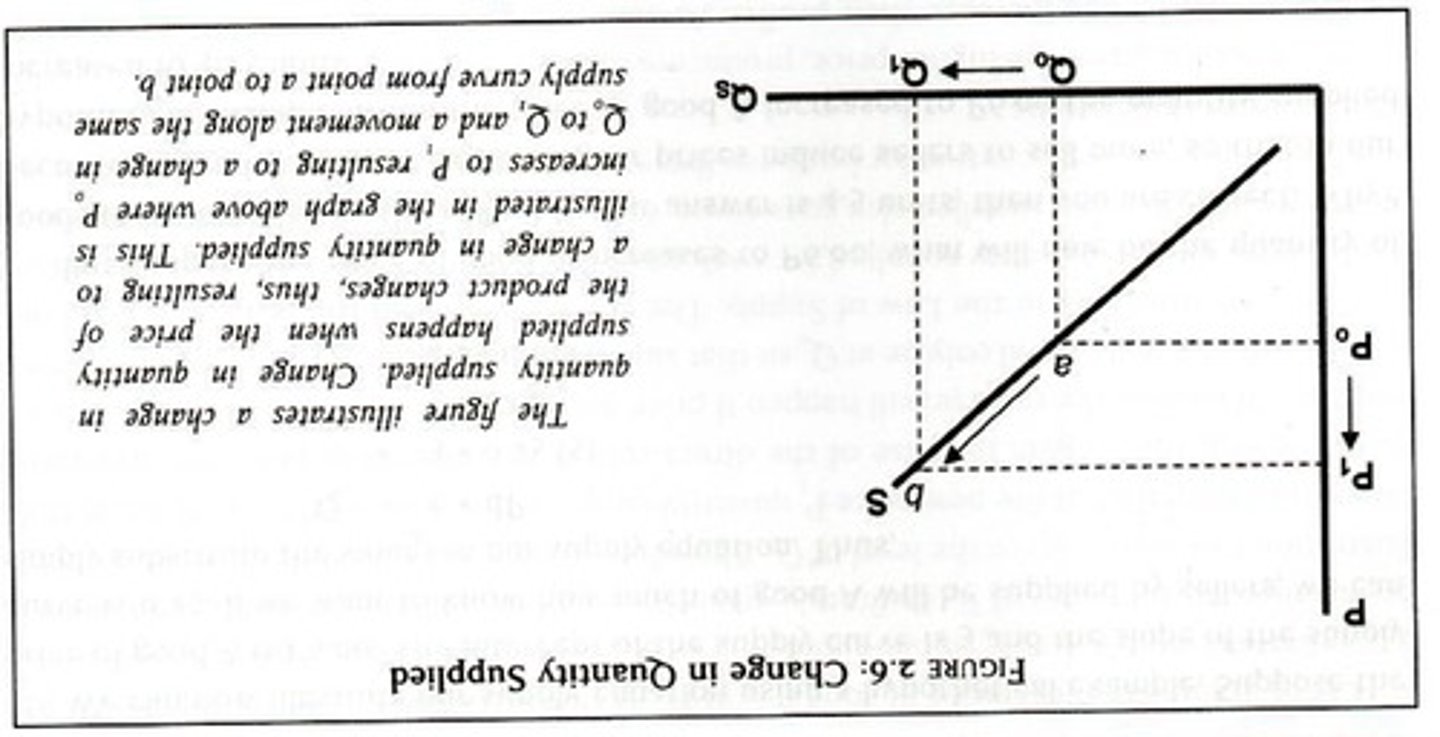
Change in Quantity Supplied
A movement from one point to another point along the same supply curve due to an increase or decrease in the product's own price.
Change in Supply
When the entire supply curve shifts leftward or rightward, affecting the amount of a good or service supplied at the same price.
Determinants of Supply
Factors that influence the supply of a product or service.
Firm Goals
Objectives of an organization that affect the supply of merchandise, such as sales maximization, employment maximization, and profit maximization.
Cost of Inputs or Factors
The costs associated with production factors like land, labor, capital, and entrepreneurship that determine the supply of products.
Technology
The use of new innovations that save resources and reduce production costs, leading to increased supply.
Government Policy
Taxation, subsidies, and policies that influence the supply of goods.
Expectations
Producers' anticipation of future price changes that affect their current supply decisions.
Costs of other Commodities
The impact of the prices of related products on the supply of goods.