Econs definitions + formulas
 Call Kai
 Learn
Learn Practice Test
 Spaced Repetition
 Match
Match Flashcards
 Knowt Play
1/63

There's no tags or description
Looks like no tags are added yet.
Name | Mastery | Learn | Test | Matching | Spaced | Call with Kai | Chat |
|---|
No analytics yet
Send a link to your students to track their progress
64 Terms
Real GDP per capita formula
real gdp/population
GNI formula
GDP + net income abroad (from abroad - sent abroad)
price deflator
100+ inflation rate
price deflator formula
nominal GDP / Real GDP x100%
real GDP formula
nominal/price deflator x100%
to calculate inflation rate
new-old / old X 100%
unemployment rate formula
number of unemployed/no.of people in workforce X 100%
economic growth rate formula
Real GDP in years-real GDP in years-1 /Real GDP in years-1
national income = national output = national expenditure / formula for national income
add up all income earned from production (do not double count)
either count final good
or value added at each stage
national expenditure approach
consumption + investment + govt spending + (export-import)
national output approach
calculate all value added, dont double count
aggregate supply
refers to the total amount of goods and services all industries in the economy are willing and able to produce at every given price level
SRAS
refers to the period of time when price of resources remain inflexible or roughly constant
SRAS curve
curve that shows the total amount of goods and services firms are prepared to produce in the short run at every given price level
Long run aggregate supply curve
curve that shows the total amount of goods and services firms are prepared to produce in the long run at every given rice level
LRAS
refers to the period of time , when price of resources , including labour , are flexible and changes along with price
aggregate demand
total spending on domestically produced goods and services in an economy, at various price levels, in a period of time purchased by firms , government , households and trade sectors
consumption
spending by households on goods and services
wealth
stock concepts , refers to value of a persons assets at a certain period of time
income
the recipe of money per period of time
transfer payment
money transferred from one party to another without any production taking place
components of AD
consumption + investment + government expenditure +(export-import)
disposable income
household income after tax deductions
investment
the addition of capital stocks in an economy
export
domestic goods and services purchased by foreigners
export revenue
spending on domestic goods and services by foreigners
import
goods and services purchased from foreign sectors
import revenue
spending on gods and services form foreign sectors by domestic residents
full employment level of output / unemployment at natural rate
maximum output that can be produced and sustained in the long run if all available resources in the economy have been fully and efficiently utilised
economic growth
refers to an increase in real GDP over a period of time, typically in a year
standard of living
refers to the level of income , wealth and consumption of goods and services, including healthcare
economic growth rate
percentage change in real GDP
short term/actual growth
refers to an increase in real output caused by increased employment and efficiency of existing factors of production
long term growth
refers to an increase in real output caused by an increase in potential output
who is considered in labour force
unemployed / actively seeking for a job+ employed
not everyone
unemployment
refers to the people who are part of the labour force but are currently without a job and active looking for one
underemployment
refers to people of working age with part time jobs when they would rather work full time or with jobs that make full use of their skills and education
cyclical unemployment (not at Yf)
occurs during downturns of the business cycle , when the economy is in a deflationary gap
frictional unemployment
occurs when people are in between jobs
structural unemployment
occurs as a result of the changing structure of an economy
seasonal unemployment
natural in many economies for some workers to be employed on a seasonal basis (ski resorts) —> after winter demand for workers fall
national income statistics
indicators that measure the level of economic activity in a given period of time
GDP
the total market value of final goods and service spruced within an economy ,in a given year, regardless of who owns the FOP
real GDP
measures value of current output at a constant price
adjusted for inflation / nominal GDP adjusted for inflation
GNI
the total income earned by a country’s businesses and residents , in a given year, regardless of of where their assets are located
Real GNI/ Nominal GNI
GNI adjusted for inflation
nominal : GNI not adjusted for inflation
Happiness index
incudes GDP per capita , social support , healthy life expectancy
indication of happiness / ranks countries by happiness level
OECD better life index
measures quality of life
happy plant index
measures sustainable well being for all
composite indicators
measures multidimensional concepts that cant be captured using a singular indicator
standard of living
refers to the level of well being of an individual o a household within a country
material SOL
refers to the quantity of goods and services available to an individual in a particular year, measured by real GDP per capita
purchasing power parity
total amount of a countries currency that can purchase the same quantity of local goods and services that can be bought with USD1
real GDP per capita adjusted to PPP : across space measuring SOL
PPP exchange rate
an exchange rate between currencies that can make their buying power equal to the buying power of USD1
circular flow of income
a model that shows the flow of income in an economy between different economic agents
injections
inflow of income into the economy
investment, government expenditure , exports
leakages
outflow of income from the economy
taxes, imports , savings
circular flow of income diagram
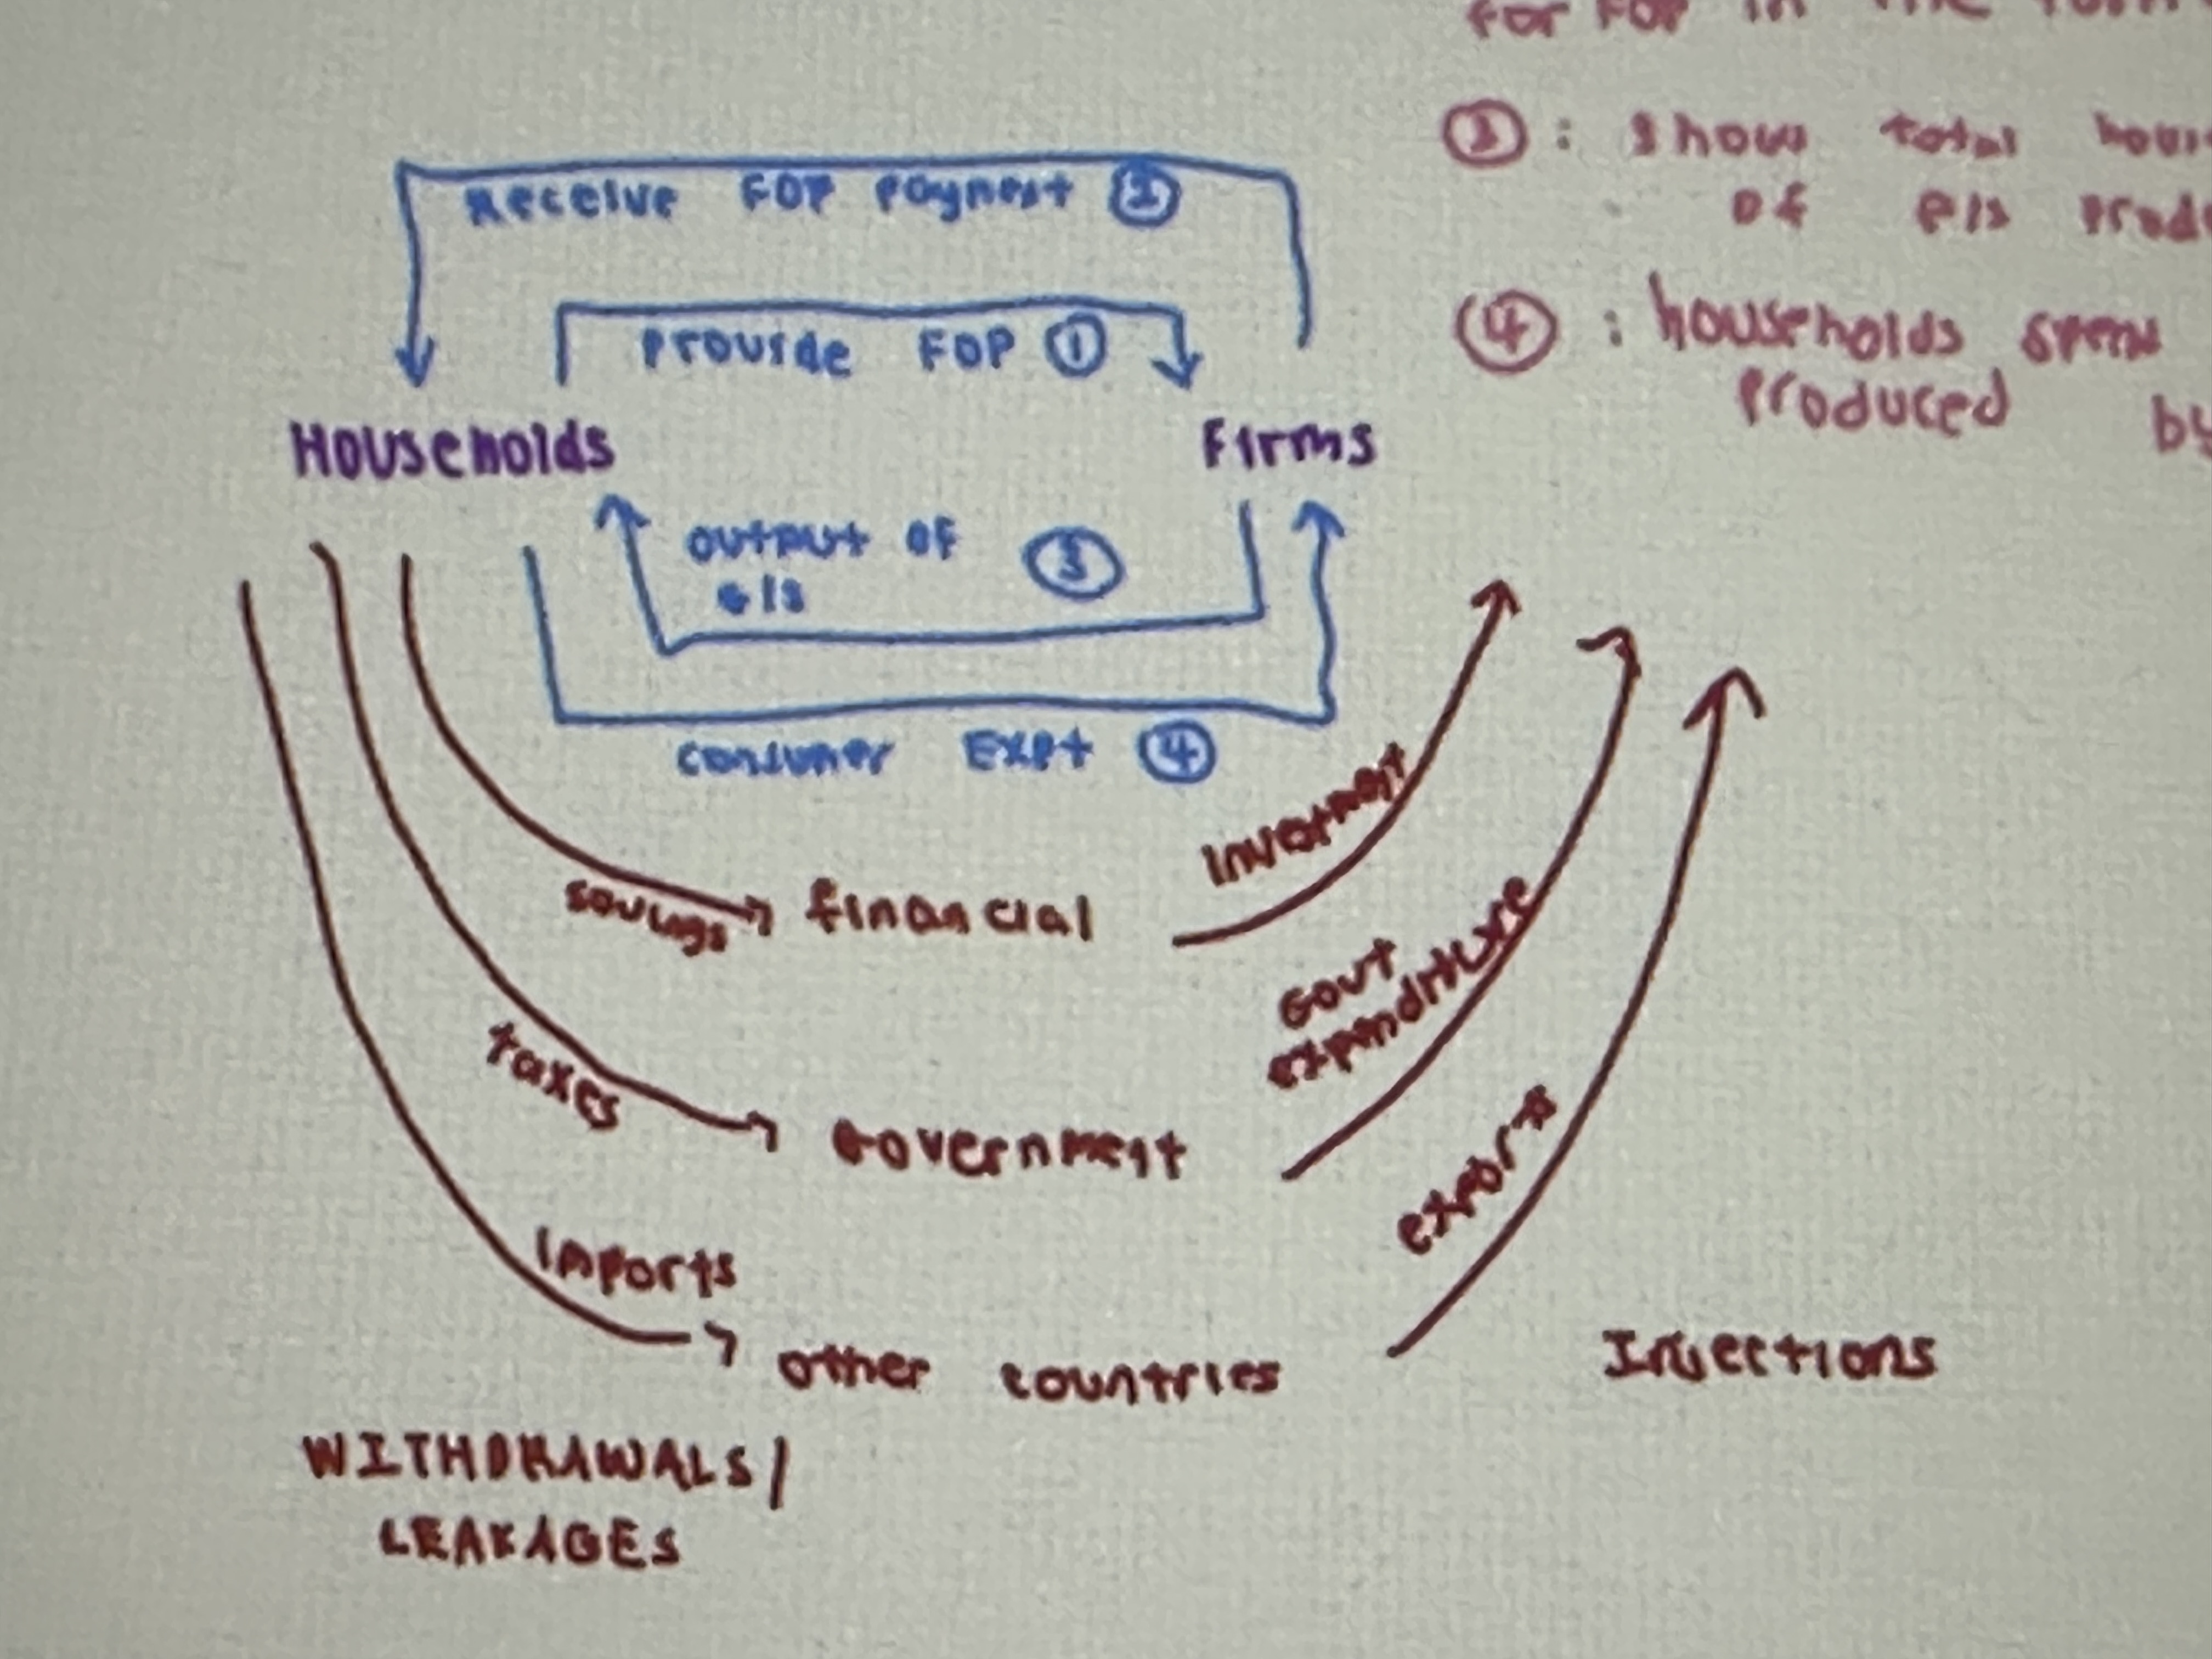
what happens when L>I
circular flow of income contracts
total expenditure in the economy decreases (because there are lesser goods and services being purchased)
total output decreases (lower prices + cut down on production by firms)
demand lesser FOP + unemployment increase
household income decrease
induces second round
deflationary gap
exists when the real national output equilibrium is below the full employment level of output . Actual economic growth rate is below the average trend of growth
inflationary gap
exists if actual national output exceeds full employment level of output. Actual GDP exceeds potential GDP
supply shocks
factors that affect COP
demand pull inflation
sustained increase in APL due to an increase in AD
cost push inflation
sustained increase in APL due to an increase in COP or supply side shocks