STP 420 Midterm 1
1/24
Earn XP
Description and Tags
Formulas/ Notes for STP 420
Name | Mastery | Learn | Test | Matching | Spaced |
|---|
No study sessions yet.
25 Terms
It contains the following values when looking at data:
1. Minimum
2. Quartile 1
3. Quartile 2
4. Quartile 3
5. Maximum
What is the 5 number summary? What does it contain
Quartile 3 - Quartile 1
How do you get the Interquartile range?
Lower Limit = Quartile 1 - 1.5 ( IQR)
Upper Limit = Quartile 3 + 1.5 (IQR)
How do you determine if something is an outlier?
If it’s odd, find the middle value. If its even, find the two values in the middle, add them up, divide them by 2.
How do you find median?
Count up all the values in the dataset and divide it by the amount of data there is.
How do you find mean?
Maximum - Minimum
How do you find mode?
A variable that records the amount of something
What is a quantitive variable
Height
Which of the following is an example of a quantitive variable
A variable that records which of several
categories a person or thing is in.
What is a categorical variable?
Hair color
Which of the following is an example of a categorical variable?
A variable with a finite number of possible values
What is discrete variable
A variable with an infinite number of possible
values
What is a continuous variable
A distribution with one peak
Unimodal distribution
A distribution with two peaks
Bimodal distribution
A distribution with two or more peaks
Multimodal distribution:
A distribution that has a longer left tail
Left skewed distribution
A distribution that has a longer right tail
Right skewed distribution
Standard Deviation
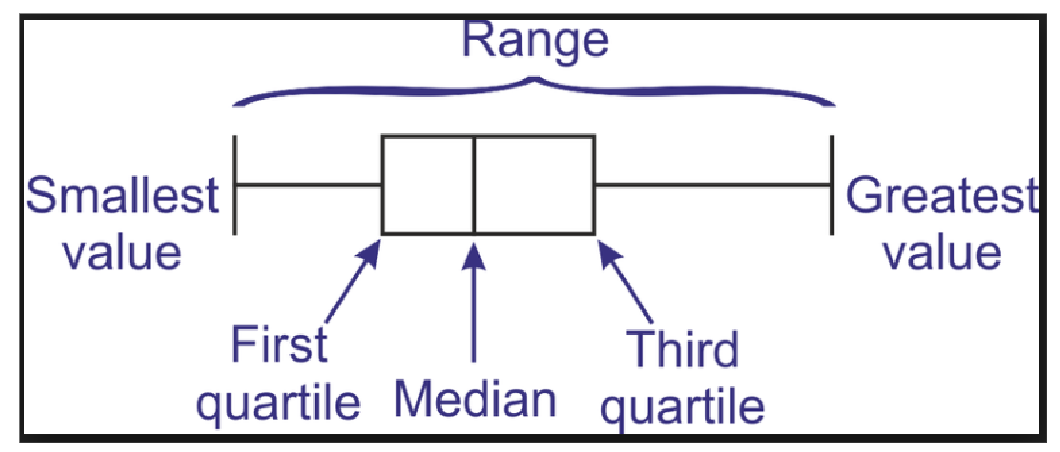
Boxplot graph
Always ON or ABOVE the HORIZONTAL LINE
Total area under the density curve is always equal to 1
Facts about the density curve
Something to help us understand how many standard deviations are above/below the mean at a particular value
Z-score
Z = X-Mean/Standard deviation
What is the Z-Score formula
Z scores have a mean of 0 and a standard deviation of 1
They have a typical range of -3 to 3
What are some facts about the Z-score
It needs to have a value with the frequency of 2 (appears twice).
What is required for something to have mode?
It has the mean and median of equal value. However that doesn’t mean that the mean and median can represent a symmetrical distribution if we didn’t have a graph.
What is true about the symmetric distribution