AP MACRO UNIT 2
0.0(0)
Card Sorting
1/32
Earn XP
Description and Tags
Last updated 3:05 AM on 9/27/22
Name | Mastery | Learn | Test | Matching | Spaced | Call with Kai |
|---|
No analytics yet
Send a link to your students to track their progress
33 Terms
1
New cards
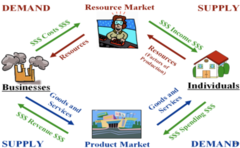
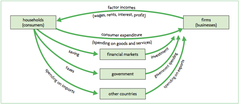
Circular Flow
the pattern in which goods, services and resources flow in the marketplace
2
New cards
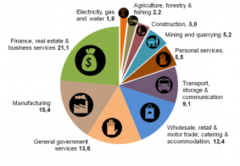
GDP
the total market value of all final NEW goods and services produced annually in an economy
3
New cards
Nominal GDP
GDP measured in current prices

4
New cards
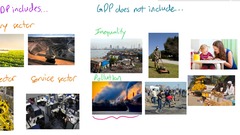
Limitations of GDP
- Nonmarket Activities
- Underground Economy
- Negative externalities
- Quality of life
- Underground Economy
- Negative externalities
- Quality of life
5
New cards
Labor Force
the total number of workers, including both the employed and the unemployed

6
New cards
Unemployment Rate
the percentage of the labor force that is unemployed

7
New cards
Labor Force Participation Rate
the percentage of the adult population that is in the labor force

8
New cards
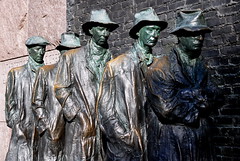
Types of Unemployment
frictional
structural
cyclical
structural
cyclical
9
New cards
Frictional Unemployment
*A type of unemployment caused by workers voluntarily changing jobs and temporary layoffs
*unemployed workers between jobs.
*unemployed workers between jobs.

10
New cards
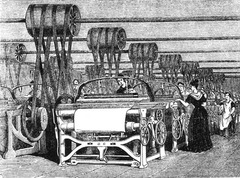
Structural Unemployment
*unemployment resulting from industrial reorganization, *typically caused by technological change
11
New cards
limitations of unemployment rate
does not give a good indication of how many people are discouraged(not looking for work) or underemployed.

12
New cards
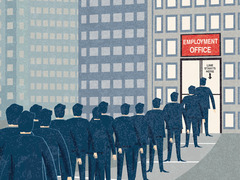
Natural Rate of Unemployment
frictional plus structural unemployment
*typically 5- 7%
*typically 5- 7%
13
New cards
Calculate Unemployment Rate
unemployed/labor force x 100

14
New cards
Calculate Labor Force
employed + unemployed

15
New cards
Calculate Labor Force Participation Rate
labor force/adult population x 100

16
New cards
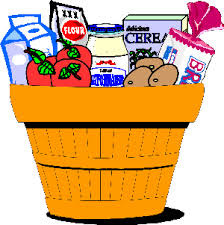
CPI (Consumer Price Index)
a measure of the overall cost of the goods and services bought by a typical consumer
17
New cards
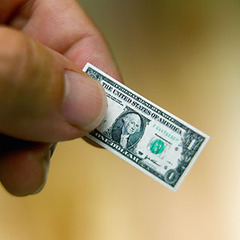
Inflation
A general increase in prices
18
New cards
Deflation
A situation in which prices are declining

19
New cards
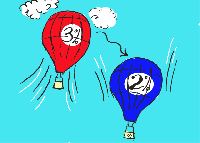
Disinflation
a reduction in the rate of inflation
20
New cards
Real Variables
variables measured in physical units

21
New cards
Calculate Inflation Rate
CPI this year - CPI last year / CPI last year x 100

22
New cards
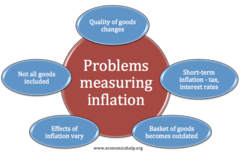
Limitations of CPI as a measure of inflation
*Does not factor in change in quality or substitutes
23
New cards
Calculate CPI
(cost of basket in current year/cost of basket in base year) x 100

24
New cards
Real GDP formula
Nominal GDP/GDP Deflator x 100

25
New cards
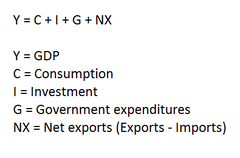
GDP formula
C+I+G+(X-M)
26
New cards
GDP deflator formula
Nominal GDP/Real GDP x 100

27
New cards
Not included in GDP
1. Intermediate goods
2. Household production
3. Non-market (illegal) activities
4. Used goods and services
2. Household production
3. Non-market (illegal) activities
4. Used goods and services
28
New cards
Real GDP per capita
real GDP divided by the total population

29
New cards
circular flow leakages
1)Savings
2)Imports
2)Imports
30
New cards
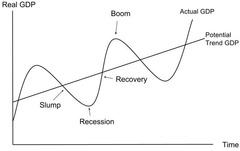
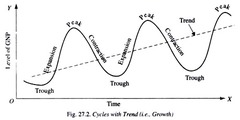
Phases of the business cycle
expansion-> peak-> contraction-> trough->recovery
31
New cards
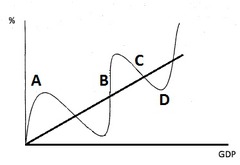
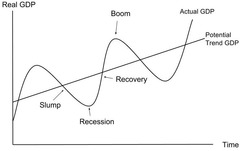
Business Cycle Graph
a period of macroeconomic expansion followed by a period of contraction
32
New cards
recessionary gap
when aggregate output is below potential output
33
New cards
inflationary gap
when aggregate output is above potential output
