Lecture 8: Analysis of Variance ANOVA, Part 2
 Call Kai
 Learn
Learn Practice Test
 Spaced Repetition
 Match
Match Flashcards
 Knowt Play
1/25

Earn XP
Description and Tags
Alternative forms of ANOVA (for repeated measures)
Name | Mastery | Learn | Test | Matching | Spaced | Call with Kai | Chat |
|---|
No analytics yet
Send a link to your students to track their progress
26 Terms
Purpose of using ANOVA
for repeated measures designs
A variable is measured repeatedly
e.g. drug 1, drug 2, drug 3, and placebo
Need three or more points of measures
Otherwise use related samples t-test
RM measures and RM ANOVA
sometimes the way how you measure sometimes is more difficult to make causal inference (e.g. age and problem solving ability)
age and problem solving ability is a non-experimental design
RM-ANOVA vs IM-ANOVA
for RM-ANOVA
same hypothesis as IM-ANOVA
Means of the population means are identical
H1 is there is at least one difference
Then use post-hoc like in IM-ANOVA
similar but not identical assumptions (not tested)
equality of variance
observations are not independent (compared to IM)
Similar F-ratio but slightly difference

Issue with IM-ANOVA that RM-ANOVA can solve
individual differences between subjects is alway an issue for both parts of the fraction in the F-ratio
RM-ANOVA focuses on testing the same individual, therefore there is less of in issue within-treatments
RM-ANOVA
who si participating
the same individual is participating in all conditions
- the random, unsystematic error attributed to individual difference is mostly eliminated from the numerator and remove it from the deominator
What variable for RM-ANOVA help control?
confounding variables (e.g. weird scores)
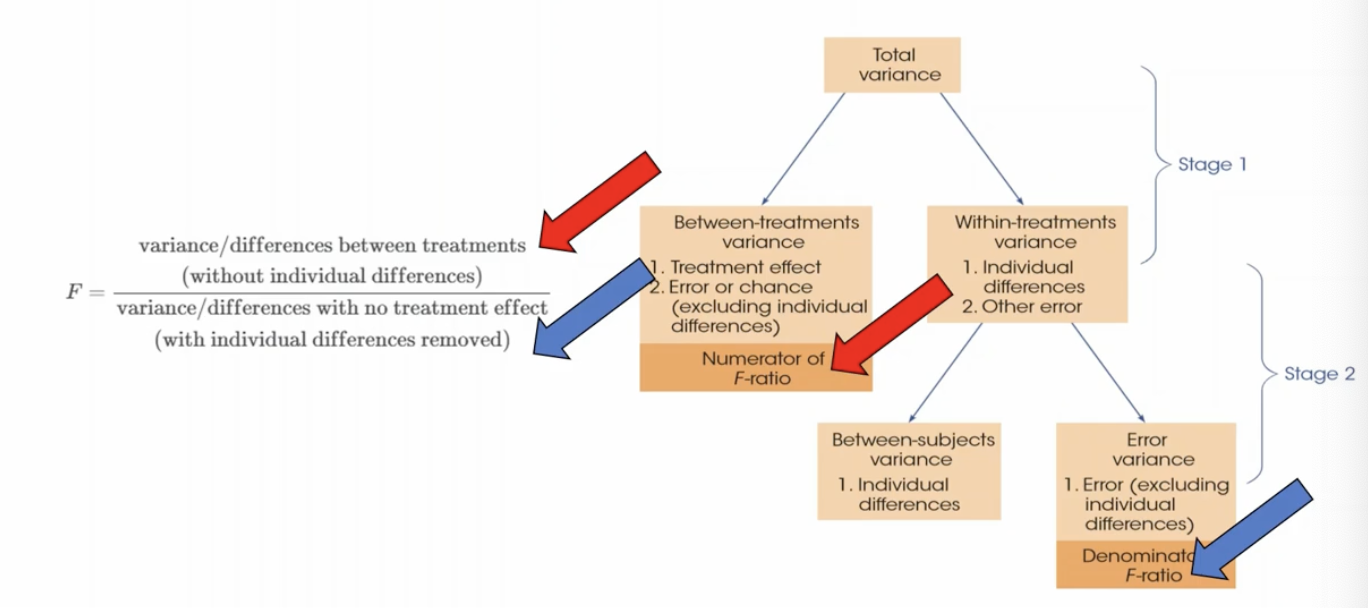
F-ratio for RM-ANOVA: 2 stage process
numerator calculations similar
more work for the denominator
RM-ANOVA notation
k
n
N
T
G
P
k = number of groups
n = size of a particular samples
N is all observations (because there is not more people, just repeated tests for the same participants)
T = sum of all scores in a single condition
G = sum of all scores in all conditions
P = sum of scores for each participant
Stage 1 of RM-ANOVA
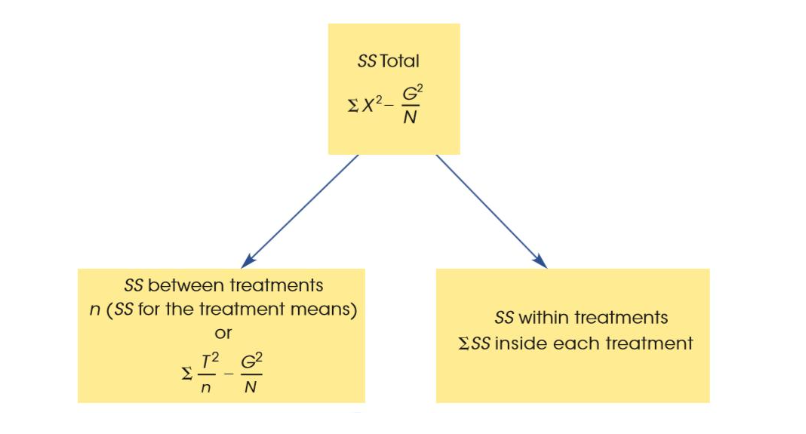
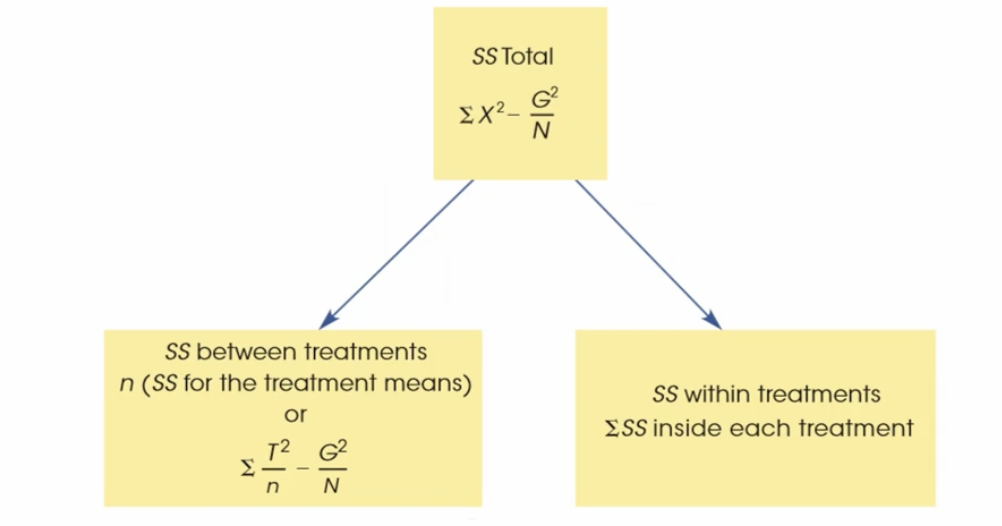
SStotal = sum X² - G2 / N
df total = N – 1
Numerator
SSbetween treatments = sum (T² / n) - (G² / N)
dfbetween treatments = k − 1
thats it for the numerator
Denominator
SSwithin treatments = sum SS inside each treatment
dfwithin treatments = sum df inside each treatment
Stage 2 of RM-ANOVA
assume SS within = SS between + SS error
SSbetween-subjects = sum (P2/k) – G2/N
solve for SS error
Assume df error = (n-1)(k-1)
dfbetween-subjects = n – 1
Because RM-ANOVA does not have individual differences, between subjects has been removes, and we use SS error and df error for the no treatment effect calculate or MS
F critical value and F ditribution
F critical value requires the a value, the df error and the df between treatments
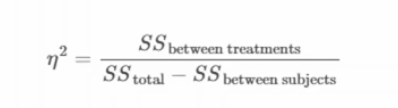
Effect size calculations
partial N² =
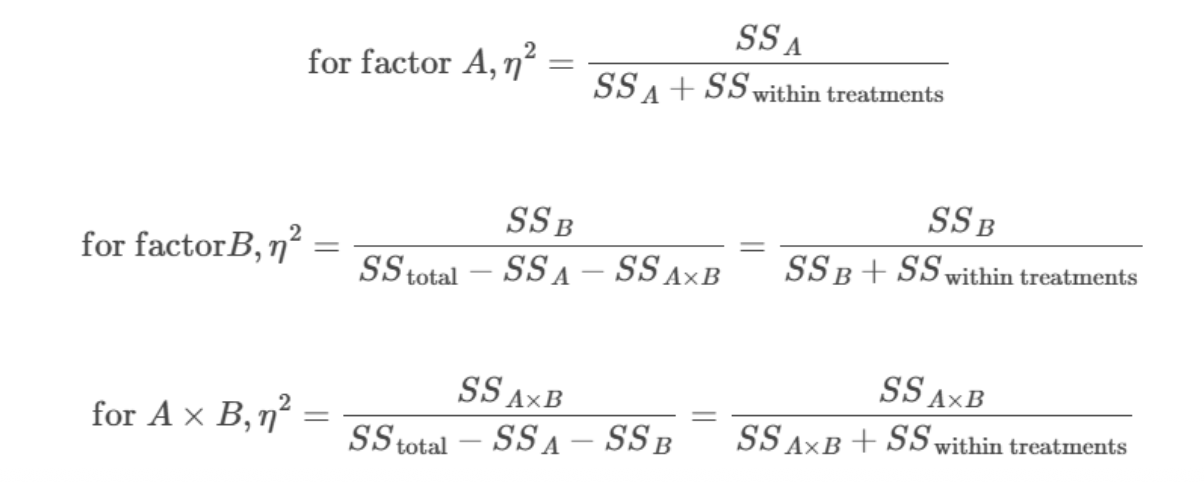
What is the Two-Factor ANOVA? Compared to IM and RM- ANOVA
given def for IM, RM, and then two factor
Give example for two factor
IM: different groups of observations
e.g. phones and attentions (1 factor with three levels)
RM: more than two points of observation in the same subject
Study strategy and performance
1 factor multiple levels but same subject
Two factors ANOVA is two factor! (2 dependent things you are measuring)
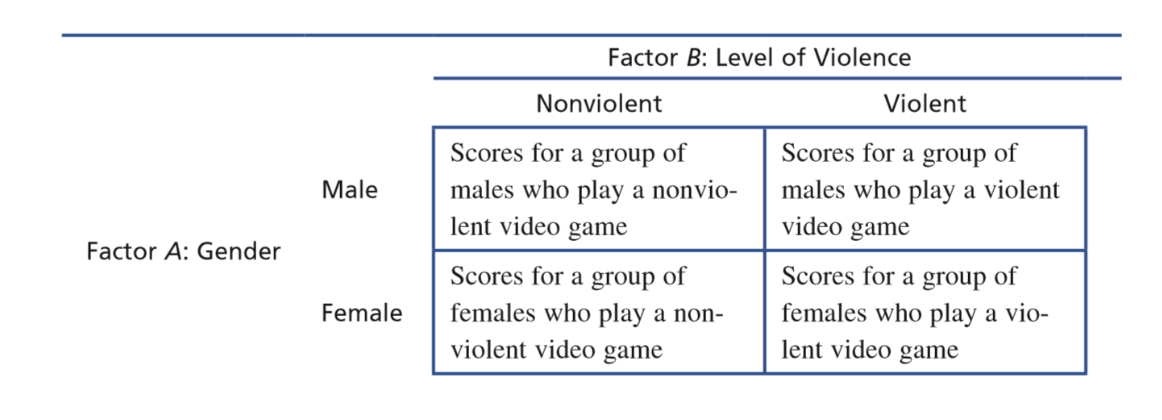
gender, level of violence in video games and aggression
Factor A: gender
Factor B: level of violence
Vocabulary for two-factor ANOVAs
what are the categories called
What is the entire thing, including all categories/level combinations called
Give a sentence for a two-factor ANOVA
is A a row or column
is factor B a row or colum
Cells
Matrix
for a 2 by 2 matrix of 4 cells
A is rows
B is columns
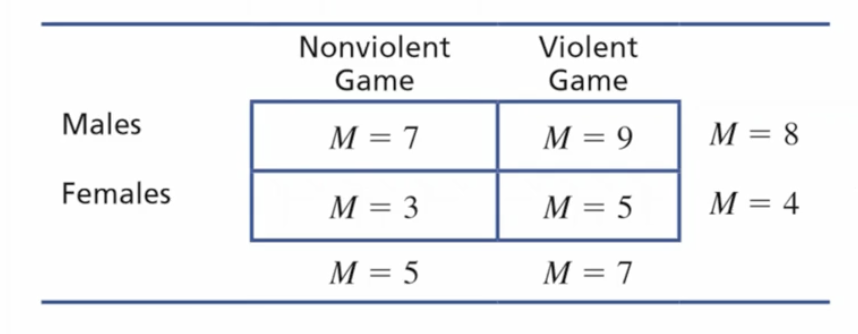
Multiple conclusions/possibilities with 2 factors
e.g. of gender, violence and aggression
based on the graph, what can you conclude?
Two things
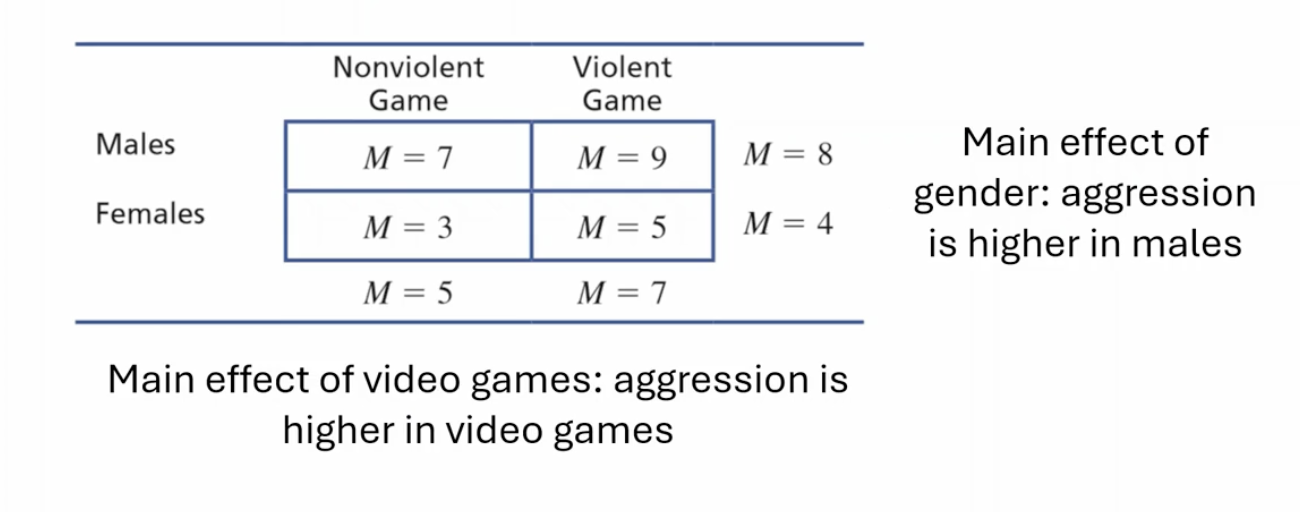
gender associated with aggression (main effect of gender)
video game associated with aggression (main effect of video games)
gender and video games interact in a complex way to influence aggression (interaction)
Main effect of gender: aggression is higher in males
Main effect of video games: aggression is higher in violent games
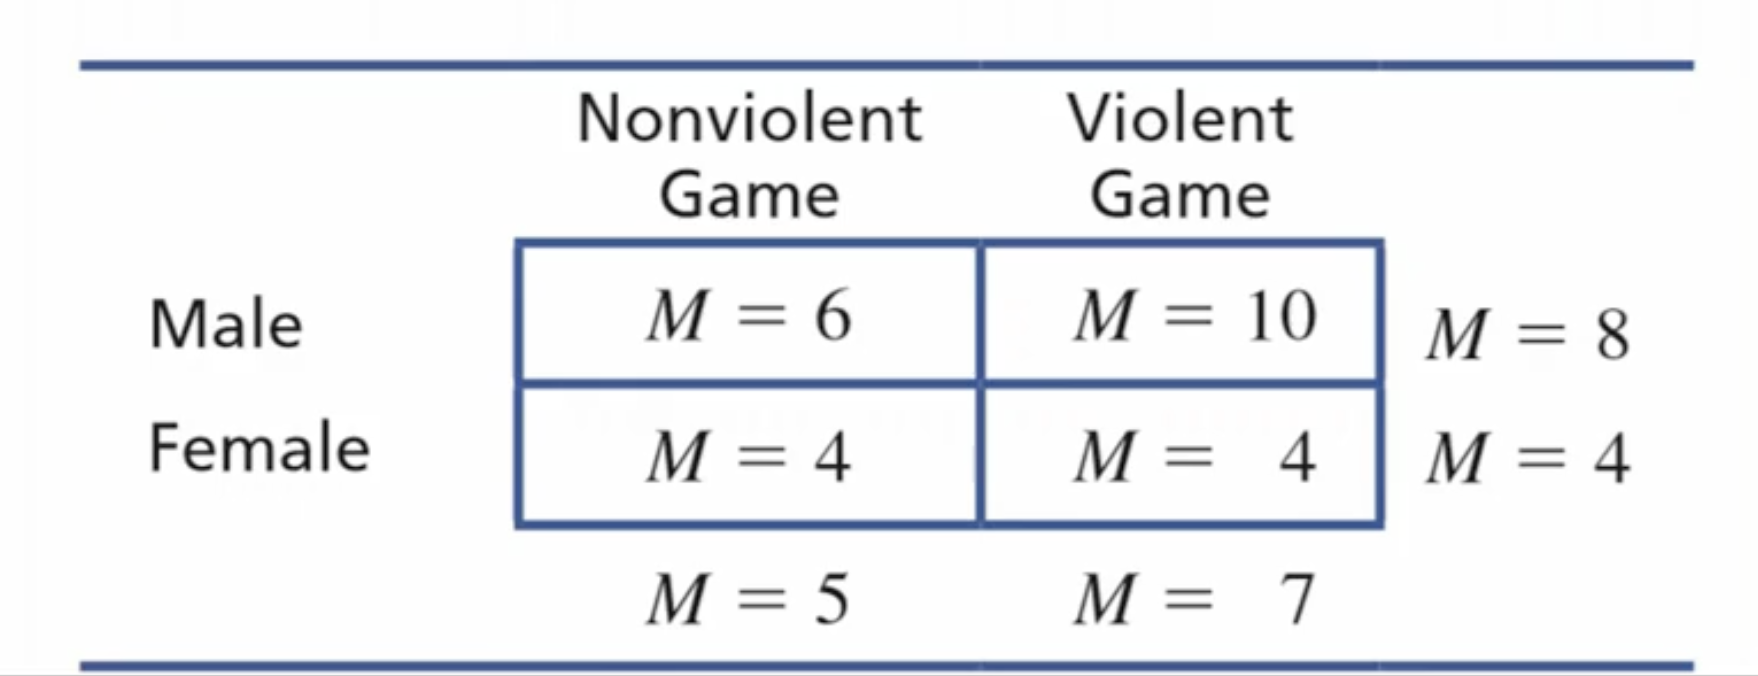
What does interaction mean?
give an example with aggression and violent video games in the table provided
Give a famous example
the cell shows a diff value than predicted by the main effects
e.g. table
If video games increase aggression, it doesn’t in all genders (not predicting as it should)
females have no change in aggression while only males do
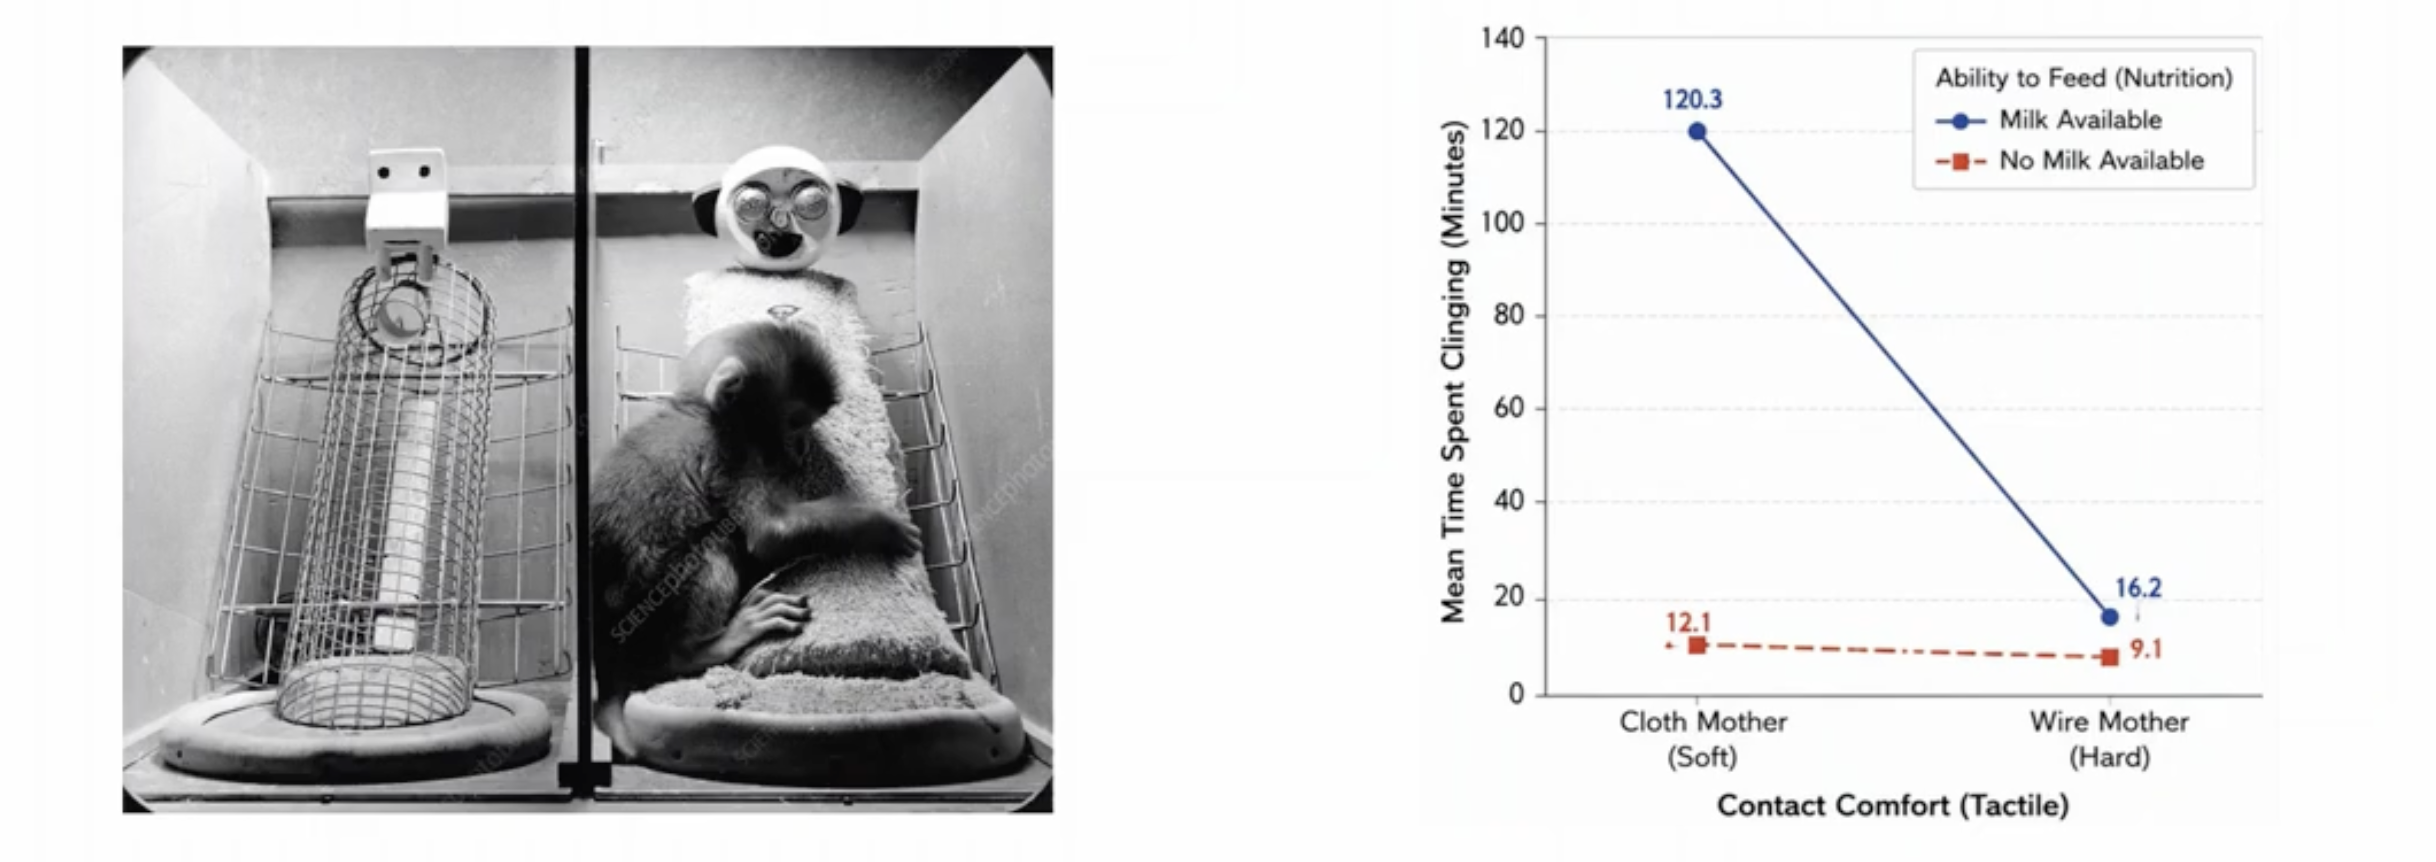
Harlow’s study with the monkey and the stuffed mother
The milk has a greater effect when comparing time spend with cloth vs wire mother
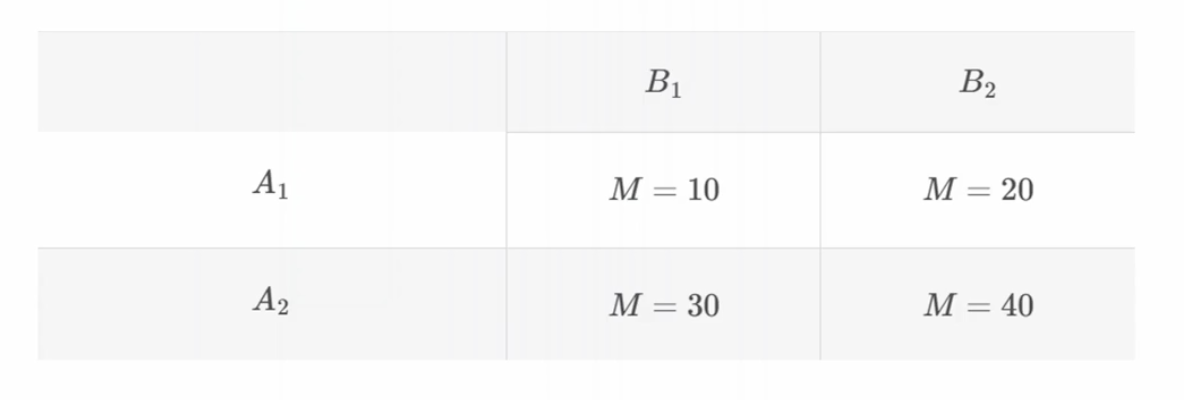
Practice: The the table provided an interaction?
no surprises = no interactions
Hypothesis (list all possible scenarios)
For Factor A
H0: no difference among the means of A: muA1 = muA2
H1: at least one difference among the means of A
Factor Factor B
H0: no difference among the means of B: muB1 = muB2
H1: at least one difference among the means of B
For Interaction (A X B)
H0: there is not interaction between the factors, The Mean difference between cells are explained by additive effects of the factors
H1: There is an interaction
calculating the F ratio - for the first two hypotheses
How do you calculate it (how many do you need)?
need an F ratio or separate F statistic for both factors
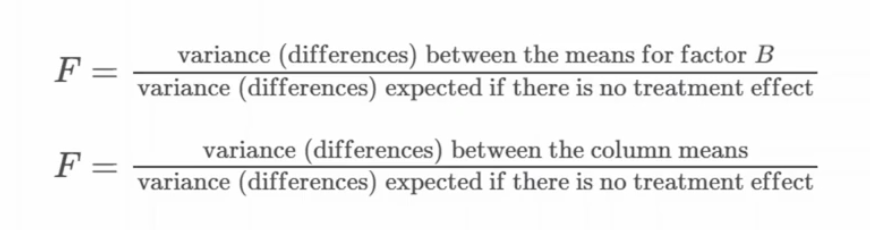
What is the F statistics for the Interactive hypothesis

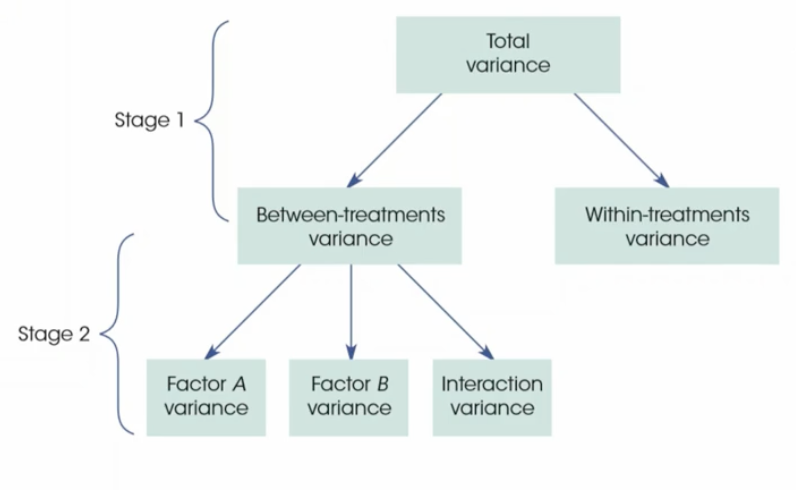
2 stage process for calculating F stats
describe each step breifly
1: separate variances from between and within treatments
2: separate the variances from between into three separate components to then calculate each F ratio
Two-Factor ANOVA notation
k
n
N
T, T col, T row
G
k = number of groups
n = number of individuals in one particular group
N is the total number of individuals
T the total sum of scores in each group: T col is the tot sum of scores in a particular column, T row is the tot sum of scores in a particular row
Stage one calculations
Six steps
M, T, and SS for each cell
calculate T for each row and column
calculate N, G, and sum(X²)
calculate for SS tot, SS between and SS within treatments
df tot = N - 1, df between = numbers of cells - 1, df within = tot df of each cell
Calculate for the MS within treatment
Denominator will be the same for all three F ratios going forward
Stage 2 calculations
Factor A variance and df
Factor B variance and df
Interaction variance and df
How to calculate for the df for all
SS A = sum T² row/n row - G²/N
df A = rows - 1
SS B = sum T² column/n column - G²/N
df B = columns - 1
SS AXB = SS between - SS A - SS B
df A X B = df between - df A - df B
Look at all F ratios
How to predict if it will be an interaction for the study?
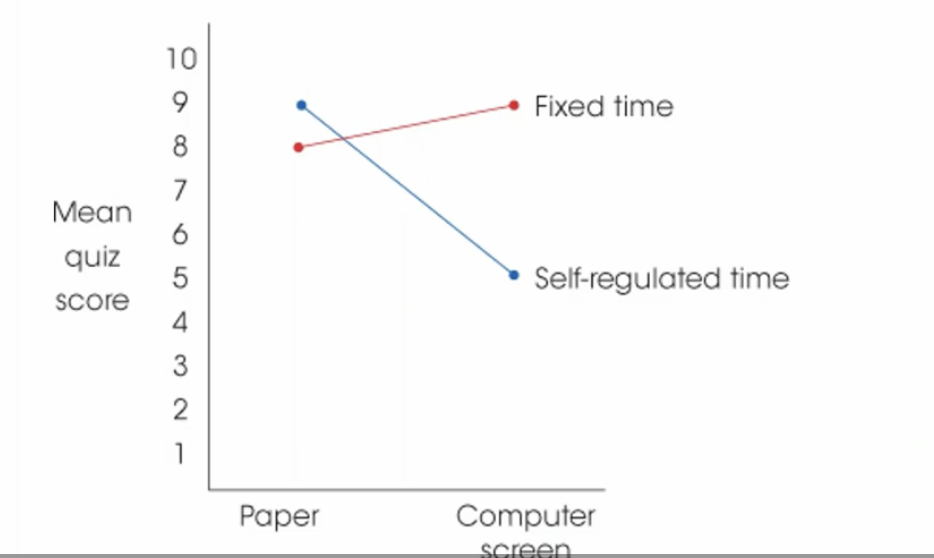
if the values in the table cross over
Measuring effect sizes, don’t have to remember