biostats - unit 2
1/64
There's no tags or description
Looks like no tags are added yet.
Name | Mastery | Learn | Test | Matching | Spaced |
|---|
No study sessions yet.
65 Terms
inferential statistics
determine how close our sample estimates are to our population parameters
null hypothesis
a specific statement about a population made for the sake of argument
typically says there’s no difference between the true value of a population and hypothesized value or no difference between 2+ samples drawn from a population
alternative hypothesis
states that our parameter estimate is different from null hypothesis
hypothesis that parameters are influenced by non-random cause
two-tailed test
no direction of alternative hypothesis, either outcome is tested/possible
one-tailed test
direction of hypothesis is predicted (need good reason for one-tailed test)
binomial exact test
use to determine if observed proportion of successes in a sample differs significantly from hypothesized population proportion
test-statistic
single, standardized measure of a sample distribution
allows us to evaluate how comparable our sample is to what we would expect under the null hypothesis
null distribution
sampling distribution of the test statistic if the null hypothesis were true
why is null distribution
tells you whether something interesting is going on or not!!
key to understanding all statistical tests and p-values
if test-statistic falls in the middle of null distribution, you can assume nothing special is happening (fail to reject null hypothesis)
p-value
probability of obtaining test-statistic or more extreme values if the null hypothesis is true
interpretation if p-value is 0.031
3.1% of the time, if p = 0.5 in a population of toads, we would expect to obtain 14 or more righties or lefties in a sample of 18 toads —> therefore, our sample seems unlikely if Ho is true
significance level
probability used as the threshold for rejecting the null hypothesis
if p-value is =< threshold value, we find support for Ha and can say result is “statistically significant” —> reject Ho
critical value
value of a test-statistic required to achieve P =< threshold value
type I error
mistakenly rejecting a true null, false positive
occurs with probability threshold value
why can’t we just lower our threshold value to prevent type I errors?
almost no chance any sample could lead to rejection of null and would cause us to routinely fail to reject false null hypotheses
type II error
false negative, mistakenly accepting a false null
keeps us from setting threshold value too low
depends on sample size, effect size, and precision —> more difficult to estimate
ecological/biological hypothesis
what is the mechanism we think underlies the difference we expect to see
exploratory analysis
goal is to find the story of the data
explanatory analysis
goal is to share the story of the data
goal of two variable comparisons
visualize the association between variables
numeric vs numeric
scatterplot
categorical vs numeric
mean and error bars or boxplots
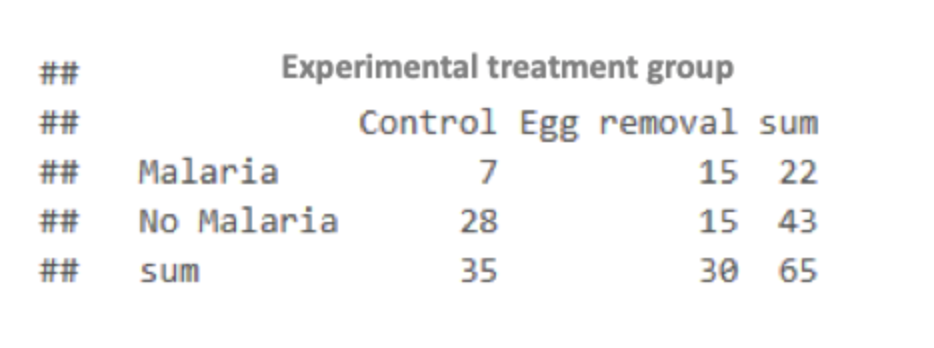
contingency table
frequency of occurence of all combinations of 2 or more variables
categorical vs categorical
contingency table
grouped bar graph
mosaic plot
correlation
correlation coefficient (r ) measures the strength and direction of the association between 2 numerical variables
no implications of causality (no explanatory or response variables)
regression
measures the functional/causal relationship between two variables
gives us fit line (incorporates correlation and slope)
regression - big slope but small correlation
when x changes, y changes a lot BUT pattern isn’t reliable (very noisy)
finding line of best fit for regression
from sum of squares (think: variance)
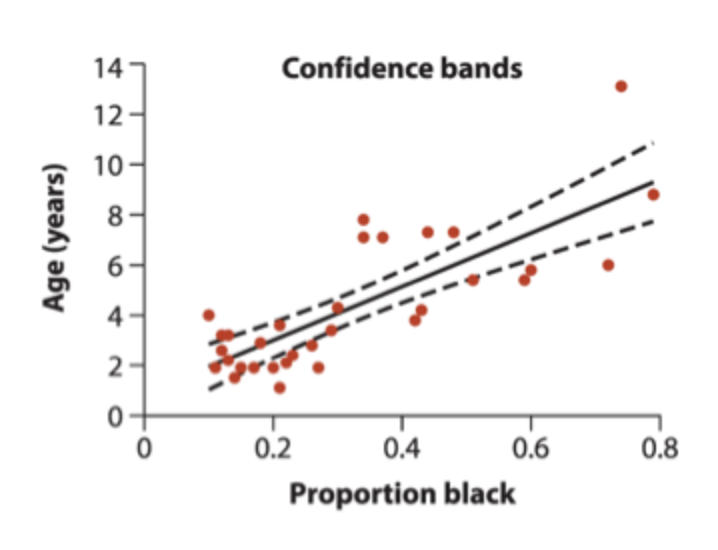
regression - confidence bands
measure precision of the predicted Y for each value of x
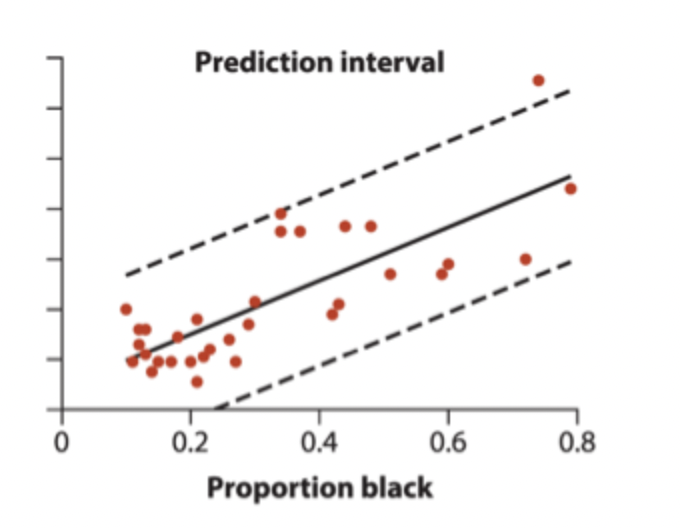
regression - prediction intervals
measures the precision of a single predicted y-value for each X
what we report for regression
r², F-statistic, and p-value
t-tests and ANOVAs
both compare difference between groups, so predictor is categorical and each category is a different group
t-test
is our sample mean more than two 1.96 SE away from null distribution parameter mean? if so, we would only expect to see that data 5% of the time
ANOVA
is the amount of variability in each group greater than the amount of variability between the group means?
F-distribution
null distribution of F-statistic, skewed right, all non-negative values (because variances can’t be negative)
ANOVA and F-distribution
if F-statistic from ANOVA falls in tail of F-distribution - reject null hypothesis
f-statistic comes from comparing among to within group variances to detect differences in group means
F > 1 = more difference between treatment groups than variation within groups
F = 1 means equal among and within group variance
what we report for t-test
t-statistic, p-value, and df
what we report for ANOVA
F-statistic, df, and p-value
when to use t-test or ANOVA
categorical predictor and numerical response
when to use x²
categorical predictor and categorical response
goal of x²
what is the observed ratio of members of each group? does it differ from expected ratio?
are the two categorical variables independent of each other?
x² distribution
frequency distribution of x² under a null hypothesis predicting expected categorical counts
not symmetric and right skewed
all non-negative values
what we report for x²
x², df, and p-value
parametric assumptions
random, independent sampling and sufficient sample size
normality
homoscedasticity
no outliers
requirements for x² test
all expected values greater than 1 and 80% greater than 5
testing for normality
visualization of residuals (histogram) or shapiro-wilk test
shapiro-wilk
p-value has to be greater than 0.05 to indicate that the data is normal
testing for homoscedasticity
look at actual values of raw data, look at residuals vs fitted plots (dotted line should be approximately horizontal)
use levene’s test
homoscedasticity
one group should not be much more variable than the others
power of log transformations
helps with right skew, outliers, and heteroscedasticity
why are transformations like log permitted
still preserves the relationship in the data, it just rescales it to make things behave better
non parametric tests
less powerful so you’re more likely to miss a real difference
much harder to interpret biologically
why it’s important to start with a thorough visualization of data
if you start out by only testing one hypothesis, you could get tunnel vision and miss finding something really important
data visualization opens your mind so you don’t miss important patterns, weird shapes, outliers, etc.
QQ plot
visualize normality
residuals vs fitted values
visualize heteroscedasticity
Post-ANOVA analysis for fixed effects
planned comparisons and unplanned comparisons
syntax for t-test
t.test(y ~ x, data = dataName) OR t.test(Data$Var1, Data$Var2, paired = TRUE)
calculating expected for chi squared test
chisq.test(fish_table)$expected
syntax for chi squared test
chisq.test(fish_table, correct = FALSE)
planned comparisons
focus in on a few scientifically sensible comparisons. You can't decide which comparisons to do after looking at the data. The choice must be based on the scientific questions you are asking, and be chosen when you design the experiment
unplanned comparisons
post hoc tests
testing differences between all pairs of group means while providing protection against rising Type I errors that would result from multiple comparisons
Q-Q plot
plots theoretical distribution values against residuals
scale-location homoscedasticity
checks the assumption of equal variances
histogram of residuals
checks the assumption of normality looking at results from sum-of-squares line
linearity
checks the relationship between fitted values and residuals