Organism in the environment + feeding relationahips
1/34
There's no tags or description
Looks like no tags are added yet.
Name | Mastery | Learn | Test | Matching | Spaced |
|---|
No study sessions yet.
35 Terms
Population
A population is the number of one species living in an area at a particular time
Population is a NUMBER.
Community
All organisms of all different species living/found in the same area at a certain time (same habitat)
Within a community, each species depends on other species for food, shelter, pollination, seed dispersal, etc. If one species is removed, it affects the whole community
Habitat
Place where an organism lives
Ecosystem + what components do they usually have?
Interaction between all biotic (living) and abiotic (non-living) factors within an area
Producers, consumers, decomposers and the physical environment.
Producer
Organisms that makes its own food (e.g green plants photosynthesise)
Consumer
Animals that feed on plants (herbivores) or other animals (carnivores)
Organisms that eat other organisms
Decomposers
Organisms that feeds by breakinh down dead material of other organisms (and help recycle nutrients)
Practical: investigating population size
Ecology
The branch of biology that studies how organisms interact with each other and their environment
What tool do ecologists use and why?
Quadrats to study population size (and distribution)
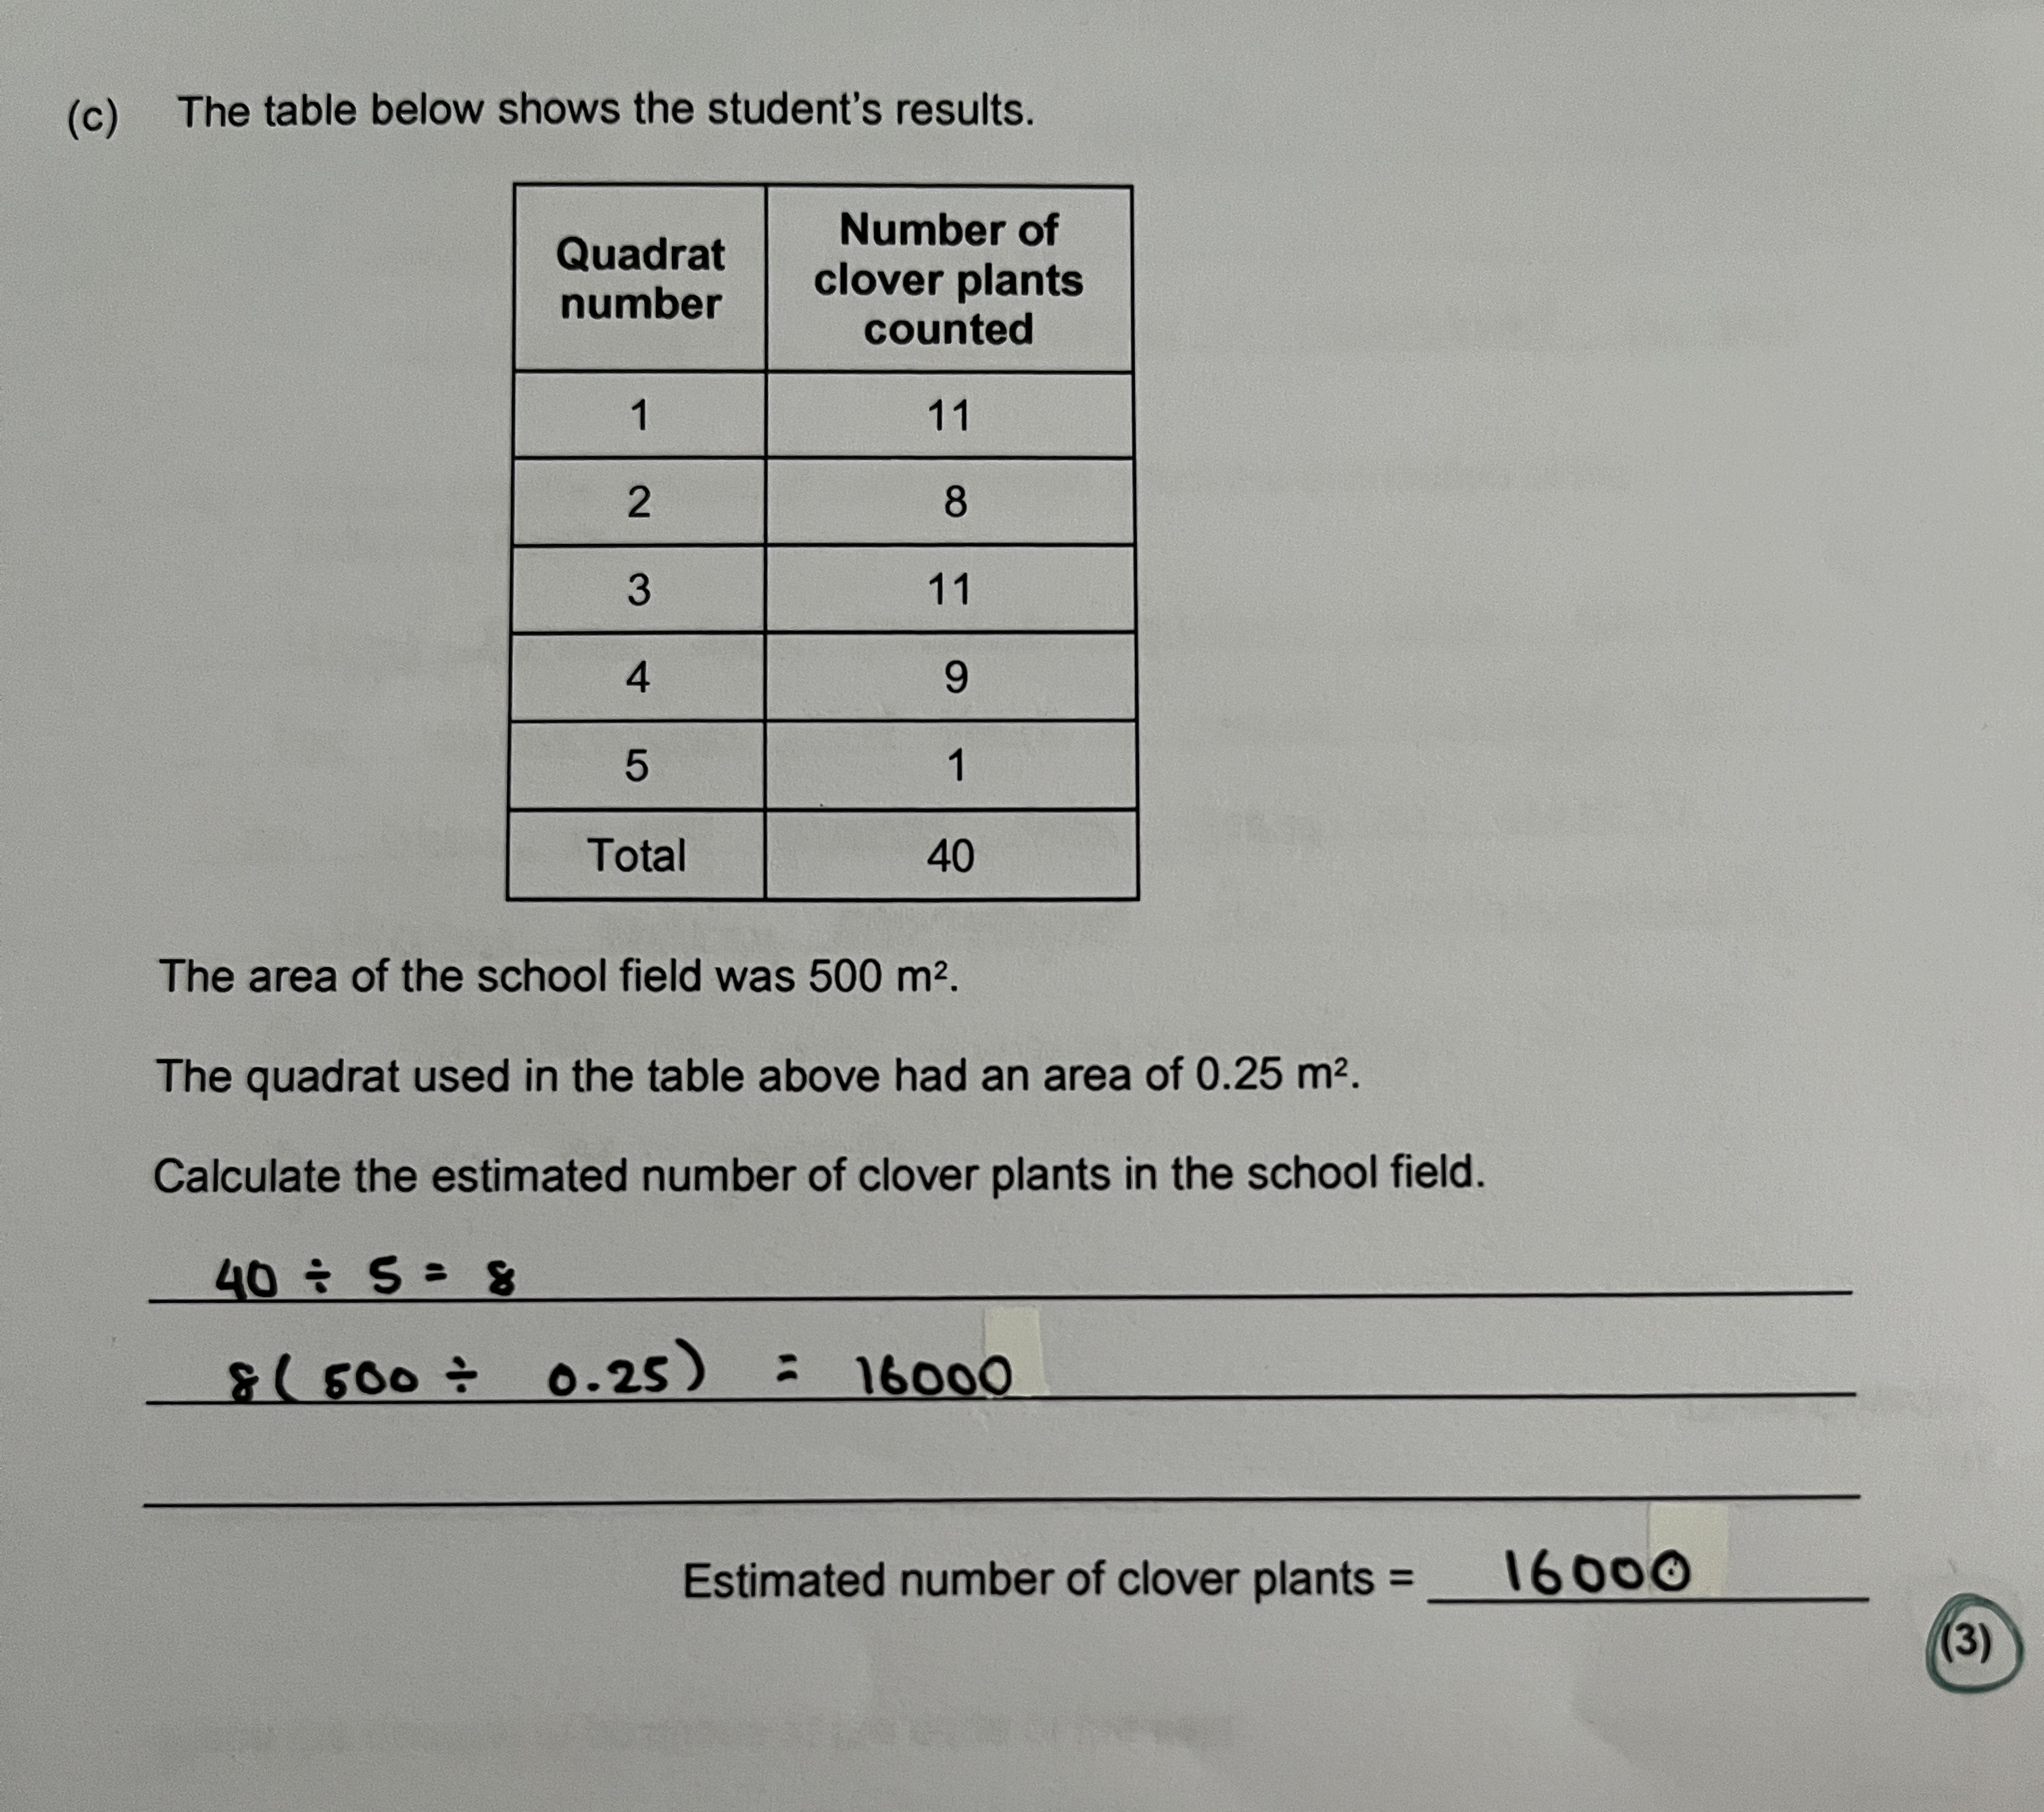
Design an investigation to calculate population size
Use quadrats
Place several, same size quadrats (e.g 10 quadrats)
scattered at random places (use coordinate generator if needed)
Count number of x (e.g plants) in each quadrat
Calculate average number of plants per quadrat
Multiply up to total area of field
Básicamente: calculate the average number of plants per quadrat and multiply this by how many quadrats there would be in the area of the whole field (see example).
Equation = total area/area of quadrat x total number of flowers
Design a CORMS experiment
C - changing the studied area where the collection of data takes place
O - Count the number of one/same species of organism in each quadrat (e.g dandelion flower)
R - Repeat each investigation 3 times using 10 quadrats each time
M - Count the number of the species across all quadrats
M - not relevant BUT can say: in both areas separately
S - Same size of quadrat
S - Same day of recollection of results for both areas; random way of scattering quadrats.
NOTE: sometimes in CORMS experiment we won’t always have 2 details. For example, when calculating how something affects heat being released we would have M1 by saying “calculate temperature change” but for M2 there is no obvious answer. In these cases we could add an apparatus just to be sure (no guarantee it is in mark scheme). E.g “with a thermometer”.
For measuring temperature in designing experiments we say for S1 (same) in CORMS, “insulate jar” or something like that to prevent heat loss. Mark 2 for S2 would be the obvious thing like “same moisture/time/light intensity/etc”
Biodiversity
The range and variety of different species of organisms on Earth or within an ecosystem.
It considers both the number of different species present (known as species richness), the relative abundance of each species (their ‘evenness’ of numbers) and the population sizes of each species.
E.g high biodiversity = environment with lots of different species with a lot of variation, all evenly distributed so no big differences in population numbers and large populations
The number of different animal species living in the river was recorded as a measure of biodiversity of animals
Give a reason why it may not be a complete measure of biodiversity
does not consider plants / bacteria / fungi / protoctists / eq (1)
does not take into account the population sizes / numbers of organisms / abundance/ some species may have different numbers / eq (1)
some species may be seasonal / migrate (1)
What does biodiversity allow us to do?
(idk if need to learn) Why is biodiversity good?
Compare two diff areas or the same area at diff times.
More resilient to environmental impacts or disease. If mouse population is wiped out, if there is biodiversity, the populations of its predators won’t disappear as well because there would be other food sources (even though the predator’s populations would decrease).
Practical: investigating distribution of organisms to measure biodiversity
Básicamente de same experiment que antes but we know take into account the thingies that determine biodiversity (species richness and the relative abundance of each species)
Then make two bar charts with the results of the population and the different organisms in a table.
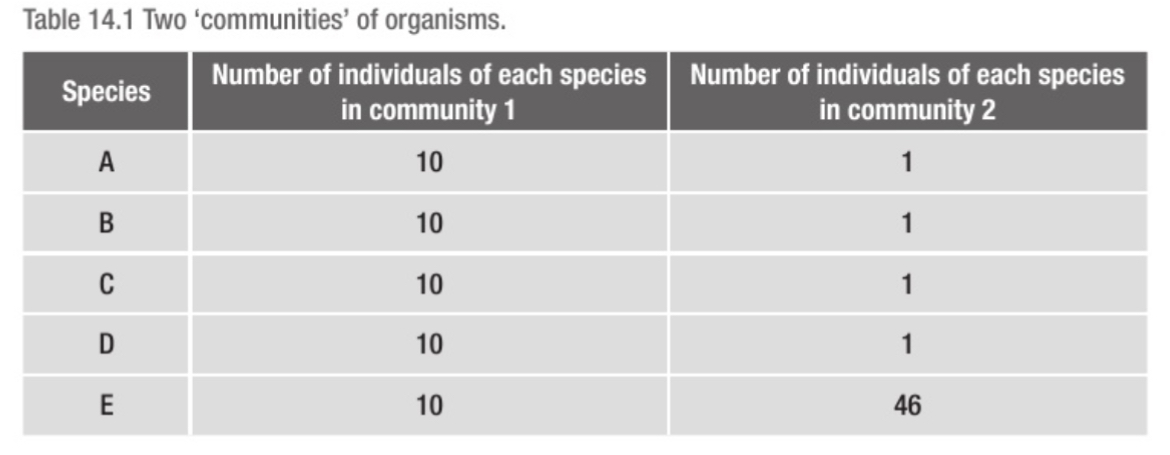
Which community shows more biodiversity? Why?
Both communities contain the same number of species (5) and organisms (50). But community 1 has a higher biodiversity because it contains an even number of each species whereas community 2 is dominated by a single species.
What are the two types of factors that affect the numbers and distribution of organisms in an ecosystem?
Biotic factors - biotic factor affecting an ecosystem
Abiotic factor - physical or chemical factor affecting an ecosystem
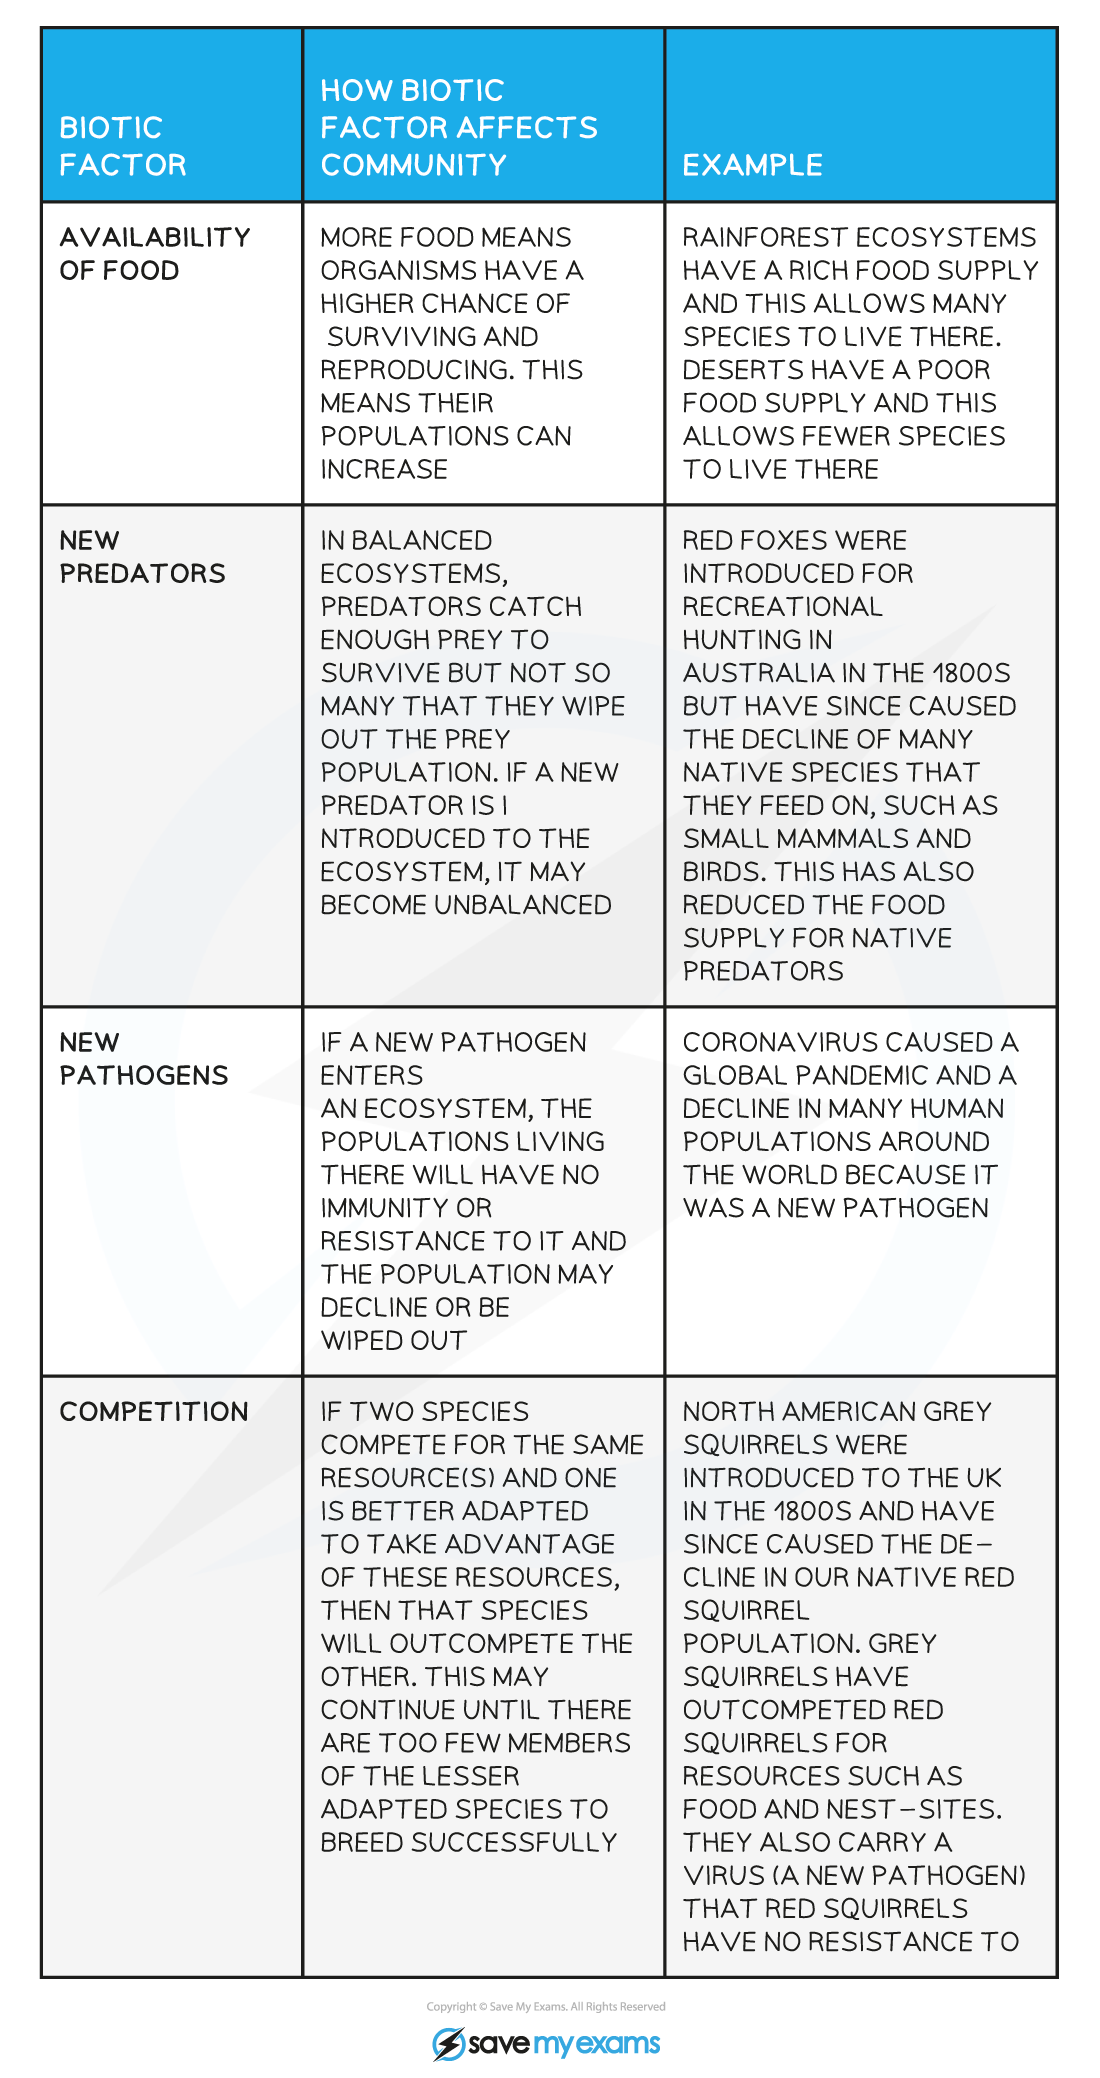
Examples of biotic factors
Availability of food and competition for food resources; predation; parasitism; disease; presence of pollinating insects; availability of nest sites
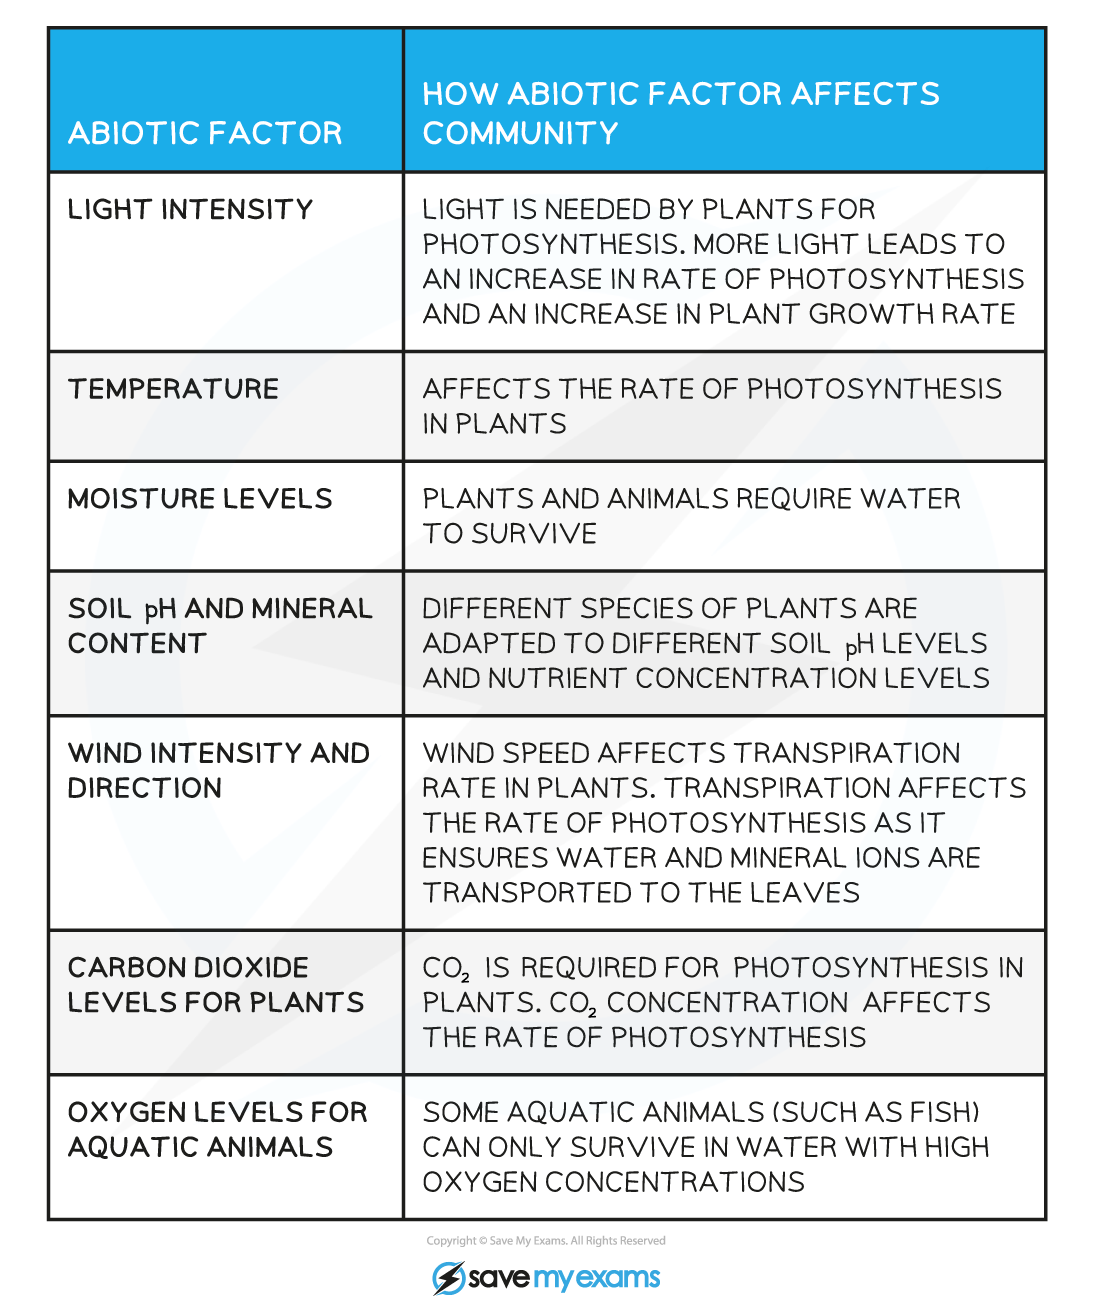
Examples of abiotic factors
Climate (e.g light intensity, temperature and water availability)
Hours of daylight
Soil conditions (clay content nitrate level particle size water content and pH)
Other factors specific to a particular habitat (e.g salinity in an estuary, flow rates in a river or oxygen concentration in a lake)
Pollution
Main factor affecting large ecosystems is climate, particularly temperature and rainfall.
Note: when answering questions that refer to a chart, graph or table remember to reference specific figures from the data to support the answer
What are tropic levels? What are the different trophic levels?
Position of an organism in a food chain
Producer → primary consumer → secondary consumer → tertiary consumer
What do these arrows represent? Why do all food chains start with producers?
Arrows show the transfer of energy between trophic levels.
They convert energy into a form that can be used by other organisms. E.g plants convert light energy into chemical energy.
What are food webs? What happens if there is a change in one population within a food web?
Networks of interconnected food chains that show how energy flows through an entire ecosystem.
It affects other populations
What do pyramids of numbers show? Why sometimes it is not pyramid shaped?
A diagram showing how many organisms are present at each trophic level.
The size of each bar indicates the number of organisms present.
Sometimes many small organisms feed on few large organisms. For example, 1000 ladybirds can feed on 1 oak tree.
What do pyramids of biomass show? What shape are they and why?
The mass of the organisms in each tropic level.
Biomass = mass of living matter
They will always be pyramid shaped because the available biomass always decreases at higher trophic levels of a food chain.
What do pyramids of nervy transfer show? What shape are they?
The stored energy within the biomass at each trophic level.
Always pyramid shaped because energy is lost from food chains at each trophic level so not all energy is transferred to the next level.
When drawing food pyramids:
Trophic levels must stay in the same order as the food chain, producers at the bottom.
Each bar must be labelled to indicate the tropic level
The length of a bar reflects the unit represented by the pyramid; a longer bar indicates: more organisms OR greater biomass OR more stored energy
Bars should be the same height
Should be drawn to scale if graph paper given
First tropic level
Producers: light energy from the sun and producers convert it into chemical energy (glucose and starch) by photosynthesis.
Next trophic levels
Energy is transferred through food chains when primary/secondary consumers eat producers/primary consumers, digesting and assimilating the molecules (include carbon compounds) in their biomass and using the energy to build their own tissue for their own biomass (only energy that goes to next consumer)
Some energy and substances are lost to the environment
Why are food chains short?
When organisms consume other organisms, only around 10% of energy available at each trophic level is converted into biomass at the next level. This means the energy available becomes too small to support another trophic level
How is energy lost?
Not all food is eaten (e.g predators don’t consume bones)
Not all is digested and absorbed, some is egested as faeces (e.g humans can’t digest cellulose in plant cell walls)
Some energy is lost as heat during respiration
Some energy is transferred into waste products like: carbon dioxide and water as waste products of respiration; urea waste product of protein synthesis.
Equation for efficiency of energy/biomass transfer
Energy that ends up as part of organism’s biomass/Energy available x 100
Decomposers
Organisms that feeds by breaking down dead remains of other organisms.
Examples: bacteria, fungi
NEXT -THE CYCLES (specifically carbon cycle)