Business Statistics Formulas and there purposes (Exam #2)
1/18
There's no tags or description
Looks like no tags are added yet.
Name | Mastery | Learn | Test | Matching | Spaced |
|---|
No study sessions yet.
19 Terms
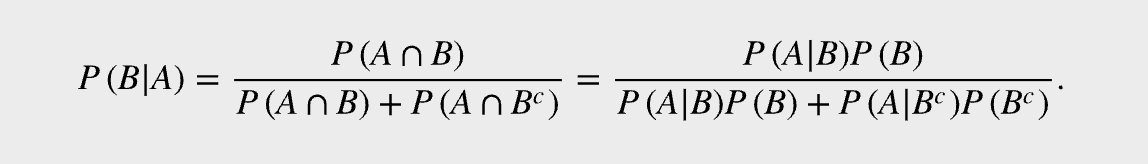
1. Bayes' Theorem
Use When:
You are reversing conditional probability
Given a test result or evidence, find the probability of the cause
Common in medical testing, classification, true/false positive scenarios
Example:
You test positive for a disease. Given the accuracy of the test and the probability someone actually has the disease, what is the chance you actually have it?
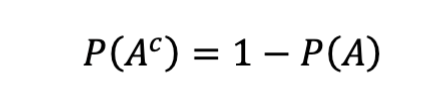
2. Complement Rule
Use When:
It’s easier to calculate the probability something does NOT happen
Used in almost all distributions
Example:
Probability it rains today is 0.3 → probability it doesn’t rain is 1 − 0.3 = 0.7.
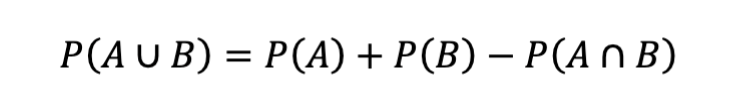
Union of Two Events
Use When:
You want probability that at least one of two events happens
Applies in general probability (not tied to one distribution)
Example:
P(student plays soccer) = 0.4, P(student plays basketball) = 0.3, P(both) = 0.1
→ P(plays either) = 0.4 + 0.3 − 0.1 = 0.6
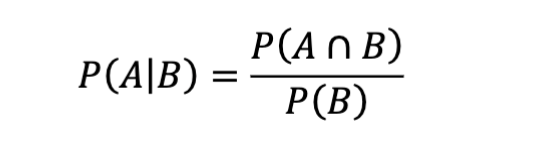
4. Conditional Probability
Use When:
You already know event B happened and want the chance A also happened
Used in dependent probability questions
Example:
Probability someone is left-handed (A) given they are an artist (B).
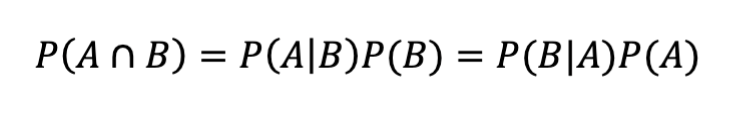
5. Multiplication Rule
Use When:
You need the probability of both events happening
Can be for dependent or independent events
Example:
Probability a randomly selected person is both female and left-handed.

Law of Total Probability
Use When:
You are finding the total chance of an event, considering multiple scenarios
Often paired with Bayes’ theorem
Example:
Two machines produce parts. Machine 1 produces 70% of parts with a 2% defect rate; Machine 2 produces 30% of parts with a 4% defect rate. What is the chance a part is defective overall?

Bayes’ in A|B Form
Use When:
Same as Bayes’ theorem, but solving for P(A∣B)
Used for "given the evidence, find the cause"
Example:
A patient tests positive. What’s probability they actually have the disease?
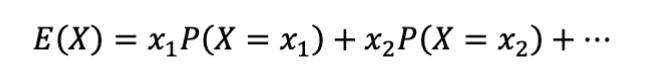
Expected Value of Discrete Random Variable
Use When:
For discrete distributions like Binomial, Geometric
Represents average outcome
Example:
Roll a weighted die where 6 has higher probability. Expected roll value uses this formula.

9. Variance
Use When:
Measures how spread out the outcomes are
Same distributions as expected value
Example:
Variance of rolling a die.
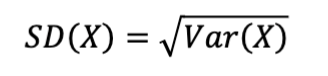
10. Standard Deviation
Use When:
Always! Standard deviation is just the square root of variance
Used to measure spread in any distribution
Example:
If variance = 4 → SD = √4 = 2.

Linear Transformation of Expected Value
Use When:
You apply a linear transformation to a random variable (like converting Celsius to Fahrenheit).
Example:
If E(X)=50and you convert scores with Y=2X+10Y, then E(Y)=2(50)+10=110
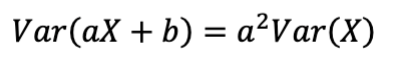
Linear Transformation of Variance
Use When:
Measure how scaling affects spread; adding a constant does not affect variance.
Example:
If Var(X)=4 and Y=3X+2Y, then Var(Y)=32⋅4=36 Var(Y) = 3^2 x 4 = 36

Use When:
Assessing combined variability; covariance captures correlation.
Example:
Used in finance to calculate risk of a two-asset portfolio.
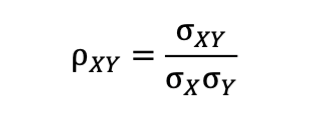
Use When:
To measure strength and direction of linear relationship between two variables.
Example:
Height and weight: if ρ=0.8\rho=0.8ρ=0.8, strong positive linear correlation.
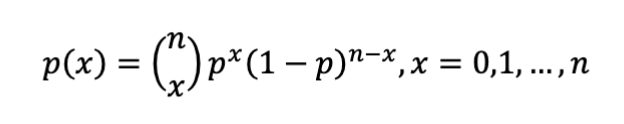
Use When:
Fixed number of trials
Two outcomes (success/failure)
Independent trials
Constant probability
Example:
Flip a coin 5 times: probability of exactly 2 heads.
Mean & Variance:
E(X)=np Var(X)=np(1−p)
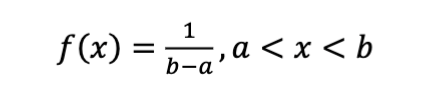
PDF Formula:
Use When:
All outcomes in an interval are equally likely
Models random time or location within a range
Example:
Bus arrives randomly between 0 and 10 minutes → uniform(0,10).
Mean & Variance
E(X)=a+b/2 Var(X)=(b−a)²/12
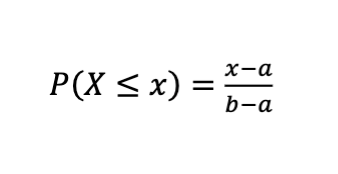
Uniform Distribution Cumulative Probability
Use When:
The random variable X is uniformly distributed on the interval [a,b]
You're asked for the probability that X is less than or equal to some value x.
Example:
Bus arrives uniformly between 0 and 10 minutes. What is the probability it arrives in 4 minutes or less?
P(X≤4)=4−0/ 10−0=0.4
✅ Interpretation: 40% chance the bus arrives within 4 minutes.
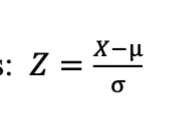
Z-score (Standard Normal Transformation)
Use When:
You want to convert a value from a normal distribution into a standard normal distribution (mean = 0, SD = 1).
Used to find probabilities using the Z-table or to compare values across different distributions.
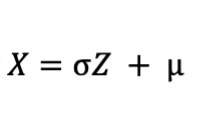
Converting From Z Back to X
Use When:
You are given a Z-score (often from a percentile) and need to find the actual value in the original distribution.