Lecture 4: Shrinkage Methods
1/69
There's no tags or description
Looks like no tags are added yet.
Name | Mastery | Learn | Test | Matching | Spaced | Call with Kai | Chat |
|---|
No analytics yet
Send a link to your students to track their progress
70 Terms
What are Ridge and Lasso alternatives to?
Regression
Are the Ridge/Lasso estimators biased?
Yes
Do Ridge/Lasso or regression estimates have a smaller mse?
Often Ridge/Lasso is lower
What type of method are Ridge and Lasso?
Shrinkage methods
What do we mean by shrinkage methods?
Reduces the size of the set of estimated coefficients compared to a regression
How does the shrinking of estimates differ between Ridge and Lasso?
Ridge shrinks the estimates but does not set any to zero; Lasso shrinks the estimates and sets some to zero
Which of Ridge and Lasso is often preferred for model selection?
Lasso
In this example, how do we generate the explanatory and dependent variables?
How do we use the data to obtain the mse for each model?
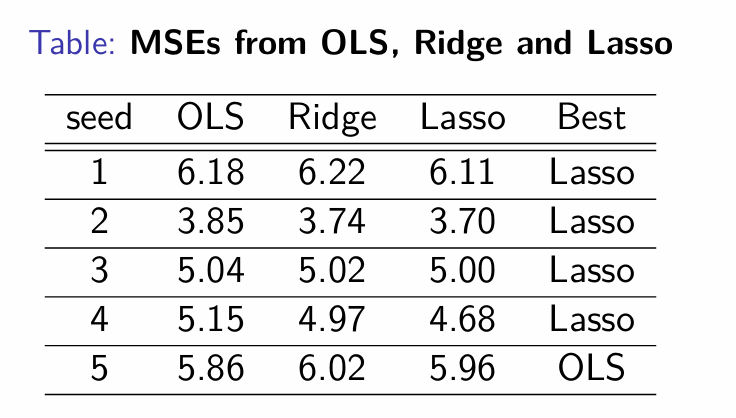
What do the mses from each model tell us?
For Ridge, how many observations and explanatory variables do we have?
N observations; p explanatory variables
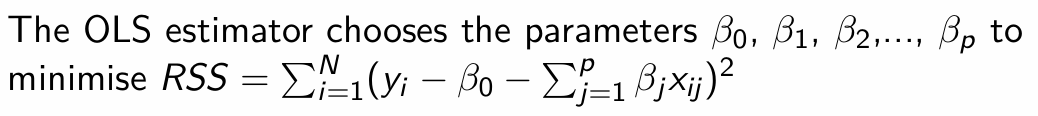
How does the OLS estimator choose the parameters β0, β1, …, βp? What does it aim to do with them?
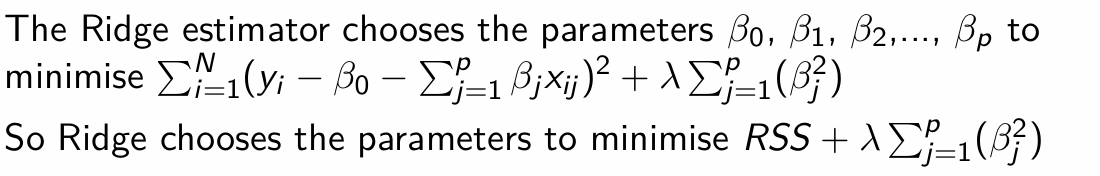
How does the Ridge estimator choose the parameters β0, β1, …, βp? What does it aim to do with them?
What is λ representing?
Tuning parameter
What is this known as and why?
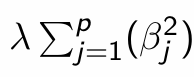
L2 (shrinkage) penalty; penalises the squared values of β
How do we choose the value of λ?
Cross-validation (kFCV)
What does the shrinkage penalty not apply to?
The intercept, β0
What does the shrinkage penalty do to the estimated Ridge parameters?
Make them smaller than the estimated OLS parameters; however individual Ridge estimated parameters can be larger than their OLS counterparts
When λ = 0, how to the Ridge and OLS estimates compare?
Ridge chooses parameters to minimise RSS; Ridge and OLS estimates are the same
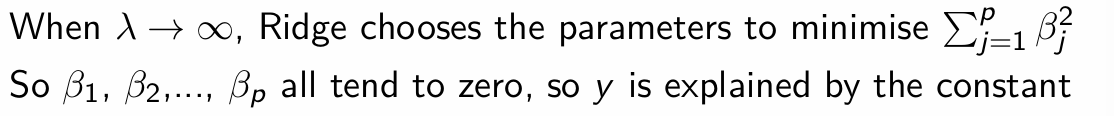
When λ → ∞, how to the Ridge and OLS estimates compare?
How can we express the observations in a matrix?
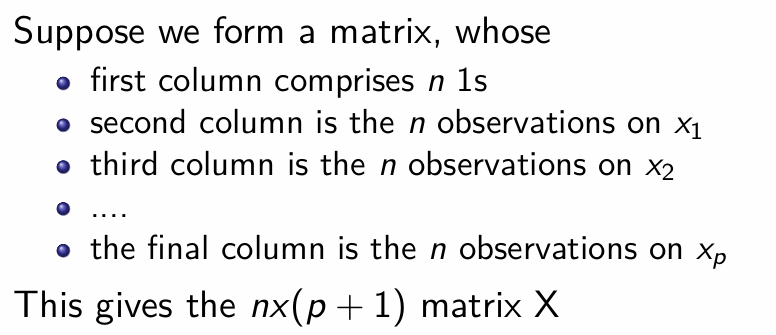
How can we express the observations of y in a vector?

How can we express the identity matrix of p+1?

How can we then express the OLS and Ridge estimators?
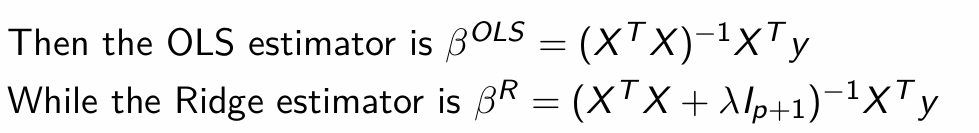

What factor results in the Ridge estimator being smaller?
The inverted term is larger with Ridge than with OLS
How might the ridge estimation look on a graph?


What do the red ellipses represent?
Contours with the same value of RSS

Where do we see the lowest value of RSS?
At ˆβ; these are the OLS estimates

As we move away from ˆβ, what happens to the RSS?
RSS increases

What is the constraint that represents the blue circle?
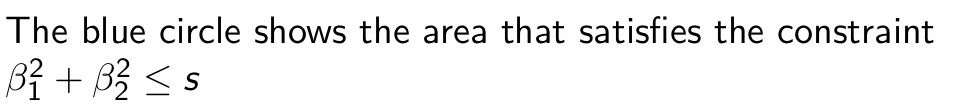

Where do we find the Ridge estimator?
Where the blue circle is tangential to the red ellipses
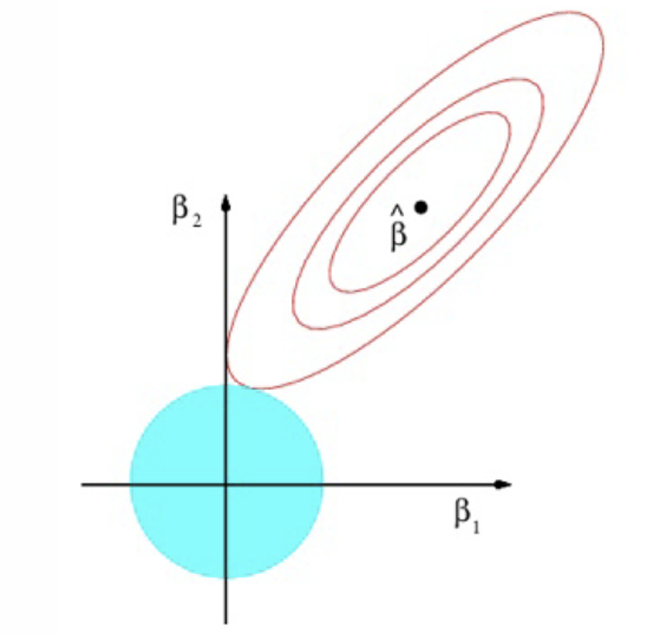
When does the tangency occur regarding parameter values?
When both parameters are positive

What does Ridge do to the values of the parameters relative to the OLS estimates?
Reduces the values of the parameters but does not set any to zero
How does the Lasso estimator choose the parameters β0, β1, …, βp? What does it aim to do with them?
What is this known as and why?
L1 penalty; penalises the values of β
What does each value of λ give?
A different Lasso model, similar to in Ridge
How do we express the Lasso estimator?
No simple expression unlike Ridge
What would Lasso look like on a graph for two explanatory variables?


What is the constraint that represents the blue diamond?
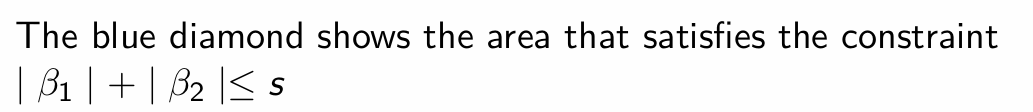

At what point is the Lasso estimator obtained?
Where the blue diamond is tangential to the red ellipses
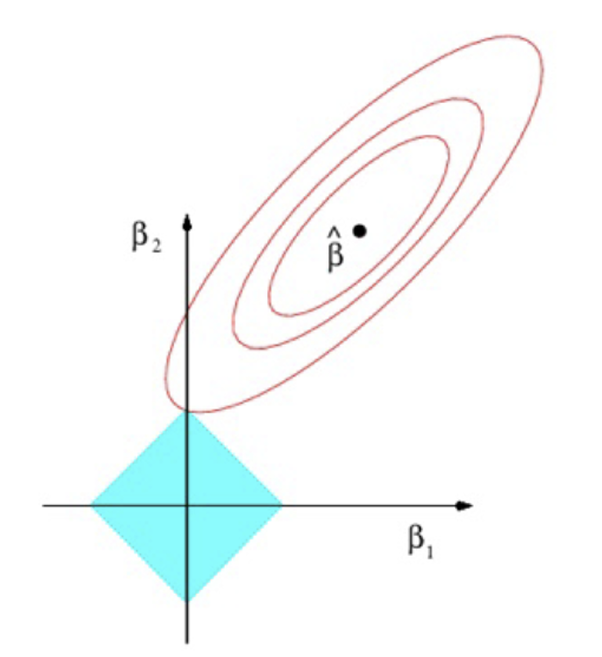
When does tangency occur regarding the values of parameters?
When one of the parameters is zero
What happens to the parameters that are equal to zero?
Eliminates some explanatory variables from the model; shrinkage penalty may shrink some parameters to zero
What is the equation for mse using variance and bias?
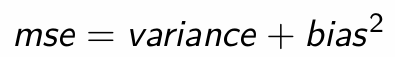
Given Ridge and Lasso are biased estimates, how can they achieve a lower mse?
Using a lower variance
OLS is prone to overfitting. What is one symptom of overfitting by OLS and when does it occur?

How does Ridge and Lasso counteract the tendency of OLS to overfit and then obtain a lower mse?
Penalises large coefficients, allowing for better predictions of the test data which obtains a lower mse
When is the tendency to overfit especially marked?
When there is multicollinearity in the training data
In R, how do we prepare the data for Ridge estimation?
How do we create the matrix of observations on explanatory variables and what has it done to the factors?

How do we generate the dependent variable y?

How do we generate a grid?
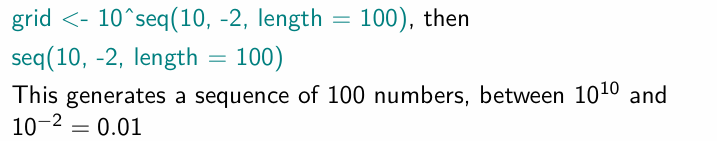
What are the grid values used for?
Different values of the tuning parameter
How do we split the data into training and test data?

How do we run the Ridge models?


When λ is very small (log λ is negative), what estimates do we obtain?
OLS estimates
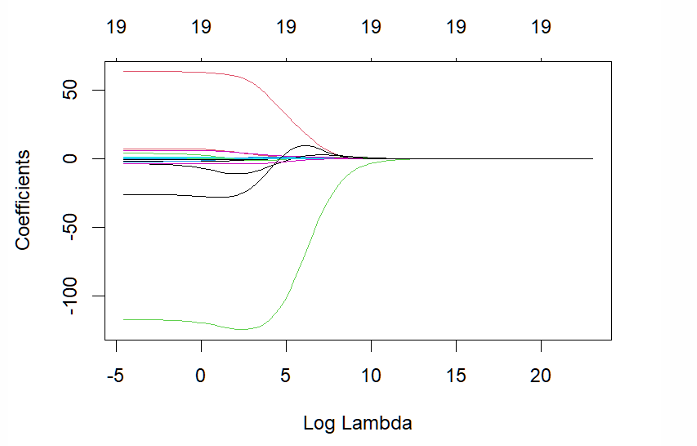
What happens as λ increases?
The estimated coefficients get smaller

What happens as λ → ∞?
Estimated coefficients become zero (except the constant)
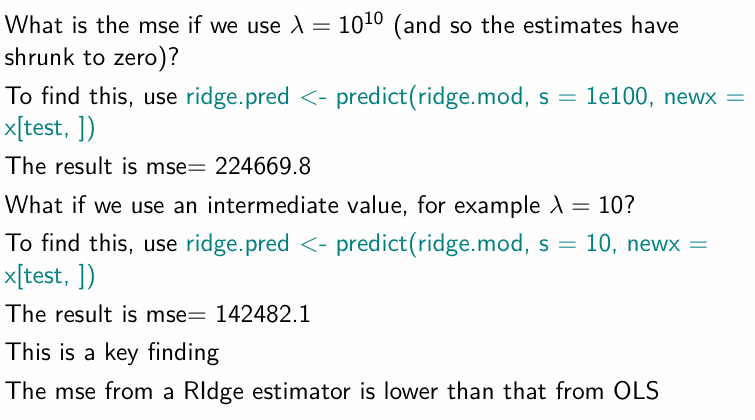
How do we obtain the mse for when λ = 0?
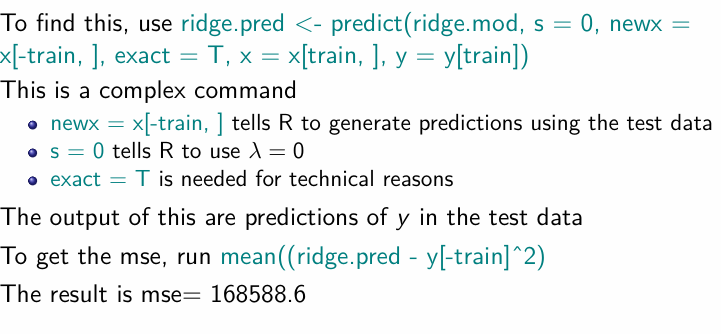
How does the mse differ for λ = 1010 and λ = 10? What does it tell us?
How do we find the optimal value of λ using cross-validation?
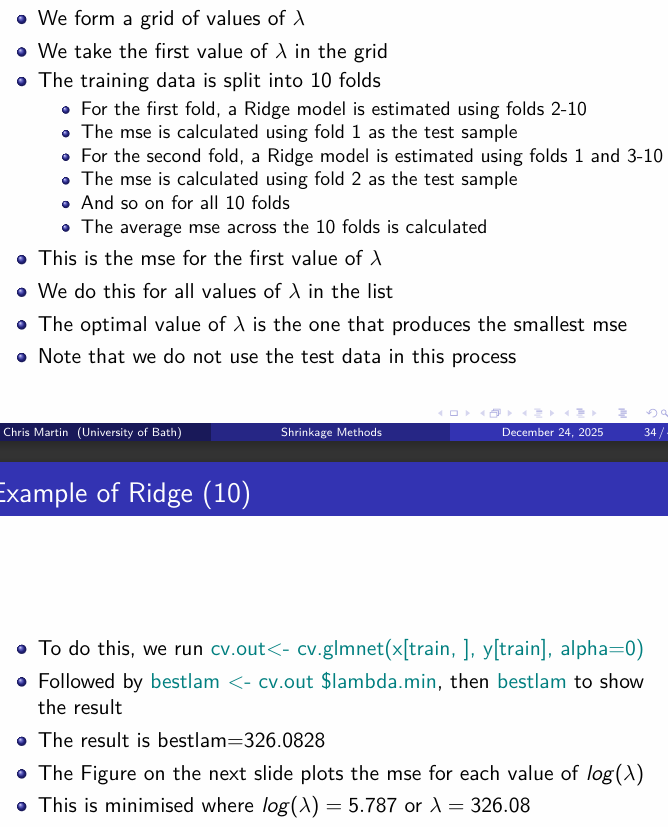
What does the distribution of mse for each value of log(λ) look like?
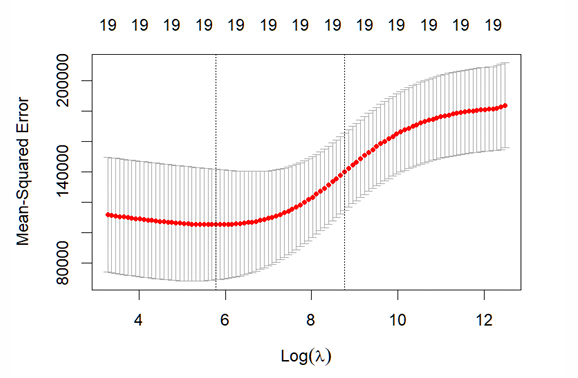
How can we find the mse for this optimal λ?
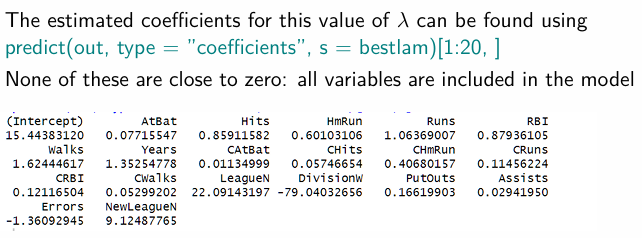
How do we find the estimated coefficients for the optimal λ?
How do we estimate the models using Lasso?
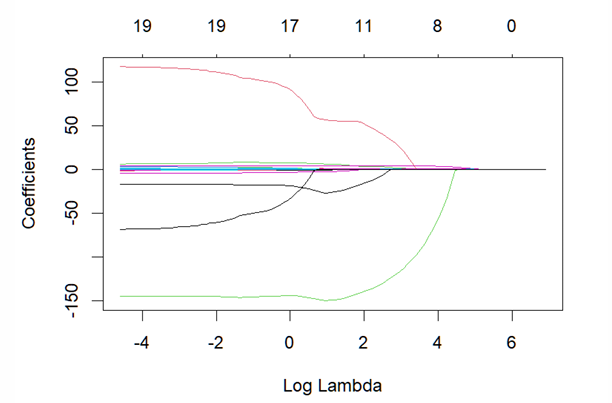
What does the plot of estimated coefficients for each value of logλ look like for Lasso?
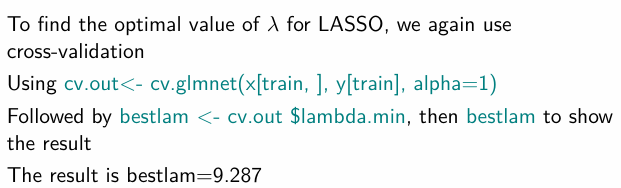
How do we obtain the optimal value of λ for Lasso?
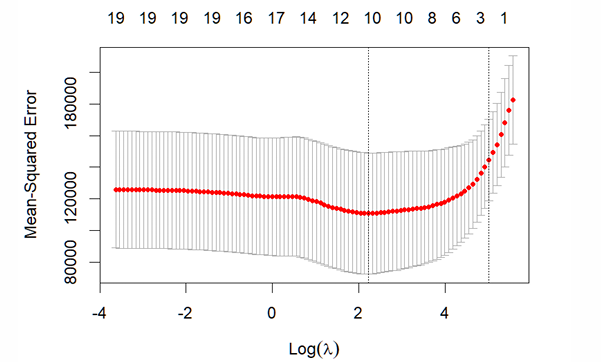
What does the plot of mse and logλ look like?
How do we obtain the mse for the optimal λ in Lasso?

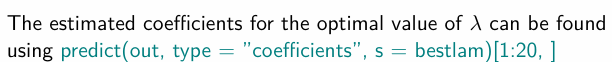
How can the estimates coefficients for the optimal λ be found for Lasso?
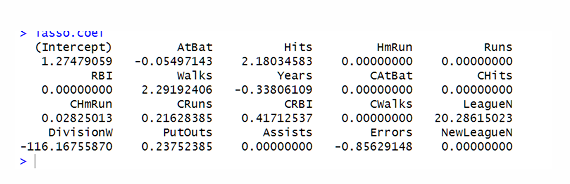
What can we infer from the Lasso coefficients at the optimal λ?