KNES 260 final UMD
1/228
There's no tags or description
Looks like no tags are added yet.
Name | Mastery | Learn | Test | Matching | Spaced |
|---|
No study sessions yet.
229 Terms
List the types of physical activity and examples
speed (track/ swimming), strength (weight lifting), skill (golf/ baseball), power (strength/ time), endurance (long distance running).
Which type of physical activity most affects the cardiovascular system?
Endurance training
Why should you be concerned about VO2 max?
-it is closely associated with endurance performance
-there are many health benefits of a high VO2 max
What are the four criteria for assessing an endurance training exercise program?
F- frequency
I- intensity
T- time
T- type
Respiration
O2 diffusion
Ventilation
movement of air in and out of the lungs
Central circulation
Cardiac output, blood moving in and out of the heart
Peripheral circulation
flow to non-exercising regions, muscle blood flow, muscle capillary density.
Muscle metabolism
enzymes, energy stores, myoglobin, mitochondria size/ number, muscle mass, fiber type, and substance delivery.
Absolute vs relative work rates
absolute work rates= same running, cycling, walking, or swim speed
relative work rates- different running, cycling, walking or swim speeds but working at the same % of VO2 max.
Calculating intensity from maximum heart rate
-measure maximal heart rate or estimate it from the equation 220-age in years
-multiply the desired intensity as a fraction of 1.00 by the maximal heart rate.
example: multiply max heart rate by .7% to determine 70% of a person's maximal heart rate.
Karvonen equation
Target Heart Rate= desired intensity (max heart rate- resting heart rate)+resting heart rate
negative= not as easy or simple
positive= valid across entire range of exercise intensities
1978 college of sports medicine position stand
frequency: 3-5x per week
intensity: 50-80% of VO2 max, 50-85% of heart rate reserve and 60-90% of heart rate maximum
time: 15-60 minutes continuously
type: any type of activity that uses large muscle groups can be maintained continuously and is rhythmical and aerobic in nature
1990 college of sports medicine position stand
frequency: 3-5 days per week.
Intensity: 50-85% of vo2 max, 50-80% of heart rate reserve, 60-90% of heart rate maximum
time: 20-60 minutes
type: any activity that uses large muscle groups and can be maintained and is rhythmic and aerobic in nature.
*add strength training to muscle mass.
1995 centers for disease control, American college of sports medicine
Moderate-hard intensity > brisk walking
-preferably everyday
-accumulative> 30 minutes per day
Pros of this program is that its very user friendly and very motivating.
1998 american college of sports medicine position stand
frequency: 3-5 days per week.
Intensity: 40-85% vo2 max or heart rate reserve, 50-90% of HR reserve
time 20-60 minutes continuous or internment
type: any rhythmical aerobic activity that uses large muscle groups
add flexibility and exercise and muscle mass training.
Things to consider when designing a physical activity program
physical abilities or disabilities
motivation
current health/ fitness
goals!
Session duration for measuring change in VO2 max
frequency: 5 sessions per week
duration: 45 minutes/ session
training intensity: > vo2 max
intensity: as high as possible
this is close to athlete training!
What is the best form of exercise?
swimming, walking, and biking are all equally affective
Hickson et al 1977 study
Design: 8 sedentary healthy subjects, aged 20-42 years, 10 weeks of intense training (6 days per week), 3 days cycle ergometer intervals <6x 5 minutes at 100% VO2 max with 2 minutes rest, 3 days of 30 minute running at highest maintainable pace
results: initial VO2 max: 40, final 55 with values continuing to rise, 44% increase in vo2 max over 10 weeks of training, rate of increase was linear.
Seals et al study design
Design: 24 healthy sedentary men and women, 60-69 years old, randomly assigned 14 exercises, 10 sedentary controls, studies at baseline, 6 months of low intensity training at 40% VO2 max, followed by reevaluation then 6 months of high intensity (70% of VO2 max) follows by reevaluation.
Seals et al study results LOW INTENSITY
Low intensity group had an average of 14% increase in vo2 max, but the range of increase was 1-40%, total % increase in vo2 max was 30%
Seals et al study results LOW INTENSITY- HIGH INTENSITY
LI-HI had an average increase of 16% in VO2 max, but the range was 1-39%, total % increase in Vo2 max was 8-49%
Hagberg et al study
47 healthy 70-79 men and women assigned to control or resistive endurance exercise training groups, 6 months of training vo2 max measured after 3 and 6 months.
Hagberg et al study results for endurance training
Endurance training vo2 max initially was 22.5, after 13 weeks it was 25.8%, the final result was 27.1%
Hagberg et al study results for resistive training
resistive training, the initial vo2 max was 22.5, after 13 weeks, it was 23.6, and the final was 23.3.
Hamburg et al study results for control group
initial 22.2, 13 weeks not measured, final 22.0
Overall summary of the effect of exercise training on cardiovascular fitness
Cardiovascular fitness is an individual major CVD risk factor
Can be altered markedly with exercise training
increases by 10-20% in young people with training
increases>30% in young people with intense training
increase is important to training. intensity and increases are similar in older people
Lee, Hsich, Paffenberger exercise intensity and longevity in men, JAMA 1995
17,321 men, Physical activity assessed by Paffenberger questionnaire in 1962 or 66. Mortality assessed in '88, 3728 deaths in the 22-26 year follow up.
conclusion: vigorous but not non-vigorous activities were associated with weight loss> longevity, pertain to only all cause mortality, non-vigorous exercise are beneficial to other aspects of health.
Blair et al
Changes in physical fitness and all-cause mortality, 9777 men, 5-year average follow-up, 223 total deaths, 87 from CVD.
Conclusion: men who maintained or improved to adequate levels of physical fitness were less likely to die from any cause of CVD than unfit men.
Expectations for lipid changes with exercise training
-cholesterol decreases by 10 mg/dl (a large amount)
-LDL cholesterol decreases by 10 mg/dl
HDL cholesterol increases by 5 mg/dl
triglycerides decrease if initially high
Plasma lipid levels in runners and sedentary men
this is the answer

HDL-C levels in older runners
Subject. HDL-C levels
master run. 66
older (lean/untrained). 45
older (obese/untrained). 42
Hagberg study's show______
that older distance runners who have been very sedentary peers than we would expect from above
Rogers et al.: Effect of 7 years of exercise training on plasma lipid levels
cholesterol levels for baseline, 1 year and 7 years.
B: 218,
1: 208,
7: 210

Rogers et al.: Effect of 7 years of exercise training on plasma lipid levels
LDL-C levels for baseline, 1-year and 7 years
B: 150
1: 140
7: 127
Rogers et al.: Effect of 7 years of exercise training on plasma lipid levels
HDL-C levels for baseline, 1-year and 7 years
B: 38
1: 45
7: 53
Rogers et al.: Effect of 7 years of exercise training on plasma lipid levels
Triglyceride levels for baseline, 1-year and 7 years
B: 184
1: 105
7: 123 ( no further effect )
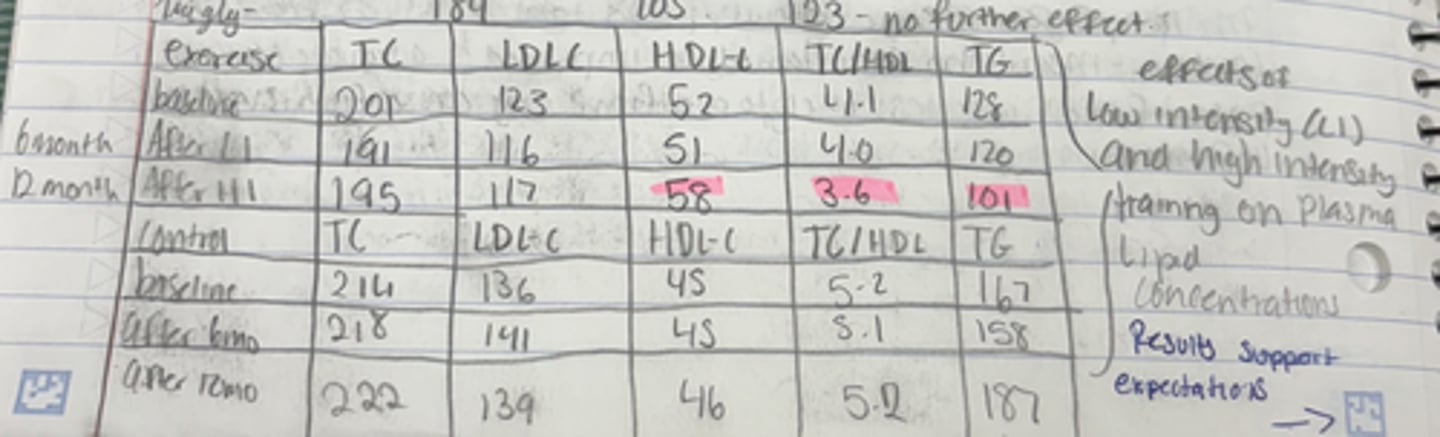
Rogers et al.: EXPERIMENT GROUP effects of low intensity and high-intensity training on plasma lipid concentrations
Baseline levels for Total cholesterol, LDL-C. HDL-C. Tc/HDL, Triglyceride
Baseline TC: 201
Baseline LDL:123
Baseline HDL:52
Baseline TC/HDL: 4.1
Baseline Triglyceride: 128
Rogers et al.: EXPERIMENT GROUP effects of low intensity and high intensity training on plasma lipid concentrations
AFTER 6 MOTNHS OF LI training
TC: 191
LDL: 116
HDL: 51
TC/ HDL: 4.0
Trigliceride: 120
Rogers et al.: EXTPERIMENT GROUP effects of low intensity and high intensity training on plasma lipid concentrations
AFTER A YEAR OF HI TRAINING (another 6 months)
TC: 195
LDL: 117
HDL: 58
TC/ HDL: 3.6
Trigliceride:101
Rogers et al.: CONTROL GROUP effects of low intensity and high intensity training on plasma lipid concentrations
Baseline values
TC: 214
LDL: 136
HDL: 45
TC/ HDL: 5.2
Trigliceride: 167
Rogers et al.: CONTROL GROUP effects of low intensity and high intensity training on plasma lipid concentrations
after 6 months values
TC: 218
LDL: 141
HDL: 45
TC/ HDL: 5.1
Trigliceride:158
Rogers et al.: CONTROL GROUP effects of low intensity and high intensity training on plasma lipid concentrations
after 12 months values
TC: 222
LDL: 139
HDL: 46
TC/ HDL: 5.2
Trigliceride: 187
What were the one year changes observed from baseline values for the exercise group in Rogers et al.
Total cholesterol -4.9
HDL-C: +1.8
HDL2-mass: +26.1
LDL-C: -5.2
None of these changes are statistically different
What were the one year changes observed in the control group of Rogers et al.
Total cholesterol: 1.8
HDL C: 0.5
HDL2-mass: 10.5
LDL-C: 1.3
clearly not statistically different
Why were the results of Rogers et al not statistically different?
* not all participants did the appropriate exercise for the exercise group. If you exercise >8x per week (walking> 8x per week) stat differences were found in exercise groups
* observing genetic differences explains why some people are more responsive to exercise training than others

Genetic and lipid changes with exercise training: change in cholesterol APO T2 genotype and APO T3/4 genotype
APO T2 GENOTYPE: -2
APOT3/4 GENOTYPE: -19
Genetic and lipid changes with exercise training: change in HDL-C APO T2 genotype and APO T3/4 genotype
APO T2 GENOTYPE: +12 (good change and very different)
APOT3/4 GENOTYPE: +2
Genetic and lipid changes with exercise training: change in HDL2-C APO T2 genotype and APO T3/4 genotype
APO e2 GENOTYPE: +9 (good change and very different)
APOe 3/4 GENOTYPE: 0
Which APO gene is more likely to have a greater change in cholesterol
APO e2 is more likely because it is very important in metabolizing cholesterol
genetics and lipid changes with exercise training change in cholesterol, HDL-c and HDL2-c with the LPL Pvull -/- genotype
cholesterol: -14, not a large diff
HDL-C: +11, large diff
HDL2-C: +9, large diff

genetics and lipid changes with exercise training change in cholesterol, HDL-c and HDL2-c with the LPL Pvull + carriers
Cholesterol: -19, not a large diff
HDL-C: +2,
HDL2-C: 0
Which LPL cholesterol genotype has the greater advantages from exercise to get rid of lipids?
LPL-L
Who saw the greatest changes with exercise training in their HDL-C levels?
People with existing high/ normal HDL levels saw the biggest increase, "the rich get richer"
Changes in plasma lipids with diet and diet/ exercise (Men control)
Cholesterol: -5
LDL-C: -8
HDL-C: -2
HDL2-C: -3
2 multiple choice options
Changes in plasma lipids with diet and diet/ exercise (Men diet)
Cholesterol -16
LDL-C: -15
HDL-C: +1
HDL2-C -3 (not good)
Changes in plasma lipids with diet and diet/ exercise (Men D+E)
Cholesterol: -14
LDL-C: -11
HDL-C: +5 (yay)
HDL2-C: +1
Changes in plasma lipids with diet and diet/ exercise (Women Control)
Cholesterol: -1
LDL-C: -1
HDL-C: -2
HDL2-C: -4
2 multiple choice options
Changes in plasma lipids with diet and diet/ exercise (Women diet)
Cholesterol: -15
LDL-C: -11
HDL-C: -6 bad
HDL2-C:-8 bad
Changes in plasma lipids with diet and diet/ exercise (Women D+E)
Cholesterol: -11 yay
LDL-C: -11 yay
HDL-C: +1 small yay
HDL2-C: -1 bruh
How many were able to decrease their systolic blood pressure significantly with exercise training?
76%, the other 24% had small reductions that were not statistically different.
What did the reduction in systolic blood pressure average
10.6 mmHg from an average initial value of 153 mmHg (not thrilled but headed in the right direction)
What is the effect of exercise training on diastolic blood pressure?
81% decreased diastolic blood pressure significantly with exercise training, reduction averaged 8.2 mmHg from an average initial value of 97mmHg. (not thrilled but headed in the right direction)
Blumenthal et al (1991) study design
Subjects: 99 stage 1 hypertensive men and women
randomly assigned to endurance exercise training, strength/ flexibility training or control group
Blood pressure measured before and after 4 months of training
Blumenthal et al (1991) results for endurance group
systolic BP: -8
diastolic BP: -6
2 multiple choice options
Blumenthal et al (1991) results for strength/ flexibility group
systolic BP: -7
diastolic BP: -6
Blumenthal et al (1991) results for control group
systolic BP: -9
diastolic BP: -5
What was the overall outcome of the Blumenthal et al. (1991) study results
They were not statistically different
Blood pressure reductions in hypertensives with HIGHER exercise training intensities
(systolic BP)
Weighted average reduction: 6.8 mmHg
Groups with significant reduction %: 75
Total sample side: 286
Blood pressure reductions in hypertensives with LOWER exercise training intensities
(systolic BP)
Weighted average reduction: 9.5 mmHg
Groups with significant reduction %: 64
Total sample side: 383
Blood pressure reductions in hypertensives with HIGHER exercise training intensities
(diastolic BP)
Weighted average reduction: 6.8 mmHg
Groups with significant reduction %: 73
Total sample side: 237
Blood pressure reductions in hypertensives with LOWER exercise training intensities
(diastolic BP)
Weighted average reduction: 7.0 mmHg
Groups with significant reduction %: 78
Total sample side: 477
What was the shocking result when Blumenthal et al. (1991) found when changing exercise intensities?
Lower intensity training may possibly be beneficial for hypertensives just as much as high intensity training.
Hagberg et al. (1989) study design
-60-69 year old sedentary men and women with essential hypertension.
-control group
- 2 exercise training intensities: 50 and 70% of VO2 max.
-Both groups restudied after 3 and 9 months.
What is essential hypertension?
High blood pressure with no identifiable cause.
Hagberg et al 1989 study results
-moderate intensity saw greater reductions in systolic BP (-20 mmHg) after 9 months, while higher intensity only decreased 10 mmHg.
-diastolic BP saw similar changes in both groups, but low intensity had greater reductions.
-evidence that shows intensity exercise training lowers blood pressure in older hypertensives the same, or more than higher intensity (yay)
Blood pressure reductions in hypertensives with different lengths of exercise training systolic bp 1-10 weeks
Weighted average reduction: -9.5
groups with significant reductions:71
total sample size: 336
2 multiple choice options
Blood pressure reductions in hypertensives with different lengths of exercise training systolic bp 11-20 weeks
Weighted average reduction: -11.1
groups with significant reductions: 65
total sample size: 440
Blood pressure reductions in hypertensives with different lengths of exercise training systolic bp 21+ weeks
Weighted average reduction: -10.9
groups with significant reductions: 64
total sample size: 145
Blood pressure reductions in hypertensives with different lengths of exercise training Diastolic bp 1-10 weeks
Weighted average reduction: 7.1
groups with significant reductions: 79
total sample size: 357
2 multiple choice options
Blood pressure reductions in hypertensives with different lengths of exercise training Diastolic bp 11-20 weeks
Weighted average reduction: 9.3
Groups with significant reductions: 74
Total sample size: 418
Blood pressure reductions in hypertensives with different lengths of exercise training Diastolic bp 21+ weeks
Weighted average reduction: 9.6
Groups with significant reductions: 75
Total sample size: 159
What pattern was noticed with Hagberg (1989) study results?
reductions happen quickly with blood pressure (yay), but do not continue to decrease as significantly with more time (boo)
Taylor-Tolbert, 2009, effect of a single bout of exercise on blood pressure, study design
-11 men, average 60 years old, stage 1 or 2 hypertension
-ambulatory BP was measured for 24 hours on 2 days
-one day was a control day where patients came in with no prior exercise
-day2 was an exercise training day where patients did 3 15 minute exercise sessions at 70% VO2 max
Taylor-Tolbert, 2009, effect of a single bout of exercise on blood pressure, study results
-systolic control day and exercise had similar results but exercise training day has a 15 mmHg reduction for the first few hours, then as time passed the two groups had similar blood pressure levels.
-diastolic blood pressure had similar results. Some evidence indicated a single bout of exercise training can lower blood pressure for the next 24 hours
SIGNIFICANT REDUCTIONS IN BOTH GROUPS
Taylor-Tolbert 2009, age and blood pressure reductions in hypertensives with exercise training SYSTOLIC BP 21-40 age
Weighted average reduction: 6.7
Groups with sig reductions: 28%
total sample size: 157
2 multiple choice options
Taylor-Tolbert 2009, age and blood pressure reductions in hypertensives with exercise training SYSTOLIC BP 41-60 age
Weighted average reduction: 12.4
Groups with sig reductions: 83%
total sample size: 673
Taylor-Tolbert 2009, age and blood pressure reductions in hypertensives with exercise training SYSTOLIC BP 61+ age
Weighted average reduction: 6.8
Groups with sig reductions: 55%
total sample size: 151
Taylor-Tolbert 2009, age and blood pressure reductions in hypertensives with exercise training DIASTOLIC BP 21-40 age
Weighted average reductions: 9.9
Groups with sig reductions: 80%
Total sample size: 131
2 multiple choice options
Taylor-Tolbert 2009, age and blood pressure reductions in hypertensives with exercise training DIASTOLIC BP 41-60 age
Weighted average reductions: 8.5
Groups with sig reductions: 76
Total sample size: 579
Taylor-Tolbert 2009, age and blood pressure reductions in hypertensives with exercise training DIASTOLIC BP 61+ age
Weighted average reductions : 8.8
Groups with sig reductions: 75%
Total sample size: 55
Taylor-Tolbert, effect of race on blood pressure reduction in hypertensives with exercise training
systolic bp caucasians
Weighted average reductions: 7.3
Groups with sig reductions: 4.6%
Total sample size: 458
Taylor-Tolbert, effect of race on blood pressure reduction in hypertensives with exercise training
systolic bp again/ pacific American
Weighted average reduction: 11.9 (has an effect)
Groups with sig reductions: 9.2%
Total sample size: 142
Taylor-Tolbert, effect of race on blood pressure reduction in hypertensives with exercise training
Diastolic bp white
Weighted average reductions : 6.8
Groups with significant reductions: 70%
Total sample size: 409
Taylor-Tolbert, effect of race on blood pressure reduction in hypertensives with exercise training
Diastolic bp Asian/ pacific American
Weighted average reduction: 6.6 (no effect)
Groups with significant reduction: 85%
Total sample size: 156
Gordon et al. study design
-sedentary overweight with high normal blood pressure or hypertension
-randomly assigned to weight loss via diet, exercise training without weight loss or exercise training with weight loss
-intervention length 12 weeks
What combination had the largest reductions in blood pressure according to Gordon et al. study?
Exercise + diet
Did all groups in the Gordon et al. study significantly reduce their systolic and diastolic blood pressure?
Yes
Was there a significant difference in blood pressure reduction when comparing the groups in the Gordon et al. study?
No