4.5 Role of the state in the macroeconomy
1/28
There's no tags or description
Looks like no tags are added yet.
Name | Mastery | Learn | Test | Matching | Spaced | Call with Kai |
|---|
No analytics yet
Send a link to your students to track their progress
29 Terms
Different public expenditures
Capital expenditure
Current expenditure
Transfer payments
Capital expenditure
Long-term investments in infrastructure + capital equipment
e.g. high speed railway projects, new hospitals + schools
Current expenditure
The daily payments required to run the government + public sector
e.g. wages+salaries of public employees like teachers, police, judges, etc, payments for medical equipment for the NHS
Transfer payments
Payments made by the gov. to individuals/ groups for which no goods/ services are exchanged in return
e.g. disability payments, unemployment benefits, subsidies
Reasons for changing size + composition of public expenditure
Changing demographics
Ageing population due to higher LE + livings standards and lower birth rates: more spending on pension payments + healthcare
Changing economic conditions
Global financial crisis 2008: UK gov borrowing increased to stimulate economic growth which then had to be paid back which caused a cut in expenditure
Changing incomes
low incomes mean less tax revenue leading to ↓ expenditure, high income means higher tax revenue and more demand for services e.g. libraries + recycling facilities so ↑ expenditure
Significance of differing levels of public expenditure on:
Productivity + growth
higher spending on investment like education, infrastructure can enhance human capital + physical capital, so higher productivity + economic growth.
-without profit incentive in public sector, resources allocated inefficiently, ↓ growth
Living standards
spending on welfare programs, education, etc can improve living standards by providing essential services
-creates opportunity for corruption which leads to lower living standards
Crowding out
spending leads to budget deficit + crowding out, where increased borrowing leads to higher interest rates, reducing private sector investment + growth.
Level of taxation
spending requires higher taxes to pay off debt, impacting disposable incomes + economic incentives (subsidies, tax incentives).
Equality
spending reduces inequality by providing support for disadvantaged groups + funding healthcare+education accessible for all citizens
-if spending not spread equally between regions, it creates inequality of opportunities e.g. North/South divide UK
Different types of taxes
Progressive: as income ↑, a larger % is paid in tax e.g. corporate, income in UK- 0% up to £12.5k, 20% from £12.5-50k.
Regressive: as income ↑, a smaller % is paid in tax e.g. VAT, fuel duty in UK
Proportional: % of tax paid is constant for all income levels e.g. Bolivia income tax rate is 13%
Effects of changing tax on incentive to work
High income tax lowers the incentive to work more/ overtime or for the unemployed to seek work.
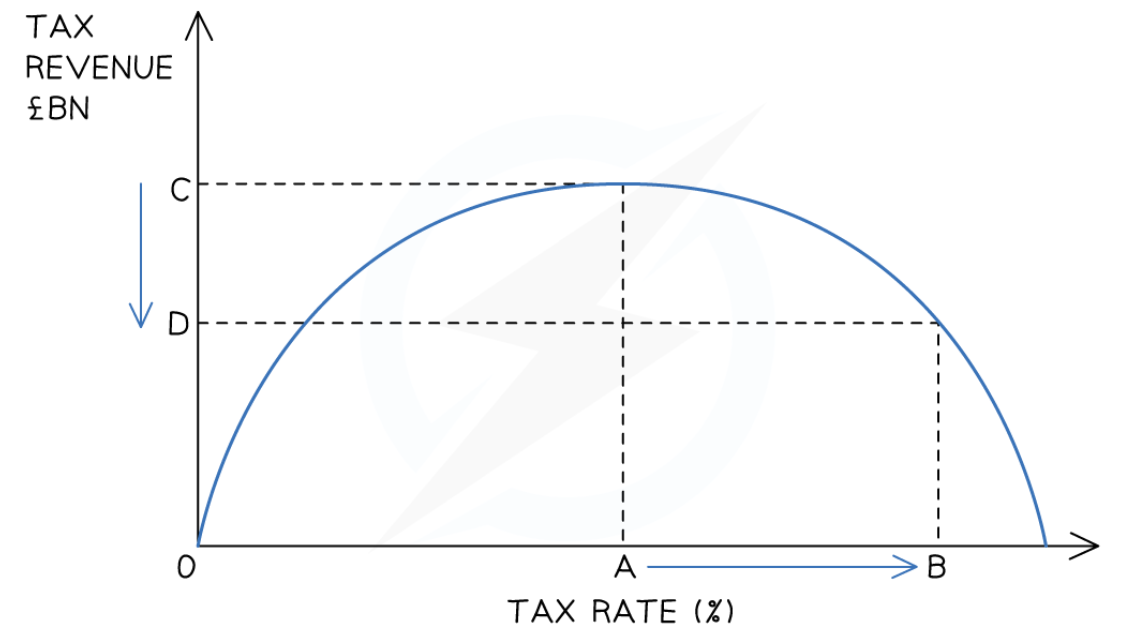
Effects of changing tax on tax revenue
Demonstrated by Laffer curve: as tax rate rises, tax revenue increases. At some point, higher tax rates will discourage economic activity e.g. ppl work less, move their income elsewhere(brain drain), more people will try avoiding paying tax, resulting in lower tax revenue.
Effects of changing tax on income distribution
Progressive tax systems impose higher taxes on high income earners, redistributing income + reducing inequality.
-benefits of progressive taxes may be eradicated by multiple regressive taxes e.g. VAT, fuel duty
Effects of changing tax on real output + employment
Taxes ↑ → more money withdrawn from circular flow of income→ caused reduction in AD as firms + households have less disposable income→ less workers required for production→ unemployment rises
Effects of changing tax on price level
Increased taxes → increased CoP → increased CP inflation → workers may also demand higher wages due to lower disposable income → increased wages → increased CP inflation
Effects of changing tax on the trade balance (X-M)
Higher taxes→ reduces disposable income → less able to import goods → import tariffs may also lead to less imports due to high cost of importing
-retaliation by trading partners
Effects of changing tax on FDI flows
Low rate of corporate tax/ favourable tax conditions → more investors+businesses attracted→more FDI
Automatic stabilisers vs discretionary fiscal policy
Automatic stabilisers: automatic fiscal changes as the economy moves through the business cycle
e.g. fall in tax revenue during a recession or increase in welfare benefits paid when unemployment is rising
Discretionary fiscal policy: Deliberate changes in gov expenditure + tax policies to influence AD
Fiscal deficit vs national debt
Fiscal deficit: when the level of gov spending is greater than gov tax revenue in any given year.
National debt: the accumulation of previous deficits. The deficit in one year adds to the national debt from previous years.
Structural vs cyclical deficits
Cyclical deficit: a temporary deficit that occurs due to downturns in the business cycle.
e.g. during a recession, gov receives less tax revenue as profits+income falls, while gov. spending increases
tends to self-correct as economy grows again
Structural deficit: a deficit that occurs when there’s an imbalance in revenue+expenditure of the gov, and is present at every point of the business cycle- even at full employment + output
difficult to correct
may be caused by a widespread tax avoidance culture or poor governance
Factors influencing the size of fiscal deficits
State of the economy
automatic stabilisers: gov tax revenue ↑ during boom and ↓ during recession, gov spending ↓ during boom and ↑ in recession.
higher incomes+price level in boom- ↑ revenue, ↓ spending on welfare benefits
Political priorities
UK gov ↑ taxes and ↓ spending after 2008 Global Financial Crash, reducing size of deficit, higher spending to UK military industry in help to Ukraine.
Demographics
Ageing population due to higher LE + livings standards and lower birth rates: more spending on pension payments + healthcare, less tax revenue due to less people in work +less income.
Factors influencing the size of national debt
Size of fiscal deficit
the higher the size of deficit, the higher the national debt each year.
if country were to run budget surplus, this revenue could be used to pay back some debt, reducing size of national debt.
Gov policies
tax + gov spending policies change size of fiscal deficit, hence changing size of national debt.
reducing corporate tax will reduce gov revenue+create a deficit, leading to higher national debt
Interest rates
↑ interest rates → ↑ cost of borrowing → gov needs to pay more interest back on spending → more national debt e.g. on gov bonds
Significance of size of fiscal deficits + national debt
(what do they impact)
Debt servicing
Higher opp. cost to pay back debt + interest. e.g. money spent servicing debt could be spent on improving education instead.
Inflation
If gov ↑ spending and there’s no fall in private sector spending, AD will rise, causing DP inflation. Also, if gov is unable to borrow money, they may print more money e.g. Germany in 1923, causing hyperinflation.
+however, inflation means more tax revenue which can reduce debt.
Credit rating
High levels of debt as a proportion of GDP leads to lower credit rating, so global lenders will become more concerned to continue lending. Interest rates will have to rise as there’s less supply of money + more fear of bailout.
Measures to reduce fiscal deficits + national debt
+ impacts
Reduce gov spending+ increase taxation
reduced spending on infrastructure, healthcare education
reduced quality + no. of services→ job losses+less income tax revenue→ reduced quality of human capital→ reduction in LRAS
increase in taxation+ reduced gov spending
cut in AD→ regressive taxes may harm those on lower incomes→ higher income inequality→lower economic growth
Increase gov spending
spending will stimulate higher demand→more economic growth→higher incomes→higher tax revenue→ reduce size of debt → DP inflation → value of debt is lower than it was previously → have less to pay back
Measures to reduce poverty+inequality
+ impacts
Progressive tax system
rich are taxed more, poor taxed less→more tax burden on the rich→ enables cuts in regressive taxes, increase in welfare benefits as tax from rich are spent on benefits to poor→less inequality
reduced incentive to work more + harder, fall in gov. tax revenue
National min/max wage
prevents employers exploiting their workers with low wages → increased disposable income→can afford necessities→increased standard of living
prevents top earners from earning extremely high salaries→ reduce gap in wages between employees→ more can be paid to low earners→reduced inequality
min wage causes unemployment (there is excess supply of labour), max wage causes shortage of skilled workers as they become disincentivised by low wages
Impact of changing interest rates + supply of money
Change in interest rates
respond to domestic needs e.g. high interest rates control inflation
respond to global dynamics e.g. ↓ interest rates to appreciate exchange rate when there are low exchange rates worldwide (more attractive to investors, ↑ demand for currency, appreciate exchange rate)
Changes in money supply
↑ supply of money via QE→ cheaper for banks to lend→ less expensive for consumers + firms to borrow→ more spending→ higher growth→ higher inflation
e.g. after financial crash 2008, UK used QE as interest rates could not be lowered further
Measures to increase international competitiveness
+impacts
Supply side-measures- investment, deregulation
increase skills + productivity, encourage efficiency→ enhanced human capital→ more competition→ lower cost of production→ lower export prices → more competitive
Exchange rate policy
devalue currency→ imports expensive, exports cheaper→ more exports + export revenue→ more competitive
Policies to respond to external shocks
expansionary fiscal policy
deflationary (contractionary) policy
manipulating interest rates
manipulate exchange rate
bailouts from international organisations
may only provide short-term relief- unsustainable + may lead to further instability in future
moral hazard
Measures to control TNC’s operations
regulation of transfer pricing
limits to gov ability to control TNC’s
Regulation of transfer pricing
Transfer pricing: a firm produces a good in a high-tax country and then transfers it to a lower-tax country to make it into another good which it then sells.
firm will set price low in the high-tax country, and raise in low-tax country
overall aim is to ↑ profits by reducing overall tax bill
Arm’s length Principle as stated in the OECD guidelines: transactions between 2 related parties be priced the same as if the 2 parties were independent of each other.
Ability to control TNC’s
difficult for gov’s to control TNC’s- small countries earn less revenue than TNC’s in profit.
EU suffers tax avoidance schemes e.g. Double Irish Dutch sandwich: holding company sends profits to a Dutch/ Irish subsidiary. Then, transfers money to bank account in the Bahamas (basc. tax free)
any policy to control this would negatively affect the tax havens, as they’d lose tax revenue
Problems policymakers face when applying policies
Inaccurate information
data lags reality as economic conditions change quickly e.g. Bank Of England make decisions based on past data
data on unemployment, inflation, GDP, etc is useful to identify trends, but reason behind trends is not always clear, so policies may be based on incorrect assumptions
Risks + uncertainties
hard to identify risk/ size of risk: gov can’t fully know impact of decisions as consumers react unexpectedly
uncertainties may not be identifiable when policy is instituted e.g. impact of Brexit had unforeseen outcomes like small UK firms relocating to Europe to avoid excessive export costs
Inability to control external shocks
globalisation has made it difficult to prevent shocks- gov may be unable to control + prepare, may result in undermining current policies e.g. Covid ↑ gov spending