3.6: Age structure diagrams
1/4
There's no tags or description
Looks like no tags are added yet.
Name | Mastery | Learn | Test | Matching | Spaced | Call with Kai |
|---|
No study sessions yet.
5 Terms
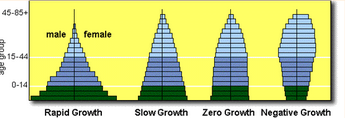
Age structure diagram
A visual representation of the number of individuals within specific age groups for a country, typically expressed for males and females.
Population momentum
“Why Populations Keep Growing”
Population momentum occurs when a country’s fertility rate declines to or below replacement level (2.1 children per woman), yet the population size continues to grow due to the age structure of the population.
The higher the percentage of young people in a population, the more growth the country will see
Types of Growth (Age structure diagram)
Each bar represents 5 years
The total area of the bars represents the size of the whole population
Three broad categories: pyramid, column, inverted pyramid
Total fertility rate (TFR)
An estimate of the average number of children that each woman in a population will bear throughout her childbearing years.
Average births per woman
Not a measurement per 1,000
U.S. TFR ~ 1.64 (2020)
World TFR ~ 2.30 (2020)
Replacement-level fertility
The total fertility rate required to offset the average number of deaths in a population in order to maintain the current population size.
Compare replacement-level fertility with TFR to get a sense of a country’s level of development
Ex. TFR of 2.1 – replace parents and account for children who die before reproductive age