Master IB Exam Review
1/71
There's no tags or description
Looks like no tags are added yet.
Name | Mastery | Learn | Test | Matching | Spaced | Call with Kai |
|---|
No study sessions yet.
72 Terms
y-y1 = m(x-x1), where m is the slope and (x1, y1) is a point on the line.
point-gradient form
ax+by+c=0
standard form
polyhedron
A three-dimensional geometric figure with flat polygonal faces, straight edges, and vertices.
function
each input has only one output
R
rational number (number that can be written as a fraction
natural numbers
counting numbers
Whole numbers
all natural numbers and zero
integers
all whole numbers and their negative counterparts
Irrational numbers
numbers that cannot be expressed as a fraction of two integers. They have non-terminating, non-repeating decimal expansions
t(n)=Cn+t0
a function that represents a linear sequence, where C is the common difference and t0 is the first term.
Un=C(n-1)+U1
is a formula that defines the nth term of an arithmetic sequence, where U1 is the first term and C is the common difference.
Sn=(n/2)(U1+Un)
the formula for the sum of the first n terms of an arithmetic sequence, where U1 is the first term and Un is the nth term.
I=Crn
simple interest calculated on the principal amount over a specified period, where I is the interest earned, C is the principal amount, r is the rate of interest, and n is the time in years.
extrapolation
estimating a value outside the range of the given data interp
interpolation
estimating a value within the range of the given data f
functional relationship
variables are related to each other through an exact equation statis
statistical relationship
variables have no direct relationship, but tend to fit a pattern
= (x1+x2)/2
axis of symmetry equation
y=a(x-h)2+k
the vertex form of a quadratic equation that represents a parabola, where (h,k) is the vertex.
Un=u1rn-1
the general term of a geometric sequence, where u1 is the first term and r is the common ratio.
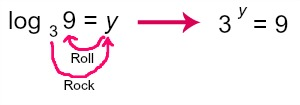
log39=y → 3y=9
how to roll the log
logarithms
the inverse functions of exponential functions
y=log(x)
the inverse of f(x)=10x
1
natural log times exponent or ln*e always equals
|a|
in y=a*sin(bx)+d how to find amplitude
360/b
y=a*sin(bx)+d how to find period
y=d
y=a*sin(bx)+d how find principal axis
(high point-low point)/2
how to find a in y=a*sin(bx)+d
(y1+y2)/2
how to find d in y=a*sin(bx)+d2-2
(x2-x1)2
how to find b in y=a*sin(bx)+d
opposite reciproccal
how to find perpendicular lines (slope)
normal
line perpendicular to the tangent
1) graph original function
2) trace # fro intersection point
3) calc dy/dx # for slope
4) use y=mx+b, plugging in intersection point coordinate and slope from previous steps
5) solve
steps for finding tangent
take tangent - change current slope for -1/m
how to solve for normal
2nd → trace →7
calculator steps for definite integral (finding the area under the curve between two x values)
gradient = m = y/x
constant of proportionality
angle of elevation
horizon and observer’s line of sight angle when looking upwards
angle of depression
horizon and observer’s line of sight angle when looking downwards
discrete
data that can be counted (natural numbers)conin
continuous
data than can be measured (height, weight)
univariate data
data that has only 1 variableqa
mode
the value that occurs most frequentlym
median
the value that lies in the middle when the data is arranged in sizemean
mean
sum of all values divided by the Humber of values
calc →1-var stats
calculator steps to find mean median mode
stat, sortA L1
steps for sorting data sets
(Q1-1.5(IQR)) and (Q3+1.5(IQR))
equations to calculate outliers
Q3-Q1
IQR equation
standard deviation
the spread of values in relation to the mean ( σ )
varience
the measure of spread that there is in the spread between the numbers in a list σ2
simple random sampling
selecting a sample completely at random sys
systmeatic sampling
for example, taking every fifth entry starting at a random place
convenience sampling
getting data by selecting people who are easy to reach
stratified sampling
selecting a random sample where numbers in certain categories are proportional to their numbers in the poulaiontqu
quota sampling
setting certain quotas for your sample
histogram
bar chart without space
box
teh iqr is represented by a ____ in a box and whisker plot
box’s center line
the median si represented by a ___ in a box and whisker plot
minimm and maximum
the whiskers extend to the ____ and _____ values in a box and whisker plot
cululative frequency
all of the total data points that are at or under the parameter
Q1
the 25% of highest values in cumulative frequency
median
cumulative frequency time .5
functional relationship
there is a formula or function that relates one variable to the other, so that all Data points lie on the same line or curves
statistical relationship
not such a direct relationship, but the data points, when plotted, may indicate a tendency to be close to a line or curve
r-value
correlation strength
line of best fit
line or scatter diagram showing trend followed by data points
mean point
found through mean of x-values and mean of y-values, always on line of best fit
cosecant
reciprocal sine function
secant
reciprocal cosine function
cotangent
reciprocal tangent function
x x*square root of 2
a 45 45 90 special right triangle have two sides of equal length _ and a hypotenuse of ____
x 2x x*square root of 3
on a 30 60 90 special right triangle - the side across from 30 degrees is length __, the hypotenuse is ___, nad the side across from 60 degrees (long side) is ____