Lecture 6 - One way ANOVA
1/19
There's no tags or description
Looks like no tags are added yet.
Name | Mastery | Learn | Test | Matching | Spaced | Call with Kai |
|---|
No analytics yet
Send a link to your students to track their progress
20 Terms
What does ANOVA mean?
Analysis of variance
What is the flaw of t-tests?
Limits the number of things that we can measure (2 means)
If you do t-tests repretedly, you expose youself to type 1 error
Restrictions on the number of means
T-tests have two sample means
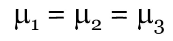
What is another way of saying all means are equal (null hypothesis)
No between groups varaibility (this is the null hypothesis)
As f gets larger
More between group variability
F is asking if you have so much in between group variability that if you picked up a plant out of the pile it probably wouldn’t be the mean
F has two degrees of freedom
When do you use an one way anova
When there is more than two experimental groups
Why don’t we just use multiple T-Tests
We want to limit type 1 error and if you do t-tests repeatedly, you would expose yourself to those errors
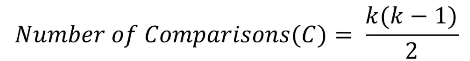
You can compute how many you would have to do with k
As my number of groups go up my number of comparisons go up which can get to be too many comparisons
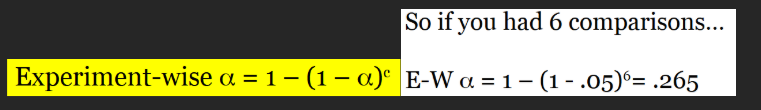
The more comparisons you make, the more chances you have of a type 1 error
alpha goes up and closer to 1 where your garunteed to hit a type 1 error
What happens to the alpha when there are many groups
Each test has an alpha (0.05), but when you do many t-tests, your alpha would change - 1/20 but your doing many tests so if there is 20, 1 will have an error
If i had 6 comparisons and your making them at 0.05 it might be 6.5
You will make a type 1 error eventually
ANOVA Null hyp
WE WANT TO SAY cov1,2 = cov 1,3 = cov 2,3
ANOVA Alternative Hypothesis
Not all population means are equal (at least two means are different from each other)
Doesn’t mean that they are all different
ANY TWO ARENT EQUAL TO EACHOTHER
3 Assumptions of a between subjects 1 way ANOVA
(if these conditions are met your ANOVA will be accurate)
Data is drawn from observations are normally distributed within each population (bell curve)
Variance in each group is equal (homogeneity of variance) → pooled variance
Observations are independent (each person is only giving you one observation which is what makes it one way) → if one person is under one condition they arent in the other
Partitioning Variance
How much of the observed variance in the DV is due to the manipulation (f-statistic)
What proportion in the DV is due to manipulation and what have percent is leftover'
breaking down the total amount of variation in a set of data into different sources to see where the differences come from
On average is there more variance due to the music playing or just error variance within a condition
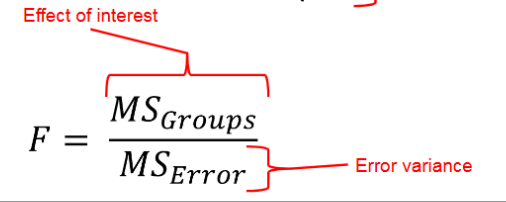
F
What poportion of the variance is due to the thing that we manipulated and what is just error
What is a source table
Organizing source of variance
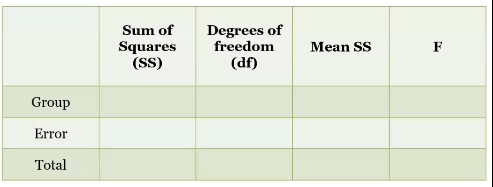
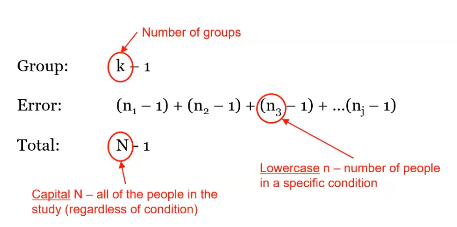
Group, error and total df
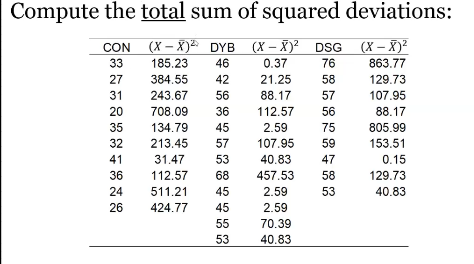
Calqulating ss total
SS total: Grand mean (ignoring groups) - Each score squared
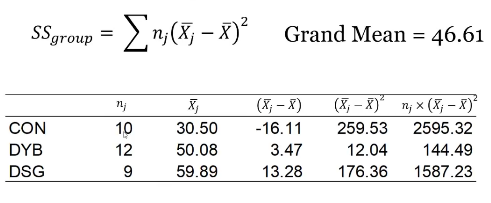
Calqulating group ss, and error ss
Add totals together
Error ss: total - group ss
Compute Mean SS
(dont fill last one, this is the overall variance)
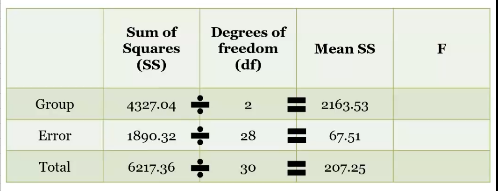
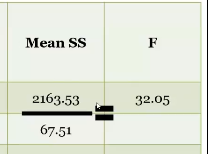
Calcuating F on the table
This is a ration
Greater than 1 = more variance due to the group than error
Look up f critical (find where df meet)

% of variation that can be attributed to the treatment differences (effect size)
Easy to calculate but slightly biased

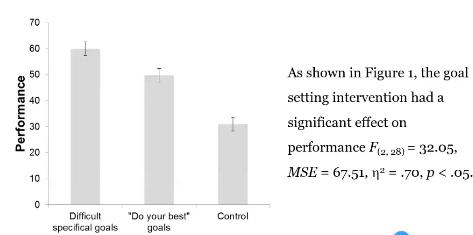
Example finding report (one way anova)
*without knowing what means are different for eachother